
Analyses how the stock has performed vs initial expectations and whether the fundamentals still look attractive
On Friday, Fintel covered stock Mr Cooper Group (NASDAQ:COOP) reported fourth quarter results to the market which satisfied investor expectations and resulted in shares rallying 4.30% over the day.
Q4 2022 hedge fund letters, conferences and more
Find A Qualified Financial Advisor
Finding a qualified financial advisor doesn’t have to be hard. SmartAsset’s free tool matches you with up to 3 fiduciary financial advisors in your area in 5 minutes.
Each advisor has been vetted by SmartAsset and is held to a fiduciary standard to act in your best interests.
If you’re ready to be matched with local advisors that can help you achieve your financial goals, get started now.
Mr Cooper is the largest non-bank loan servicer in the U.S. and was originally highlighted by the Fintel platform for having attractive quantitative metrics in various screens. In this article, we will unveil how the stock’s performance has affected each of the metrics previously described in the initiation report.
For the final quarter of 2022, Mr Cooper generated operational revenue in the servicing segment of $394 million, rising from $377 million Q3. Total revenues did decline from $510 million in Q3 to $303 million in Q4 due to a weaker origination segment and mark-to-market costs and a few other items. Total revenue was below the market’s forecast of around $390 million for the quarter.
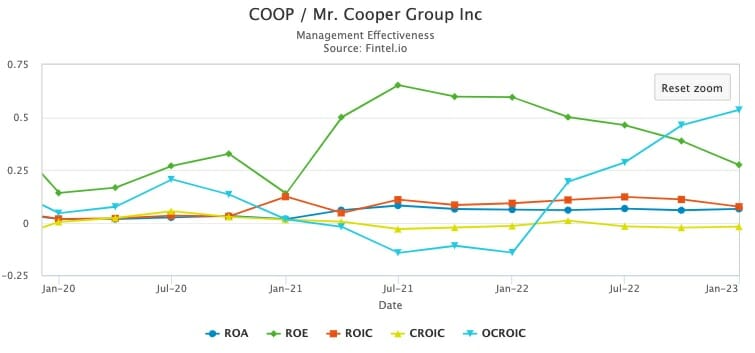
While sales have slipped over the last quarter, the group’s OCROIC (operating cash return on investor capital) has shown continued growth to its highest level in the past 5 years. OCROIC is a Fintel-created metric that shows the true underlying operating cash flow for a stock.
This is a measure that shows the true underlying operating performance that can not be manipulated by management the way that EPS can. The chart below shows how this metric has performed over the last 3 years against traditional performance metrics such as ROA, ROE, ROIC etc.
Pretax operating earnings for the servicing segment grew from $81 million in Q3 to $159 million in Q4 and was ahead of management’s $140 million guidance figure.
In the originations segment, the company reported a pretax operating loss of -$2 million, down from an operating profit of $46 million in Q3 as mortgage activity showed continued declining activity as a result of headwinds arising from the FED’s rate hiking cycle. The operating loss was also below management’s guidance of $10 million for the quarter.
While activity was weaker, Mr Cooper still grew the servicing UPB (unpaid principal balance) by 23% over the year to $870 billion. The group’s book value per share also increased by 29% over the year to $58.57.
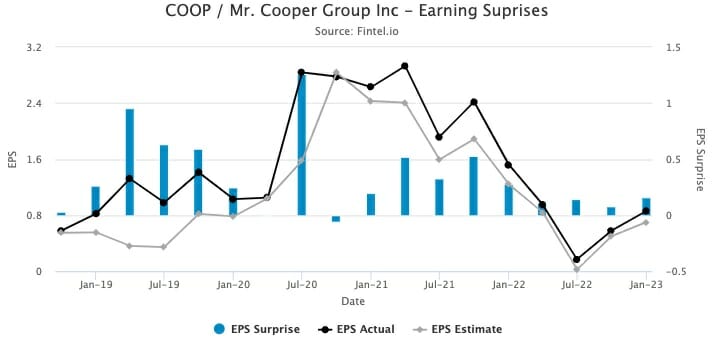
The group’s net income declined from $113 million in Q3 to $1 million in Q4. On an adjusted Non-GAAP basis the group generated earnings per share of 89 cents for the quarter and beat the street’s forecast of 69 cents per share.
COOP has a track record of reporting positive earnings surprises during most results as shown in the chart to the right from the earnings history page.
COOP’s Vice Chairman and President Chris Marshall told investors “Over the last year, we’ve continued to drive greater efficiencies throughout the company and especially in our servicing platform, which is key to the low-cost leadership strategy that’s driving customer growth and positioning us to deliver higher return on equity.”
Credit Suisse analyst Douglas Harter has an “outperform” rating and $57 target on the company and believes COOP’s improvement in servicing profitability positions the company to deliver higher ROEs over 2023. The analyst thinks the company is well positioned to take advantage of the opportunity in MSR acquisitions over the near term that could drive further returns.
Fintel’s consensus target price of $54.06 suggests the stock could see a further 16.16% upside over the next year.
Since our initiation report COOP’s value score has risen from 87.54 to 87.56. This tells us that the stocks relative valuation compared to peers has become more attractive over the last month. The stock continues to trade on an attractive PE ratio of 3.05x.
COOP’s fund sentiment score has declined from 72.87 to 62.63 following a decline in institutional ownership. This has been driven by a decline in the number of institutional investors from 594 to 584 over the last month. The stock continues to rank in the top 31% out of 36,375 global screened companies.
The quality score based on cash generating abilities has declined from 92.03 to (NEED SCORE) as the groups overall cash return on investor capital has declined at the group level. As highlighted earlier, the OCROIC score has shown growth over the quarter which we believe is a more important underlying measure of performance.
In total, the QVF (quality, value, fund sentiment) score has moved from 88.32 to (NEED SCORE).
Article by Ben Ward, Fintel


