Logica Capital commentary for the month ended March 31, 2021.
Q1 2021 hedge fund letters, conferences and more
Logica Absolute Return (LAR) – Upside/Downside Convexity – No Correlation
- Tactical/dynamic balanced Put/Call allocation – Symmetric Straddle
Logica Tail Risk (LTR) – Max Downside Convexity – Strong Negative Correlation
- Tactical/dynamic downside tilted Put/Call allocation – Ratio Straddle
March 2021 Performance*
Logica Absolute Return -0.1%
Logica Tail Risk -1.4%
VIX -8.55 pts
Naive Straddle -3.6%**
S&P 500 +4.2%
YTD Performance*
Logica Absolute Return -1.3%
Logica Tail Risk -2.8%
Naive Straddle -9.8%**
S&P 500 +5.9%
2020 Performance*
Logica Absolute Return +14.9%
Logica Tail Risk +15.1%
S&P 500 +17.4%
Summary: Month over month broad market/index performance disguised turbulence under the surface that is typical of elevated implied volatility (IV) regimes. At the same time, March saw a meaningful decline in S&P 500 near term at-the-money (ATM) IV, causing a significant headwind for long volatility strategies like ours – fortunately, this means we are approaching a more favorable environment.
* Returns are Gross of fees to illustrate strategy performance. Logica Absolute Return Fund returned -0.16% (net) for March 2021
** Naïve Straddle Return: a 1.5 month out, S&P 500 at-the-money put and call bought on the final trading day of prior month and sold on the final trading day of current month. This return on premium is then divided by a factor of 6 to be comparable to Logica’s typical AUM-to-premium ratio
Return Attribution & Portfolio Commentary
“I don’t run away from a challenge because I am afraid. Instead, I run toward it because the only way to escape fear is to trample it beneath your feet.”
-Nadia Comaneci, 5-time Olympic Gold Medalist
The overarching backdrop for the market’s continued upward surge, alongside volatility’s continued decline, is that sooner or later, something’s gotta give. The good news is that this elusive something is ever closer; with the CBOE Volatility Index (VIX) closing the month at 19.4, it is now well within a single standard deviation of its historical level of ~16-18, and concurrently, the S&P 500 is at all-time highs. This bodes well for either a continued market rally without as much volatility decline, or else some market downside with substantively more room for volatility to surge (the right skewness we know and love). Together, these are increasingly enticing characteristics for an S&P straddle.
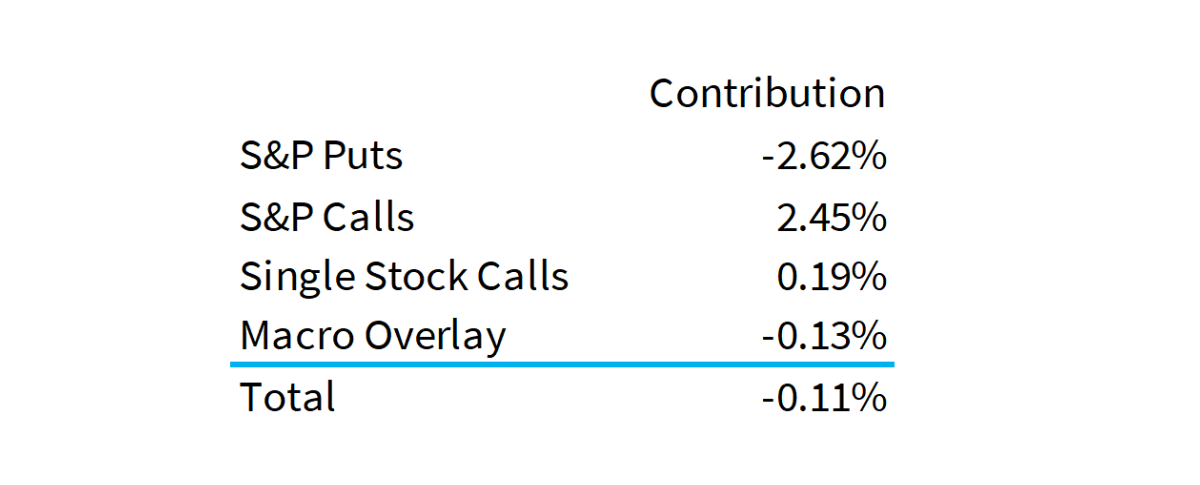
Getting there, however, has certainly been a challenge. Although we are approaching the tail end of the extended deterioration in Implied Volatility since the March 2020 highs, this ongoing fall has posed meaningful headwind for our core trading models during this time. In March, with a fall of 8.5 points on the VIX, our generally high loading on S&P Calls were unable to overcome the IV deterioration across our portfolio, and particularly on the S&P Puts side. Further, despite the decent gain in the index overall, our single stock Calls disappointed due to exposure to momentum (MSCI Momentum ETF -1.2% MTD). Typical strength became atypical weakness.
To make matters worse, even the safest of hiding places – the literal “Safe Havens” of Gold and Treasuries – which are also core pieces of our defensive driven portfolio, each experienced one of their worst quarters ever. While the broader market went on its way to claim new highs, these other major markets got walloped. For gold, in nearly 50 years, there have only been 9 other quarters with a loss surpassing 10%. Bonds, too, suffered one of their absolute worst quarters in 50 years, led strongly (in loss) by US Treasuries. Below, we show 50 years of quarterly returns for each asset:
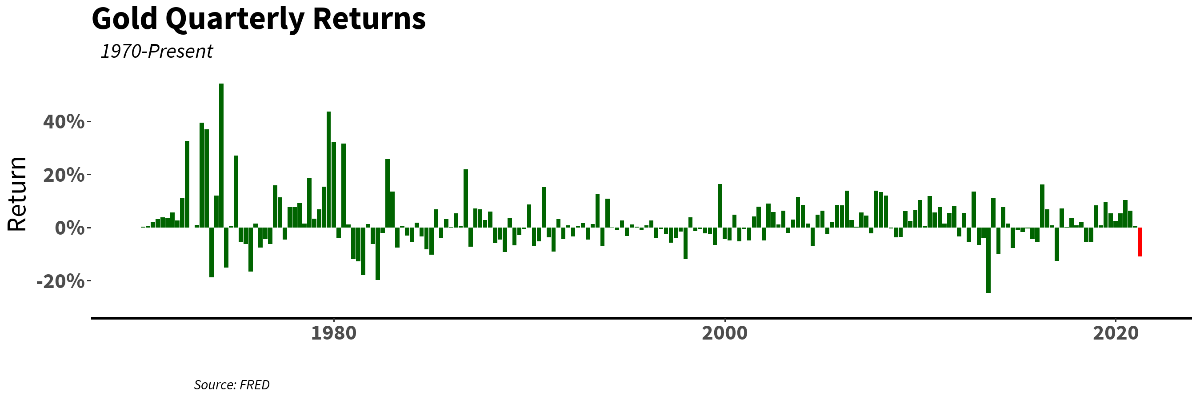
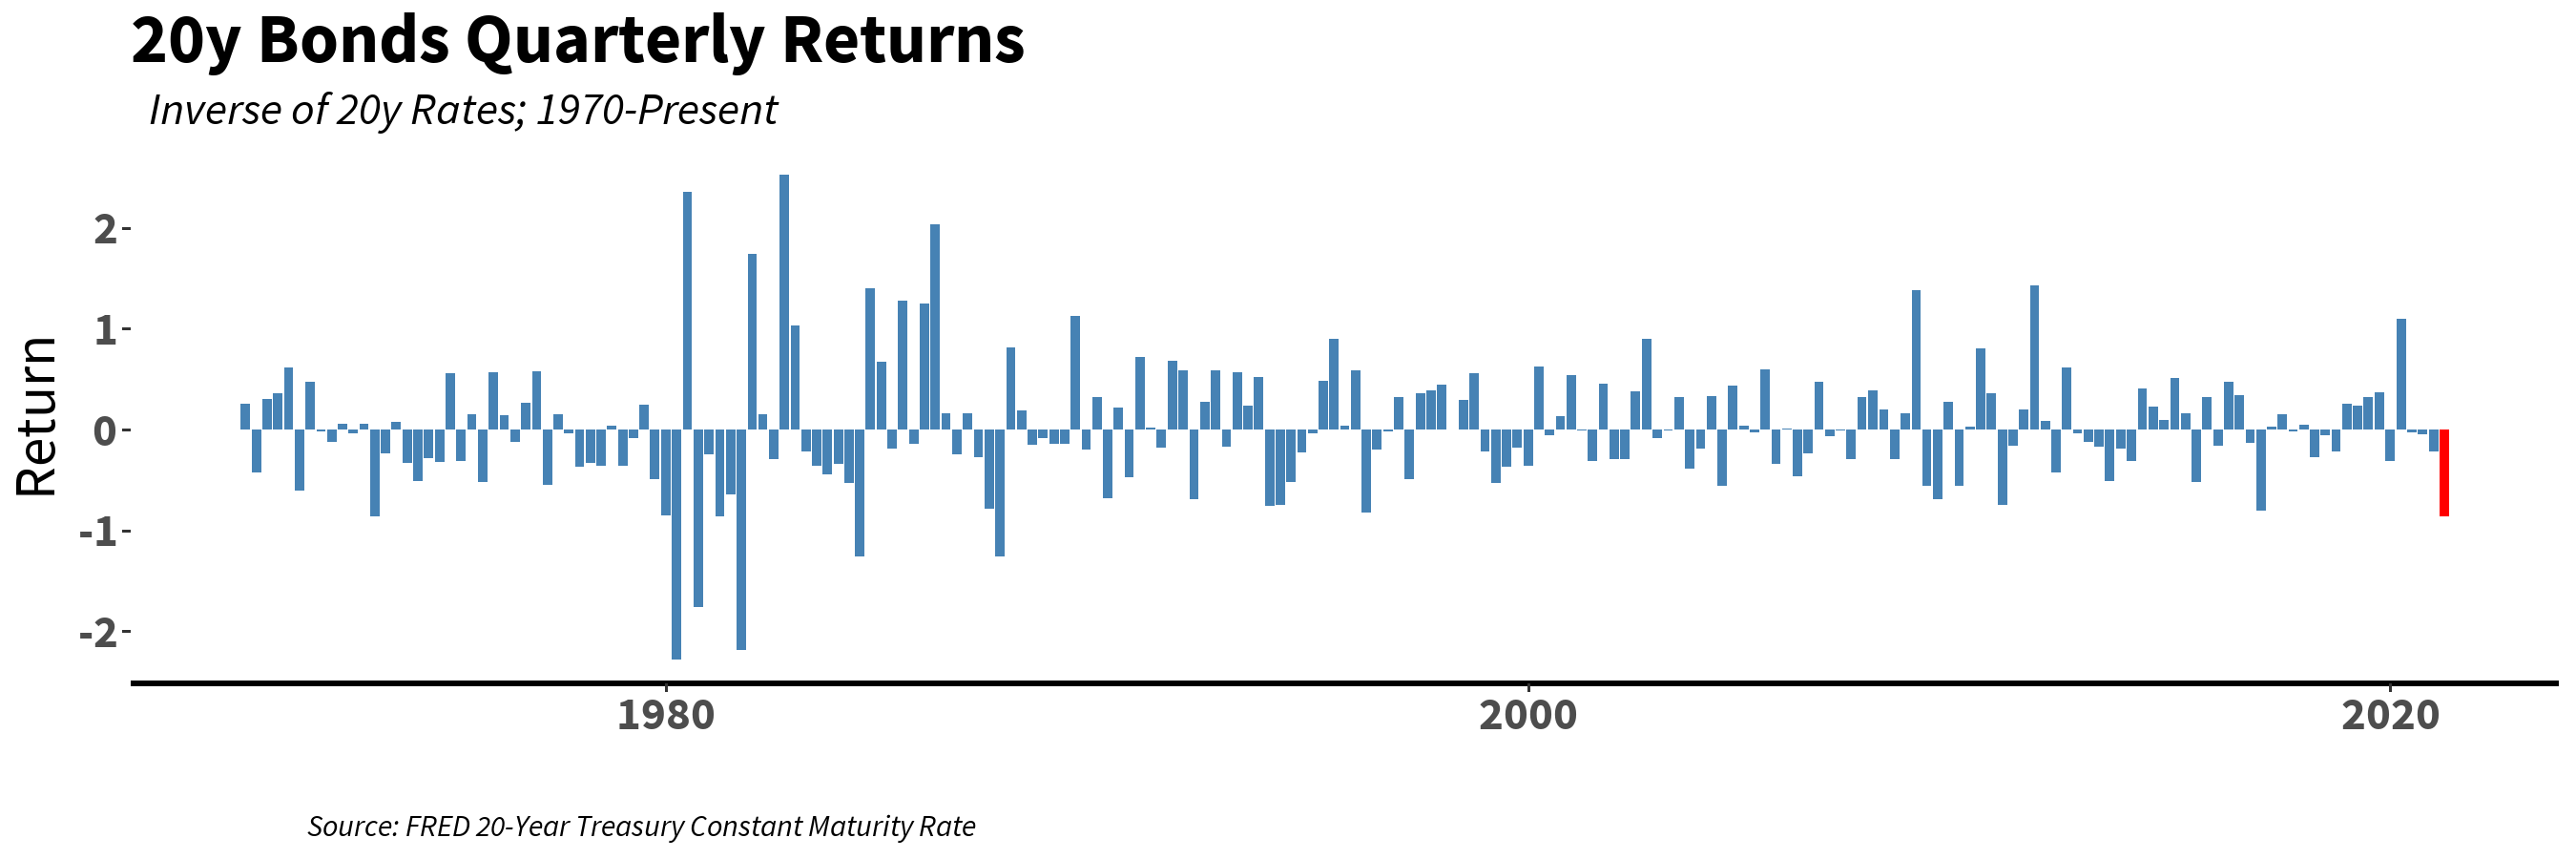
So what is one to think when “flight to quality” becomes “flight from quality”? Fortunately, not all that much historically. While it’s easy to see that many of these extremes led to meaningful gains in the months ahead, the simpler point is how sparse of a sample size we are dealing with. With so few data points, there is no meaningful information to be determined for forecast purposes, only the simple conclusion that what just happened is highly unusual.
That said, there was some good news around our S&P gamma scalping module being highly successful on the month, providing us with the much-needed alpha in the face of the declining volatility headwind. To give readers some sense of this uphill battle (the cost of long volatility), and for some color as to “where is the alpha going” (our ability to beat that cost), we thought it helpful to provide a visual around our material outperformance of the naïve buy-and-hold straddle:
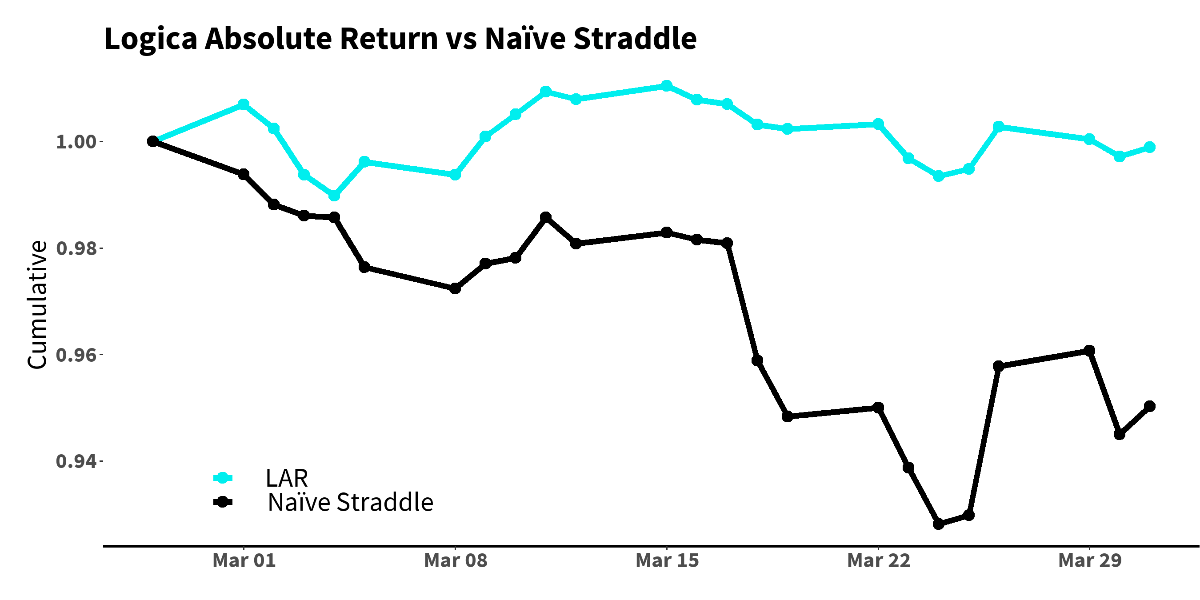
So, while it’s disappointing to see that all the alpha we generate goes toward beating the simple no skill version of what we do, it’s refreshing to know that we maintain the straddle position, such that at every moment in time, nights and weekends included, we hold a considerable inventory of At-The-Money Puts on the S&P 500, in constant readiness for whenever the tide may turn.
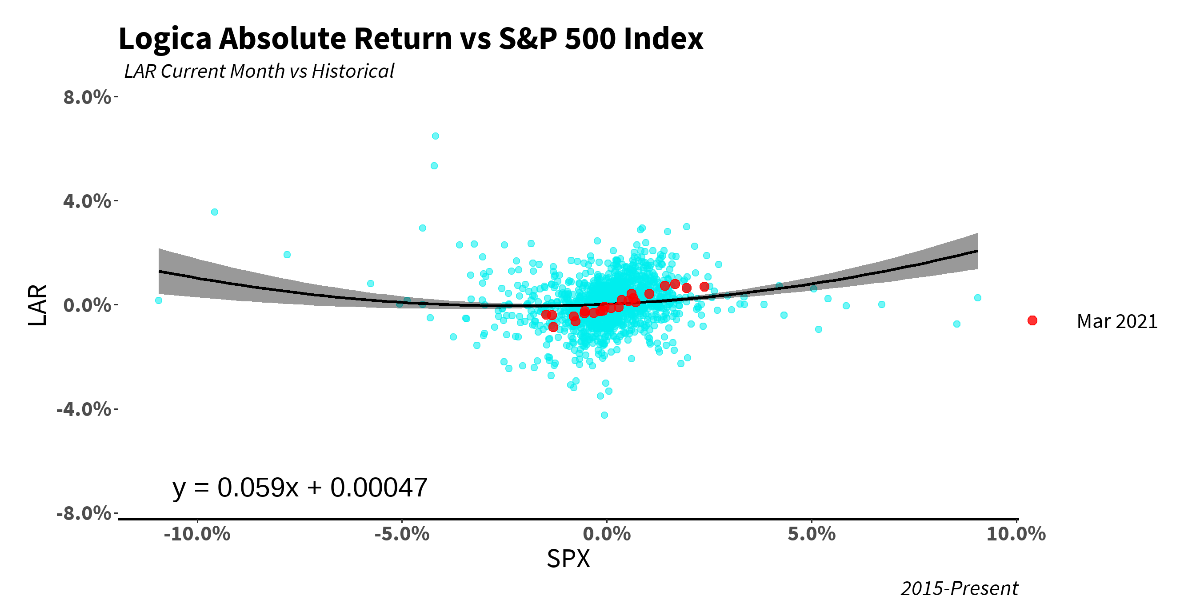
At the same time, it’s nice to provide some wider historical perspective, where we find ourselves well within expectation. Below we show a scatterplot of LAR vs the S&P 500 index from 2015-present, highlighting March 2021 (in red). As we show, the daily returns are firmly within our historical output. Although with volatility levels having materially retreated, we are certainly more excited than prior, looking forward to an increasingly favorable opportunity set in the months ahead that help to put more of those dots in better places.
“Insanity is relative. It depends on who has who locked in what cage.” – Ray Bradbury
March kicked off under threat of correction, but within 7 days of the local low, the S&P 500 roared back to an all-time high. Despite this relentless upside and what might appear to be an unflappable bull market, participants and their demand for optionality tell a slightly more tenuous story. The month ended with a bang and what might be considered a very unusual (hypothetical) headline: “Chatter of a multi-billion-dollar firm blowup and significant Prime Brokerage losses…as markets charge to all-time highs.”
So, what gives?
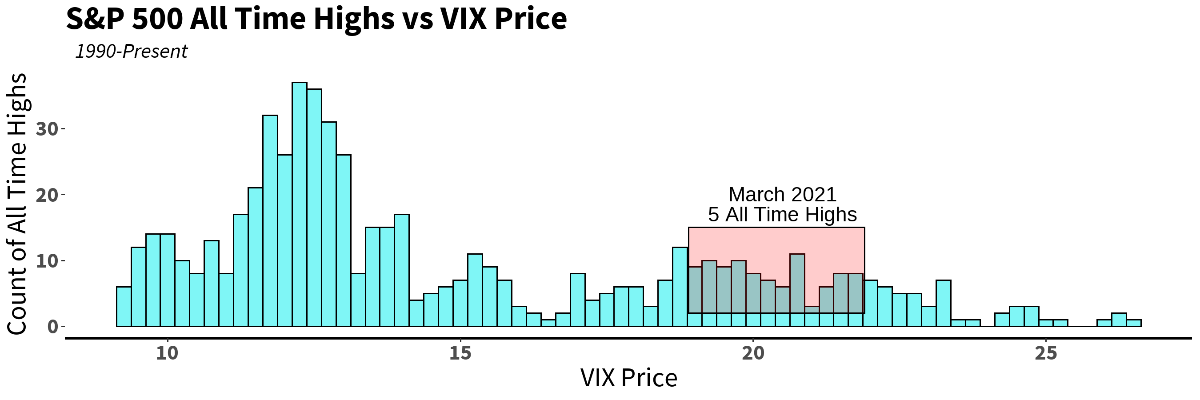
Even though the movement and price of the VIX is typically negatively correlated with that of the S&P 500, it’s not inconceivable that the VIX remains elevated even while the broader market continually rises, and more so, makes consistent new highs. But this is abnormal. Most of the time, market all-time highs are accompanied by dampened realized and implied volatility, and thus cheap IV/VIX levels. However, as we know, nothing about the past twelve months can qualify as “most of the time.” In fact, we saw the S&P 500 close at all-time highs no less than 5 times during March, with the corresponding VIX close between 18.9-21.9. Historically, the median VIX price for an S&P 500 all-time high is 13.1. In March, it was over 20.
Convexity hasn’t been cheap.
To this end – despite apparent calm on the surface, Q1 has been chock full of events and trends that have been anything but– events which are characteristic of – and cause – elevated volatility regimes. Whether it’s meme stocks or hedge fund blowups, these events tend to cluster together as a result of intertwined liquidity boundaries (something our good friend Corey Hoffstein dubbed “liquidity cascades[1]”), and, unfortunately, are linked only with the eventual benefit of hindsight. To this end, while major indices were positive for the month, we note a few laggards in what are typically (or had become) glamorous endeavors:
- iShares MSCI Momentum ETF -1.3% MTD
- Ark Innovation ETF -8.0% MTD
- Discovery Inc -18.0%
- GameStop Corp +86.6% MTD
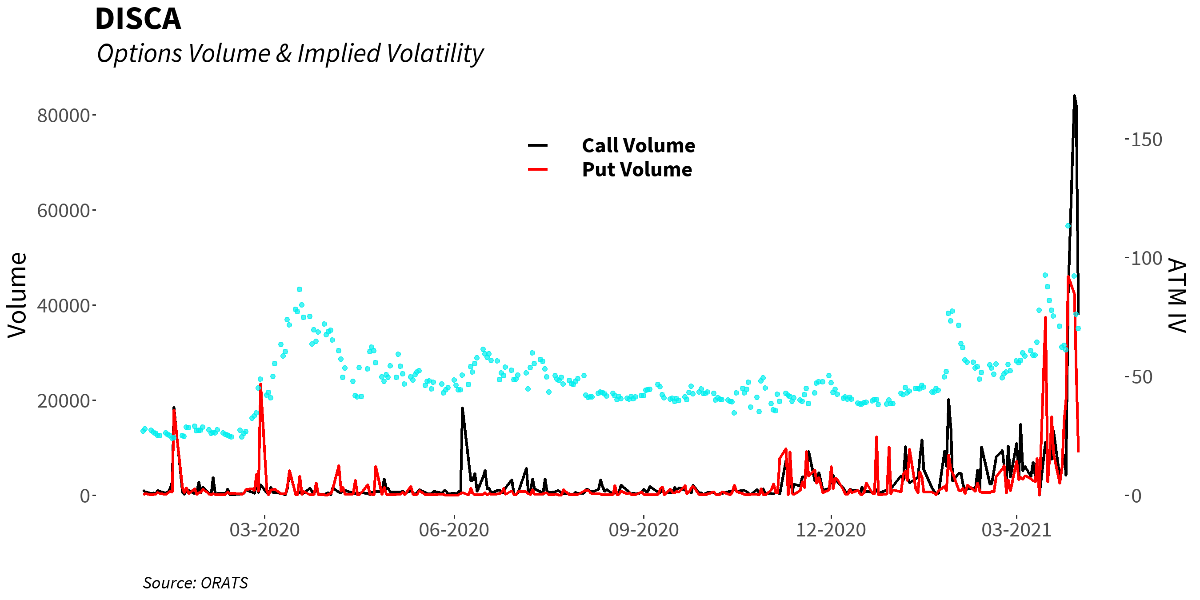
We are of course being tongue in cheek with respect to GameStop (GME), but it speaks volumes to the point. This kind of activity is extremely unusual and so is not disconnected from the elevated implied volatility levels we witnessed in Q1. Of similar note is the monstrous level of option trading activity in the “event” name Discovery, Inc (DISCA), a byproduct of the Archegos unwind:
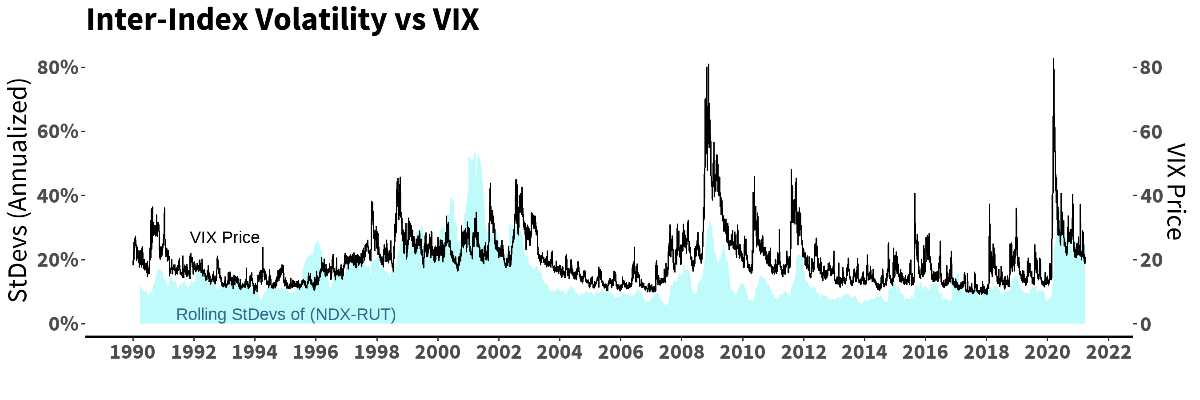
In furtherance of this idea around unrelated, and yet deeply related, volatility dynamics, we have also been particularly focused on factor volatility, and the market’s increasing tendency for greater magnitude moves between its various exposures. Volatility between indices with material factor differences has been more elevated since early 2020 than in the prior decades (this simple metric of Nasdaq 100 vs Russell 2000 differences is nearly lock-step with VIX over its history, and even more precisely connected as of 2020). We share the illustration as a simple and accessible way to compare “different” market and factor exposures as the 2 indices differ materially in terms of size, quality, and value/momentum characteristics. It’s worth noting that this output is fairly consistent with our internal, proprietary metrics on factor volatility. But this is a nice back of the envelope view.
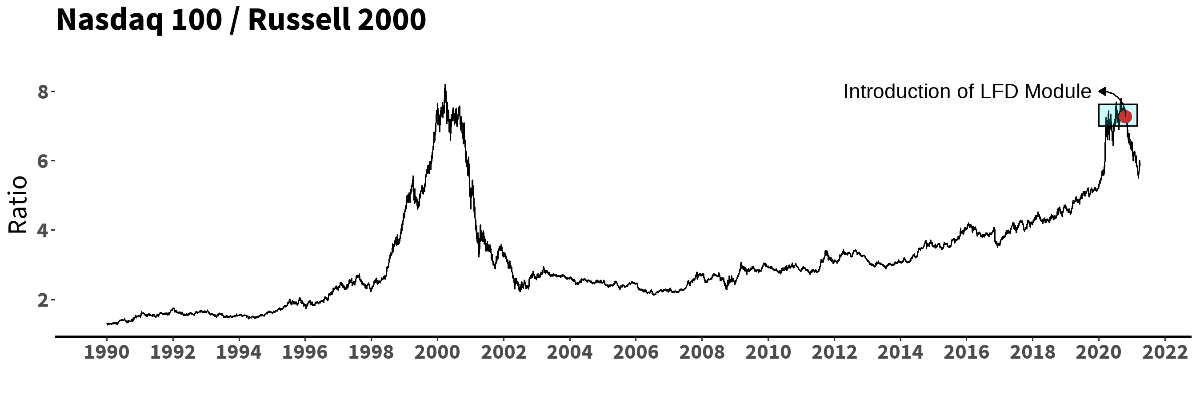
In fact, the spread between the Nasdaq 100 and Russell 2000 price reached extreme levels in mid-to-late 2020. One of the best ways to combat this, of course, is good old diversification. But while simple “diversification” is going back to the basics – Investing 101 – the way in which one does this, and the associated timing, scaling, rotation, etc.. makes all the difference. As chronicled in prior communications, ahead of the 2020 election, and as a result of aggressive R&D efforts, we exchanged some of our momentum-tilted exposures for positions in single stock/sector Call options that would provide some cushion (and alpha) alongside this “factor” volatility (a module we call “LFD” for “Logica Focus Diversifier”). As with all trading modules we implement, we love the value these names provide(d) in terms of convexity for their implied volatility risk/reward, but additionally so, for their offsetting behavior with respect to the rest of the portfolio, particularly in light of readily apparent factor volatility. Our timing appears to have been pristine (wish it were always this way!). The module has contributed +154 basis points of “performance above replacement” – to borrow a term from baseball’s sabermetric “wins above replacement” – since inclusion on 10/21/2020 and has positively contributed to our day-to-day return profile at lower variance.
Looking at what has happened is all well and good, but what’s that mean for the future? While we remain at somewhat elevated levels in index/constituent volatility, factor variance, and many other things on our radar, with each passing day we appear to be nearing an even more attractive value proposition for long volatility trading. The following chart compares single name S&P 500 constituent implied volatility levels from 3 dates: pre-pandemic, ~one month after the S&P 500 pandemic low (the S&P 500 had gained back approximately half of its drawdown by 5/1/2020), and today. For all intents and purposes, we’re there!
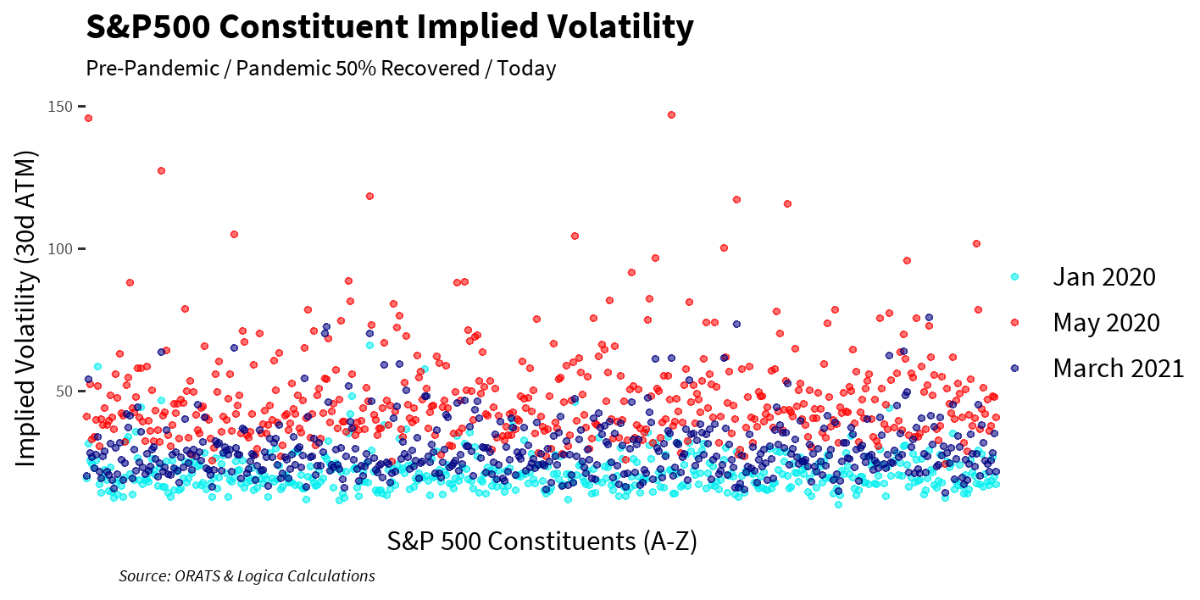
Of note, we see a handful of names above (events, really) who buck this trend, and whose IV remains significantly elevated (in purple) compared to pre-pandemic levels. These almost exclusively fall into 2 camps: recent “event” names (DISCA, VIAC, PENN, TSLA) and “recovery” names (energy, cruise lines, and airlines). The remainder of the broader market appears to be in the realm of historical norms, though slightly elevated.
And with most names and indices having fully retraced back to “typical” IV levels, the opportunity set and greater risk/reward characteristics should steadily increase in the lower volatility regime coming into Q2.
Business Update
- Outside of everything markets, we are particularly excited to have concluded what has been more than a year and a half of R&D into a large project to better model deeper nuances of implied volatility. Our new framework is difficult to discuss at length given its proprietary nature, but high-level, allows us to simulate trades across decades of a dynamic multi-dimensional IV surface. This sounds complicated, and to some degree is, but in simple terms we can see more aspects of behavior around any particular trade, and with that expect to be able to generate additional alpha on the very same signals we already utilize.
- Mike Green has left Logica to pursue other opportunities. All of us at Logica are thankful for Mike’s contributions and wish him well with his next endeavor.
End Notes
- “Liquidity Cascades: The Coordinated Risk of Uncoordinated Market Participants”, September 11, 2020, https://blog.thinknewfound.com/2020/09/liquidity-cascades-the-coordinated-risk-of-uncoordinated-market-participants/
Logica Strategy Details
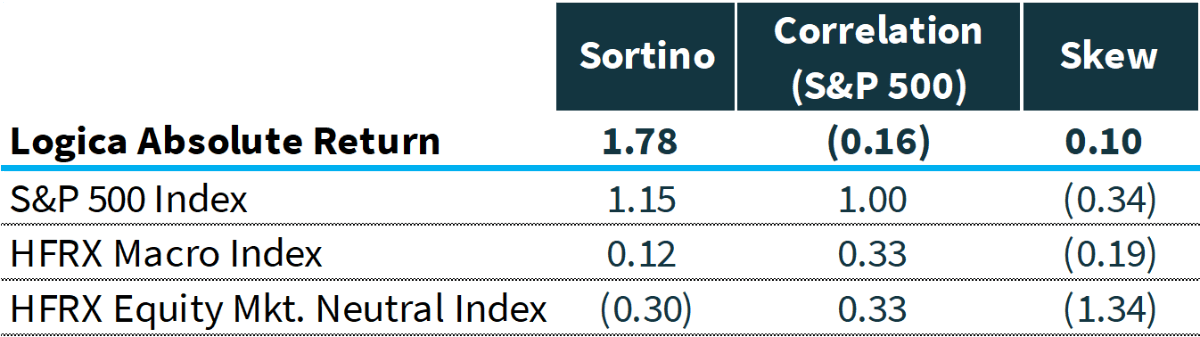
Note: We have comprehensive statistics and metrics available for our strategies, but only include a select few to highlight what we believe is our most valuable contribution to any larger portfolio.
- If you would like to learn more about our strategies, please reach out to Steven Greenblatt.
- If you would like to speak with Wayne/the team on our views on Hedge Funds/Investing/Trading and trends we see shaping the industry, please contact Steven Greenblatt at [email protected] or 424-652-9520.
Follow Wayne on Twitter @WayneHimelsein
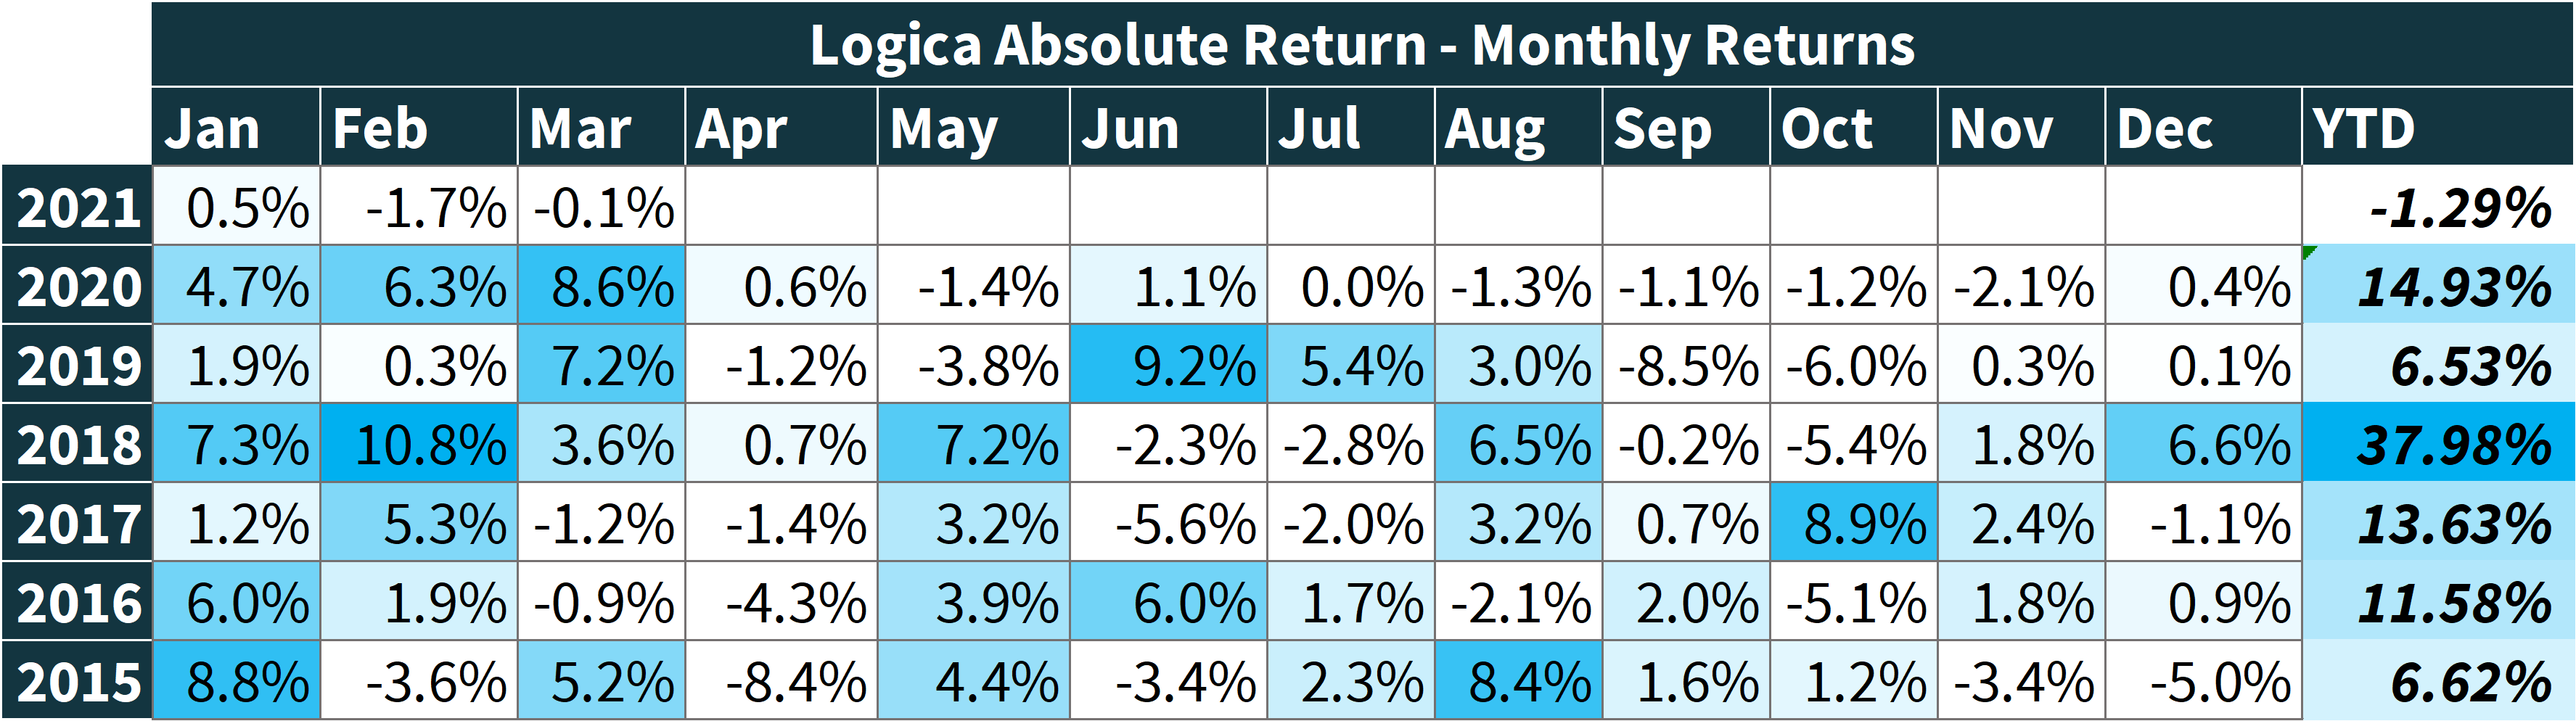
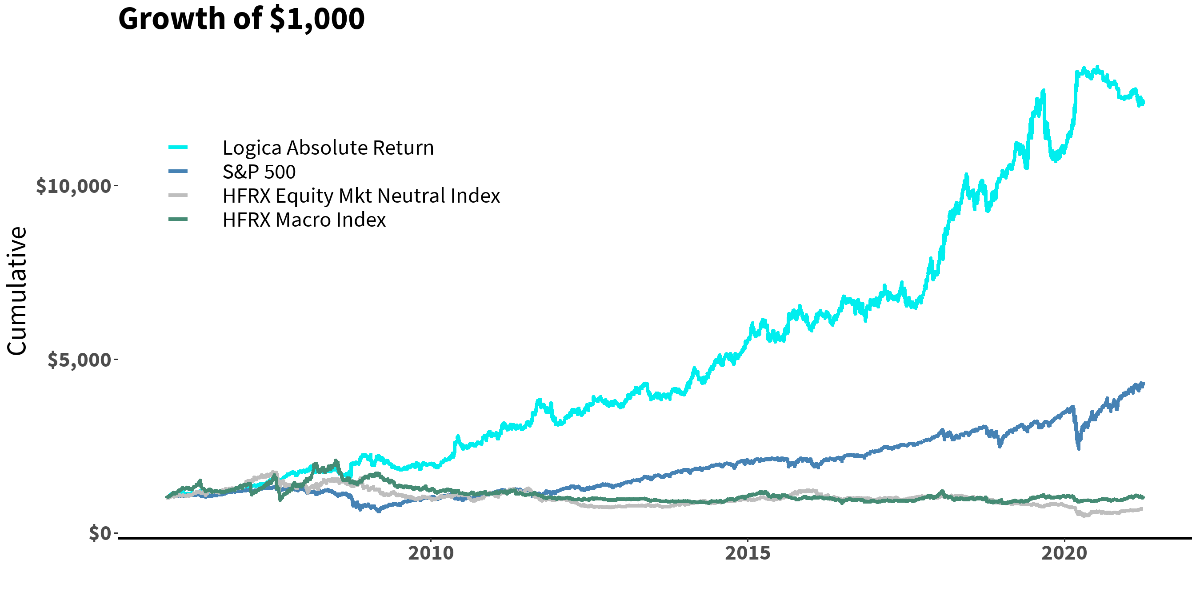
Logica Absolute Return
2015-2019 stats & grid, reconstitution of live sub-strategies normalized to 16% annualized volatility
2005 to present growth of $1000 chart, simulation
Jan 2020 live
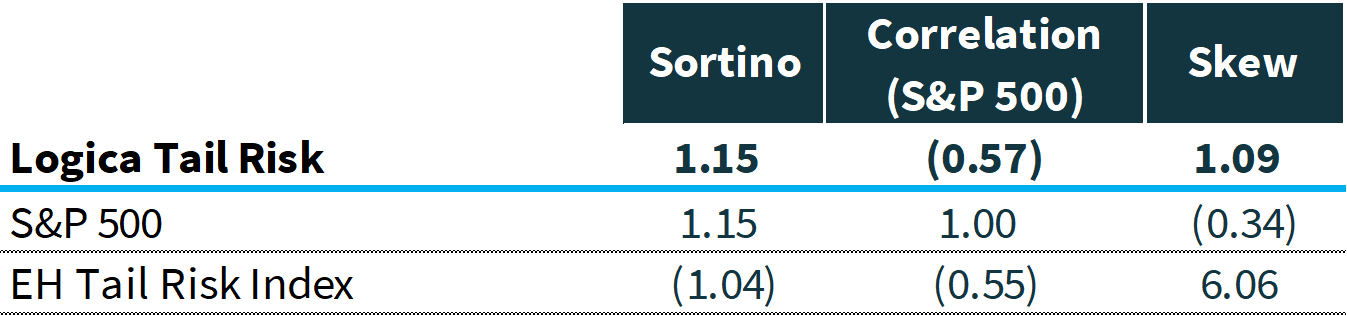
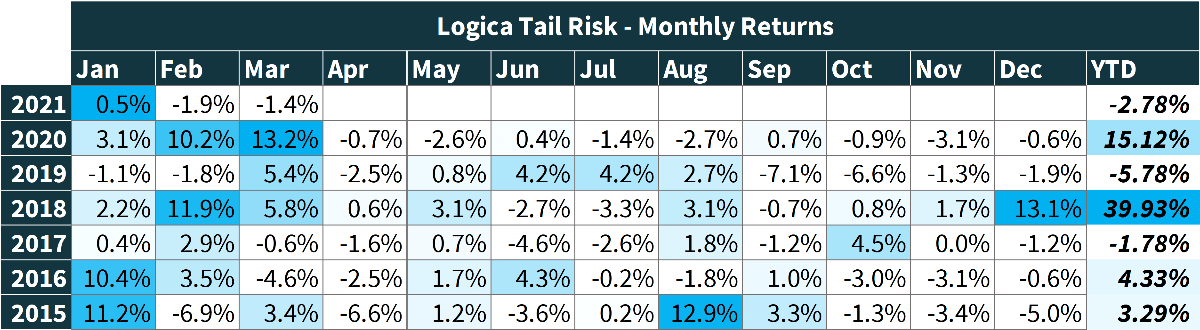
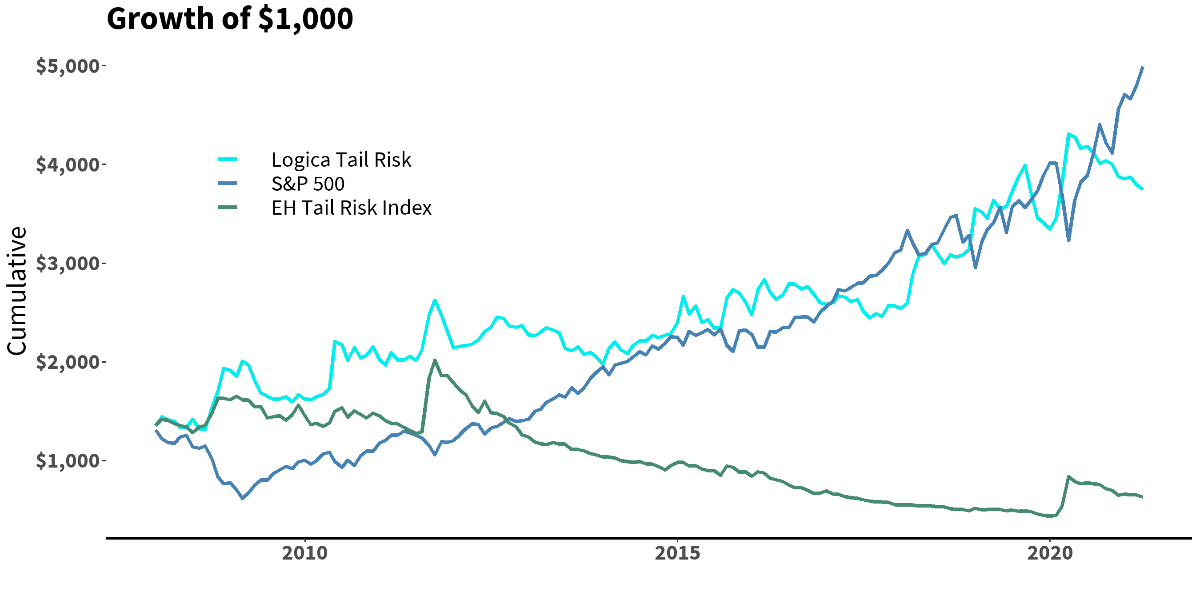
Logica Tail Risk
2015-2019 stats & grid, reconstitution of live sub-strategies normalized to 16% annualized volatility
2005 to present growth of $1000 chart, simulation
Jan 2020 live