DoubleLine Shiller Enhanced CAPE webcast slides for the month of October 2018.
TAB I – DoubleLine Shiller Enhanced CAPE® Strategies
DoubleLine Shiller Enhanced CAPE® Structure
- The distinct structure of the DoubleLine Shiller Enhanced CAPE® Strategy allows investors to simultaneously access returns of the equity markets and fixed income markets. By using an equity index swap, $1 invested in the strategy provides approximately $1 of exposure to each market.

Q3 hedge fund letters, conference, scoops etc
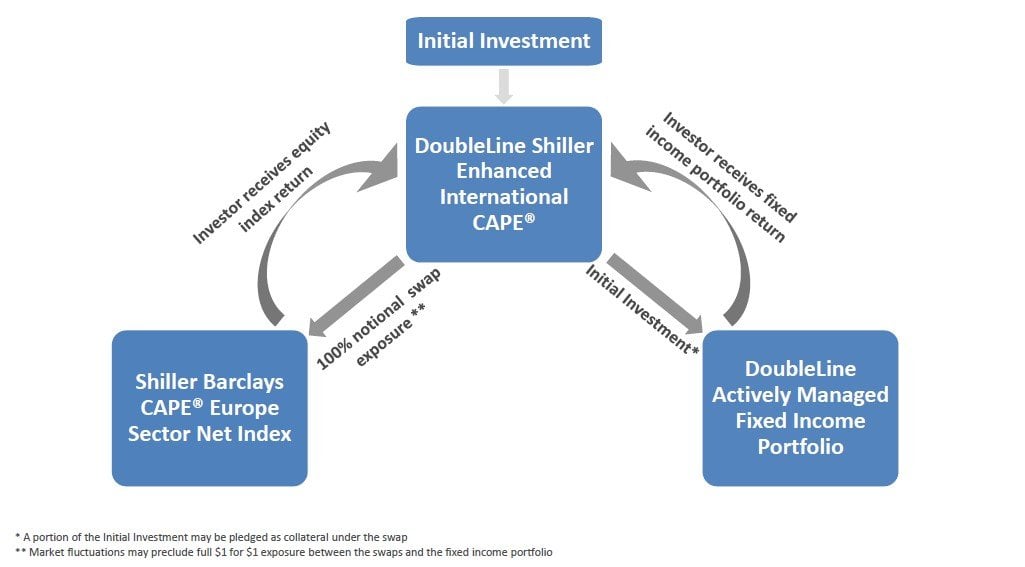
DoubleLine Shiller Enhanced International CAPE®
- The distinct structure of the DoubleLine Shiller Enhanced International CAPE® Strategy allows investors to simultaneously access returns of the equity markets and fixed income markets. By using an equity index swap, $1 invested in the strategy provides approximately $1 of exposure to each market.
TAB II - From 10 to 11: Redefining Telecommunications
New GICS Sector
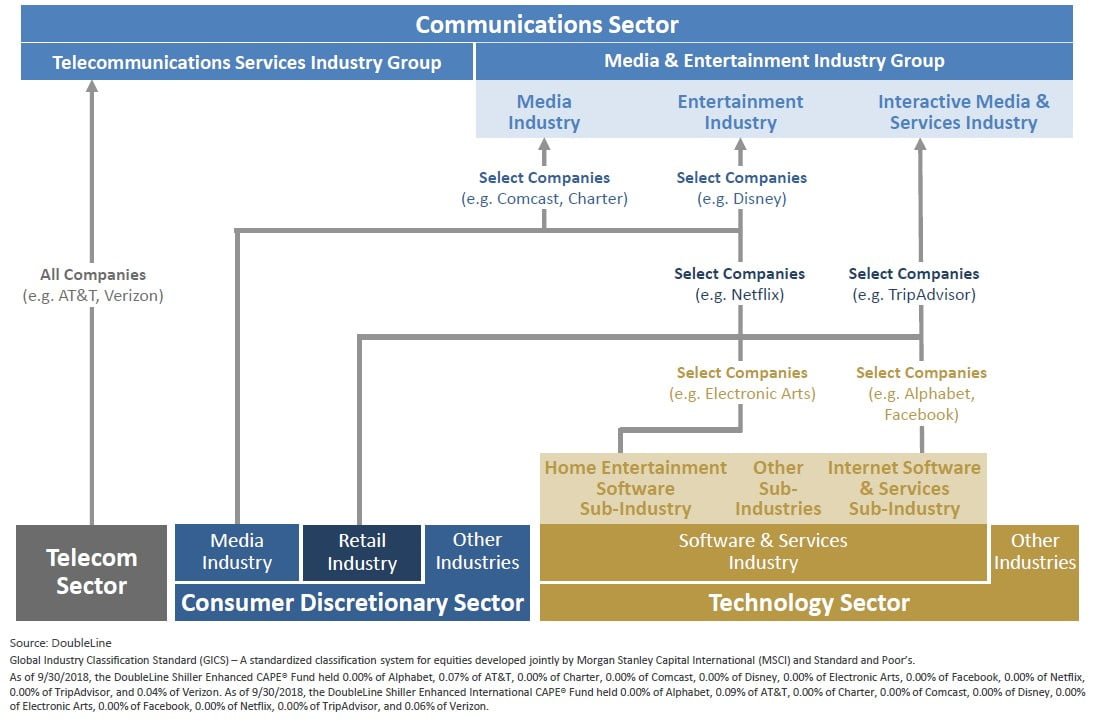
Evolution of Telecom to Communications Services
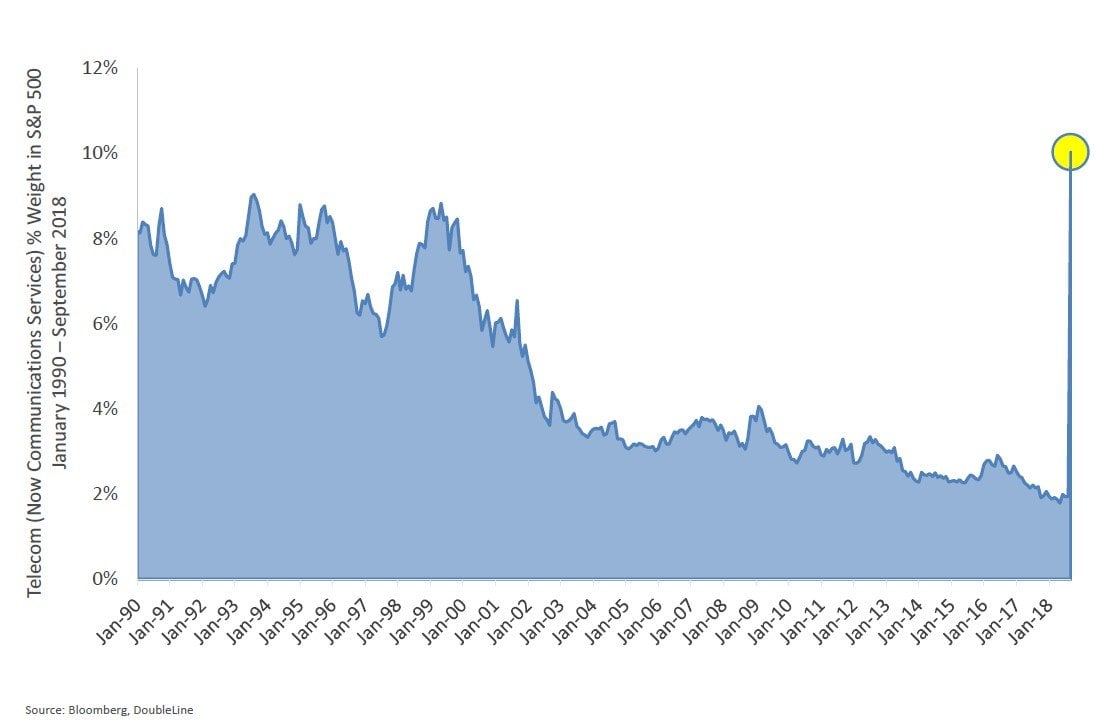
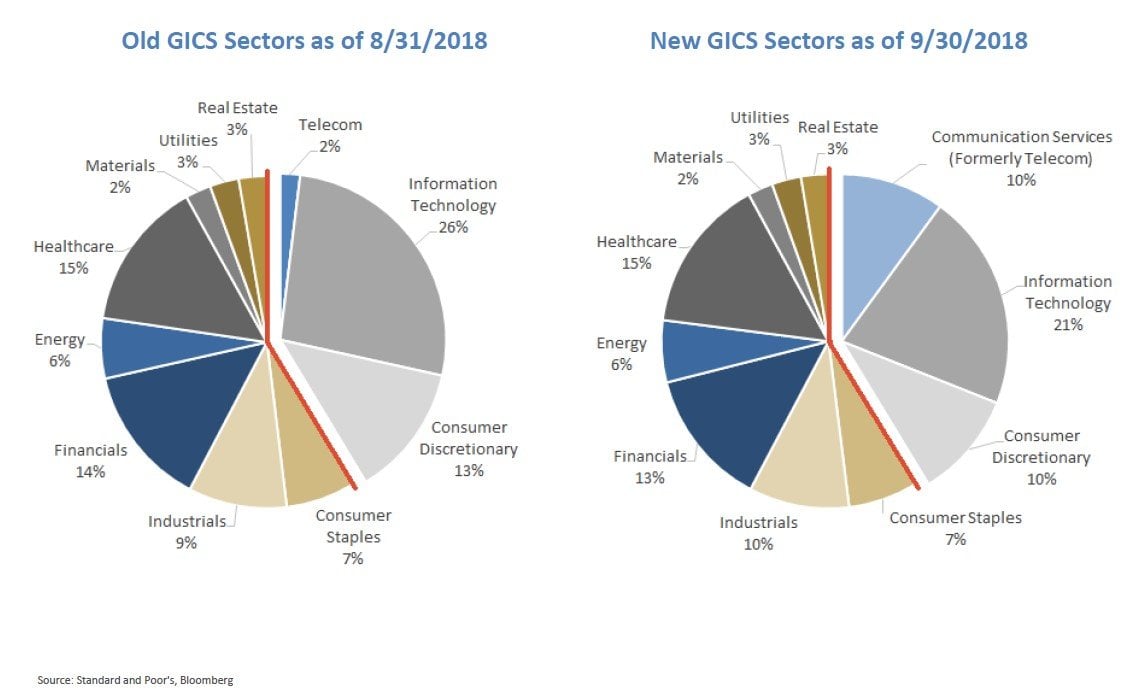
S&P 500 GICS Sector Weights
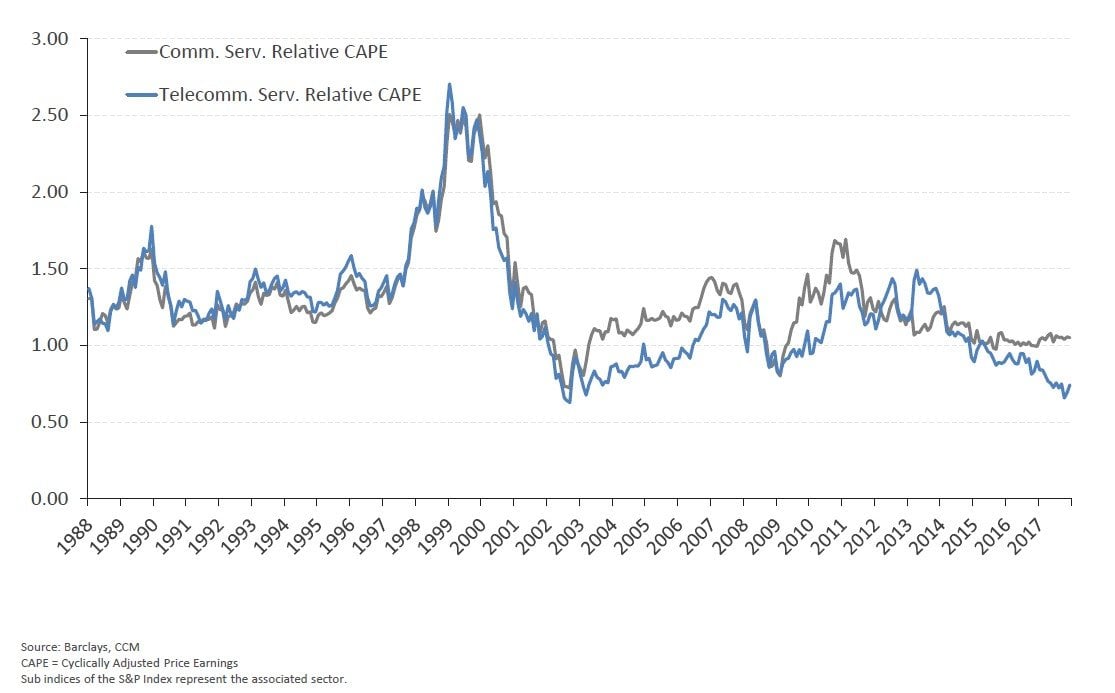
Relative CAPE® Old versus New: Communications Sector
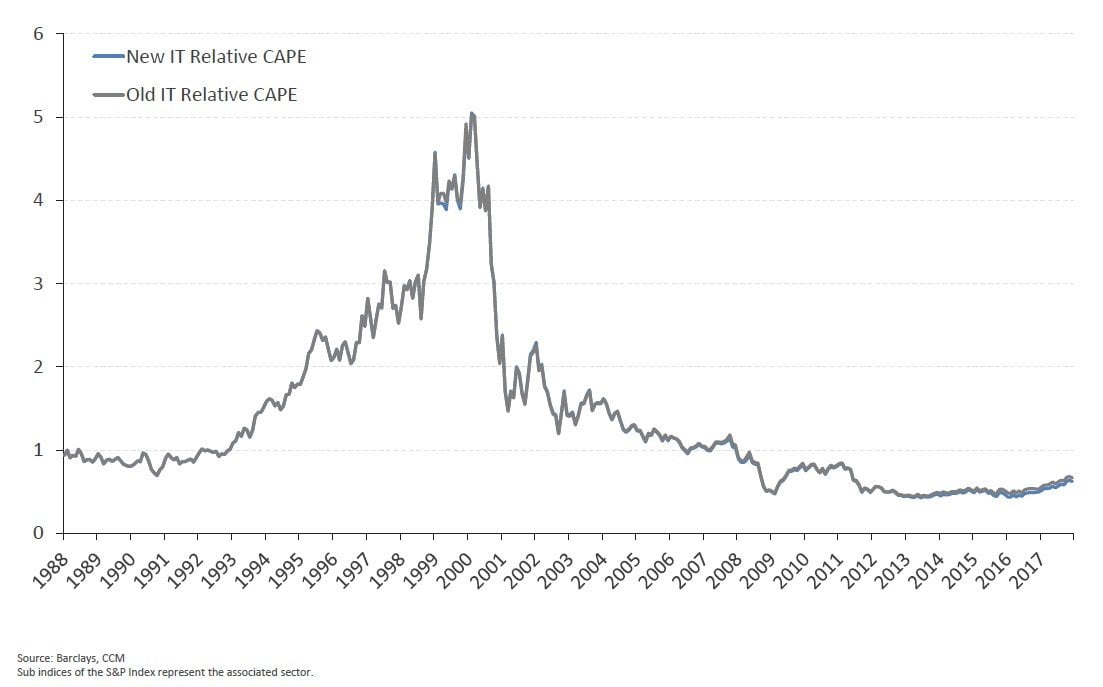
Relative CAPE® Old versus New: Information Technology
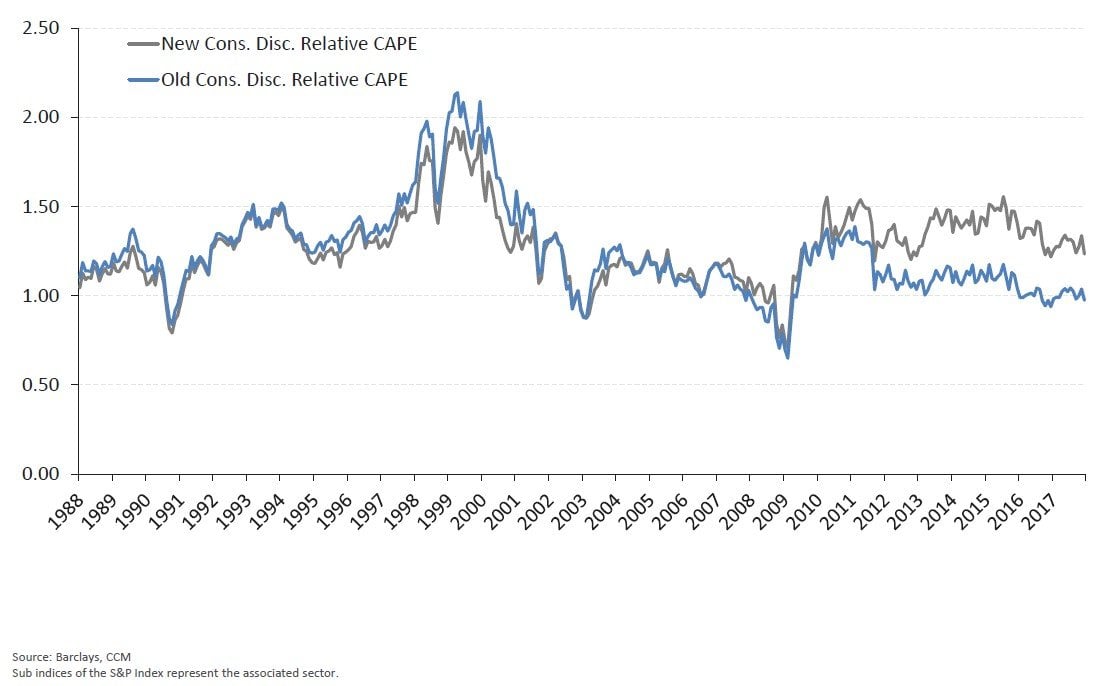
Relative CAPE® Old versus New: Consumer Discretionary
TAB III - Smart Beta: Shiller Barclays CAPE® U.S. Sector Index
Shiller Barclays CAPE® U.S. Sector Index

What is the CAPE® Ratio?
- Acclaimed value investors Benjamin Graham and David Dodd noted in Security Analysis that equity valuations tend to follow a business cycle of 3-7 years
- The CAPE® Ratio was formulated in the seminal 1988 piece1 from Professor Robert Shiller and John Campbell.
- CAPE® = Cyclically Adjusted P/E (Price-to-Earnings)
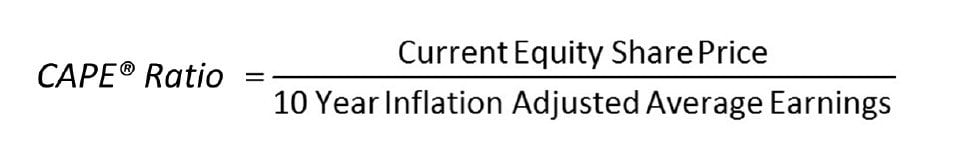
- The CAPE® ratio seeks to assess longer term equity valuation by using an inflation adjusted earnings horizon that is 10 times longer than the traditional P/E measure
- Similar to the traditional P/E the CAPE® can be applied to a portfolio of equities, a sector or a broad based index
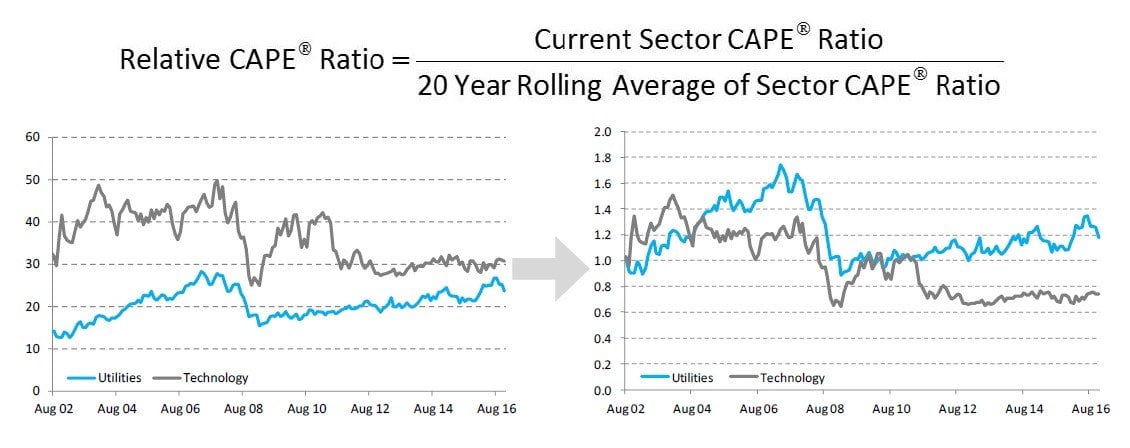
Relative CAPE® Indicator
- To account for idiosyncratic differences between sectors where CAPE® Ratios have historically been of different magnitudes one can construct a Relative CAPE® Ratio
- This may allow investors to compare sector valuations on a level playing field
See the full slides below.


