
For weekend reading, Louis Navellier offers the following commentary:
Q4 2021 hedge fund letters, conferences and more
A Head And Shoulders Top For Bitcoin
Two months ago, I saw a euphoric climax in bitcoin, which I didn’t like. The futures ETF had just launched, and they were running those commercials starring Matt Damon on CNBC for crypto.com invoking Fortuna, the Roman Goddess of luck. They are still running those ads, but the price has fallen by $30,000 from its peak.
This, as they say, is where the plot thickens.
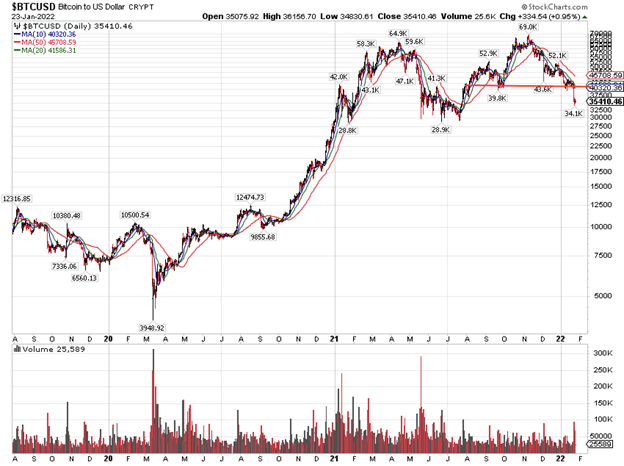
Bitcoin is showing a completed head and shoulders top with a neckline at $40,000 and a head at $69,000. Typically, a “head and shoulder top” declines the distance between the head and the neckline, which would be $11,000 in our case. The problem is that the latest head and shoulders top is actually the second peak of a monster double top, which gets completed on a decline below $28,000. If $28,000 gets violated as support, which I think it will, chances are we will see bitcoin trade under $10,000 in 2022.
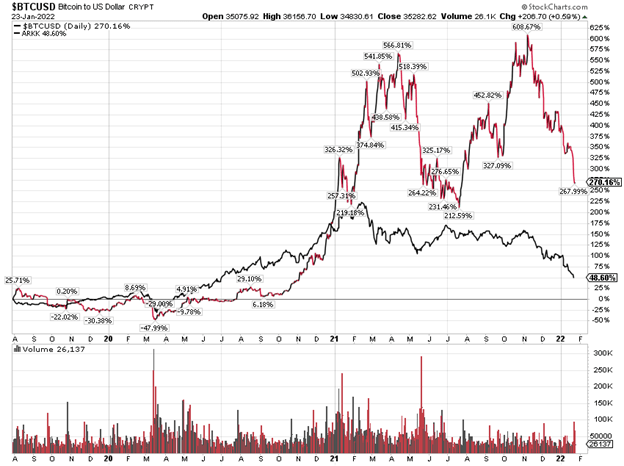
I have pointed out Bitcoin’s correlation with the ARK Innovation Fund (ARKK), which promotes fast-growing business with extreme valuation multiples. The problem is that ARKK can be cut by over half, as it has been, with businesses that are still fast-growing with a lot of potential, but they are still expensive.
I think ARKK is probably ripe to have a dead-cat bounce soon, as the biggest single-day advances typically happen in the context of a bear market, which both ARKK and bitcoin are clearly in. I believe it is premature to talk about a bear market when it comes to the broad stock market, as the economy is likely to improve in 2022 after the Omicron wave ends. I think the stock market is panicking due to Fed uncertainty and it is entirely possible that the Fed won’t be as aggressive as the stock market fears if inflation subsides in the latter part of 2022 because of fewer effects after the loosening of bottlenecks.
The S&P 500 is Now the Most “Oversold” Since the March 2020 Bottom
The Relative Strength Index (RSI), a popular oversold/overbought oscillator, spends most of its time between 30 (oversold) and 70 (overbought). It closed on Friday at 26.91. It has not seen a lower reading since late March 2020.
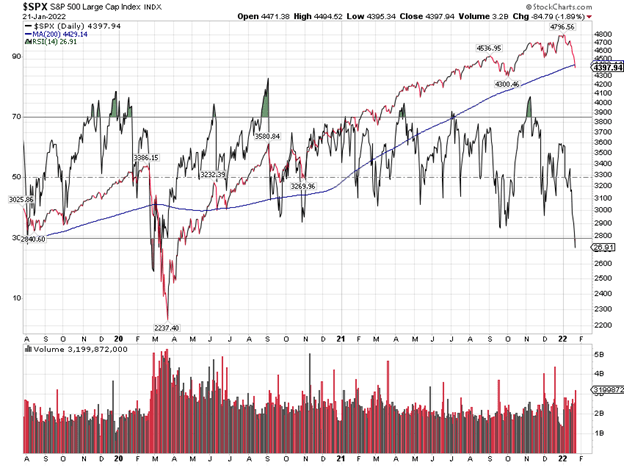
Furthermore, we just closed below the popular 200-day moving average for the first time since June 2020. Based on history and experience, I can tell you that the first kiss of a rising 200-day moving average after long periods spent above it, this is likely a buying opportunity. That does not mean that the low produced on this decline is the ultimate low for 2022, but it does mean that a significant rebound is likely.
I am looking for an intermediate-term rally, and I believe that the only person that can override this rather positive setup is Jerome Powell – as happened in 2018, when the first marginal close below the 200-day moving average came in late March. After that, we had a choppy month or two but a significant rebound and a new high into September. In the fourth quarter, Jerome Powell tightened monetary policy too much and the S&P 500 fell well below its 200-day moving average, after a whole year of rate hikes and balance-sheet shrinkage. Still, the first kiss of the 200-day moving average was a buying opportunity in 2018, and I think it will be a buying opportunity now. Below is what happened to the S&P 500 in 2018.
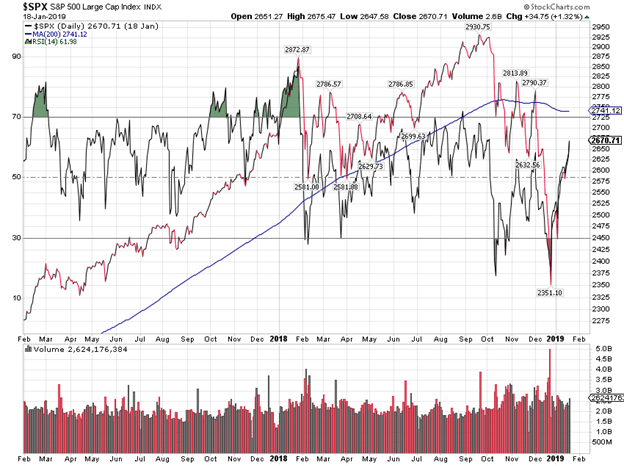
The most likely bottoming pattern we’re seeing is some kind of rebound off the 200-day moving average, a kiss of the 10-day moving average, and then some kind of a retest of the low.
I seriously doubt the stock market will keep going lower, as it has for the first three weeks of 2022.


