
How The Market Structure Weakened Progressively In Recent Reaching The Point Where It Now Looks As Bad As After A Flash Crash
Q2 hedge fund letters, conference, scoops etc
Abstract: part of our series supporting the case for a ‘Critical Transformation Hypothesis’ in global markets, this note further analyses the structure of the market, and how it weakened under the force of positive feedback loops between public flows and the private investment community. QE/NIRP created ‘Fake Markets’, within which passive and quasi-passive investors blossomed, under the cover of deceptive economic narratives. We look at asset managers and ETFs as a meaningful proxy for the broader financial system, as we think they represent the weakest links, the cracks in between tectonic plates in the market crust. We find that, over recent years, measures of market diversity and resilience fell in lockstep with measures of entropy, all the while as size rose to record levels. Entropy in the ETF market decayed at an average rate of 4.5% per year in the last ten years, and its trend-line has almost reached 2008 levels. Measured as ‘average closeness centrality’, concentration in the ETF market increased by a striking 12.1% year-on-year since 2008, and its trend-line too reached levels seen in 2008. Our analysis framework borrows from complexity theory and network modelling, we investigate phase transition from one state of the market to another by applying ideas from earthquakes prediction, information theory and pure mathematics. Looking at systemic risk as a complexity problem, we attempt a visualization of how the market structure on passive ETFs evolved over time, using agent-based modeling. This is the visual story of how the market structure weakened relentlessly in the last ten years, becoming more concentrated, entropic-fragile, and ready to snap. We analyze the structure of the market network during good and bad times, trying to identify the DNA of a market crash. The current market exhibits the typical structure visible during flash crashes, yet despite not being in one. We conclude that the market system is full, stationing on paper-thin ice, ready to transition.
TABLE OF CONTENTS:
- The Critical Transformation Hypothesis: Positive Feedback Loops Led Into Phase Transition Zone
- Measures Of How The Market Structure Weakened Over Time
- A Visual History Of The Market Structure In The Last Ten Years
- Sequencing The DNA Of A Market Crash
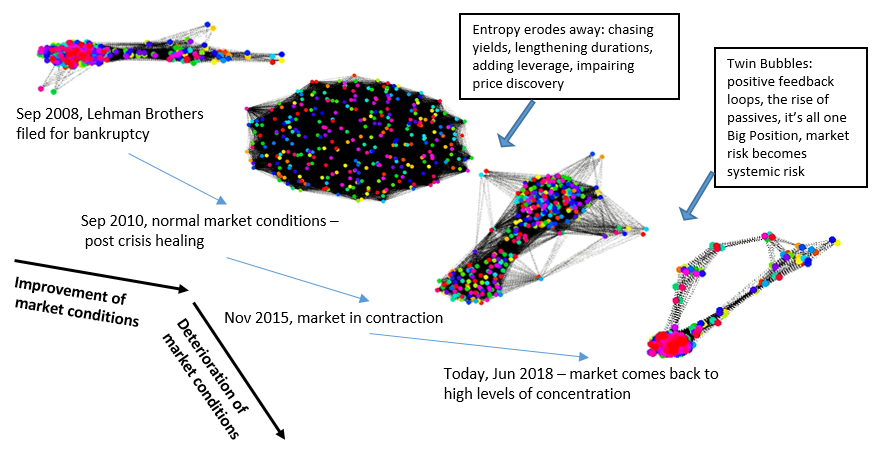
Figure 7 | Market Structure Over Time, With Agent-Based Modeling:
Healthy vs Unhealthy Market Structures Average Concentration Of The Network Of 350 Largest ETFs
Source: Fasanara Analytics, Bloomberg, Method IT
The analysis that follows is powered by our Fasanara Analytics team, a proud addition to the Fasanara family of late. It is not intended to be a finished product, but rather a work-in-progress, along the way of truth-seeking data mining. Any feedback/critique, please reach out, happy to collaborate and incorporate.
Alessandro Balata – Fasanara Analytics
Francesco Filia – CIO


