If your life’s savings were visualised as $100, how would the cash be distributed? How, over the course of your life, would your lifetime earnings be split between food, housing costs, taxes, personal insurance and transport? At some point in our lives we have asked ourselves the following question: ‘Where does all my money go?’ At Lottoland, this is the question we sought to answer.

Q1 hedge fund letters, conference, scoops etc
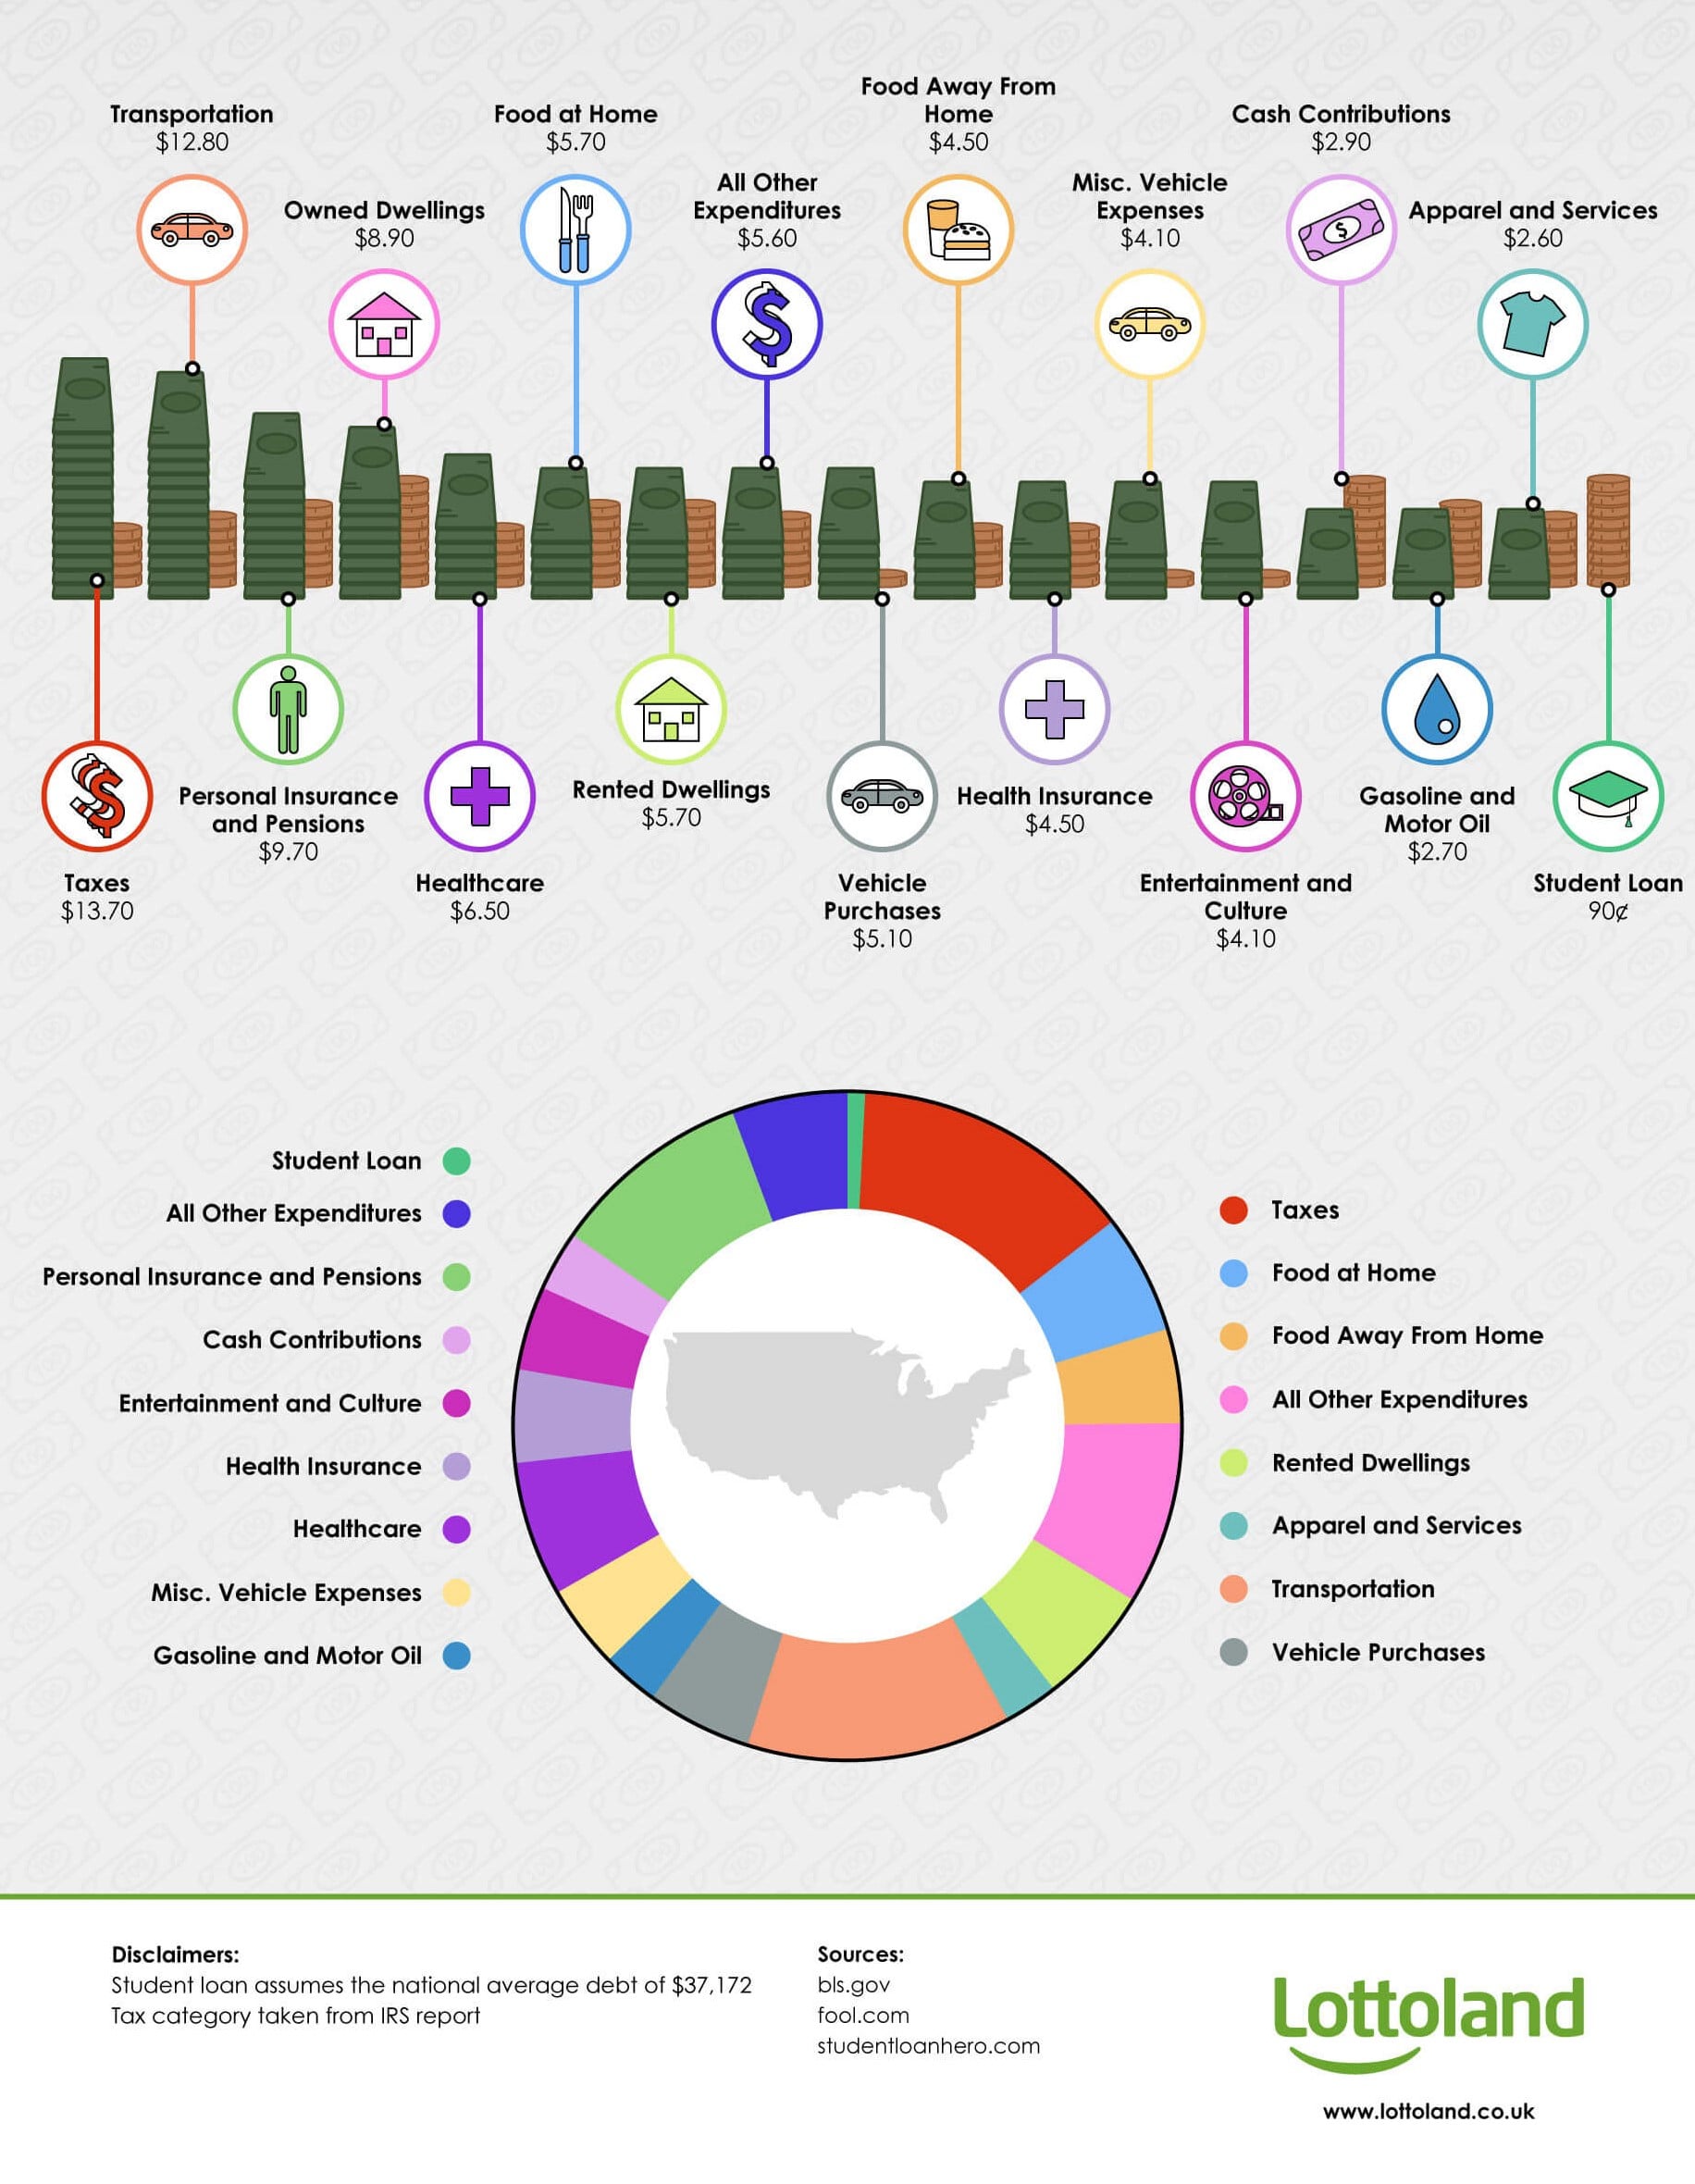
Millions upon millions of US citizens receive the cash they’ve worked hard for each pay day and spend it however they prefer. However, when we take a look at the big picture there are a few major categories that are constantly consuming most of your cash. Perhaps unsurprisingly, we found that taxes take up most of the expense, with over $13 out of the total $100 lifetime earnings being paid back to the government. You can’t help but feel doleful when you imagine the savings you could have garnered if these major consumers were dropped out of the picture.
Lottoland acquired data from the Bureau of Labor Statistics’ most recent consumer expenditure report in an attempt to estimate how the average US citizen’s earnings were dolled out between these major expenditure categories. To do this, several factors had to be taken into account:
Each expenditure category was firstly multiplied by 78.74 years, the national average life expectancy for people living in the US. We then calculated the size of each category relative to 100 in order to gain a better sense of each categories’ contribution to the overall picture.
As tax was excluded from the report, we ensured this and also student loan repayments were taken into account – each were calculated using national average tax payment amounts & student loan debts, verified by reputable sites. CNBC, for example, recently published an article utilising data taken from COMET Financial Intelligence, whom released a report indicating that the average student loan borrower owes $37,172 by the time they leave education. Using a typical 10-year repayment plan and a fixed interest rate of 6.8% (the norm for graduates/professionals), means that by the time the loan is fully paid off, each student borrower will have paid around $51,333.19.
Student loans are typically seen by recent graduates to be a major expense – interestingly, in the grand scheme of things a student loan’s repayment is fairly minimal when compared to some of the other main expenditure categories. In fact, it placed bottom of our list.
According to the IRS’s most recent preliminary data release concerning individual income tax returns, total income tax reached nearly $1.5 trillion in tax year 2015. When divided by the total number of taxpayers (150.6 trillion), the average amount of tax assessed per taxpayer was estimated at around $9,655 (as reported by The Motley Fool). Although our source data works off averages, they still provide a rough idea of how the average US citizen distributes their money.
When looking at the big picture, it appears that taxes top the list, closely followed by transportation, personal insurance & pensions and owned dwellings, amounting in total to a 37.9% drain on your overall life’s earnings. As mentioned, student loan repayments came at the bottom of the list, equivalent to just 90¢ of your overall ($100) earnings. Other smaller categories included apparel & services; gasoline & motor oil; and entertainment and culture, all of which account for only 9.4% of a US citizen’s overall life earnings.
For further details on each of the section, and for a pie chart that compares the relative sizes of these sections, see our infographic below. The study paints a fascinating insight into just how people in the United States spend their money.
|
Expenditure Category |
US dollar ($) |
||
|
Taxes |
13.7 |
||
|
Transportation |
12.8 |
||
|
Personal Insurance and Pensions |
9.7 |
||
|
Owned Dwellings |
8.9 |
||
|
Healthcare |
6.5 |
||
|
Food at Home |
5.7 |
||
|
Rented Dwellings |
5.7 |
||
|
All Other Expenditures |
5.6 |
||
|
Vehicle Purchases |
5.1 |
||
|
Food Away From Home |
4.5 |
||
|
Health Insurance |
4.5 |
||
|
Misc. Vehicle Expenses |
4.1 |
||
|
Entertainment and Culture |
4.1 |
||
|
Cash Contributions |
2.9 |
||
|
Gasoline and Motor Oil |
2.7 |
||
|
Apparel and Services |
2.6 |
||
|
Student Loan |
0.9 |
||
|
Total |
100 |
Article by Lottoland


