News analytics data are sentiment scores and metrics derived from the analysis of thousands of online news sources. They leverage powerful algorithms to understand the meaning conveyed by text media, and translate them into quantitative signals. Typically they are used by companies in the financial sector to help them forecast changes in asset prices.
Q3 2020 hedge fund letters, conferences and more
News analytics can be included in highly sophisticated trading models, but at the simplest level, a rise or fall in the news sentiment and volume of news about a company often precedes a corresponding change in its share price, and that lag provides investors with an opportunity to make a profit.
In the summer of 2020, we asked ourselves whether the same data adapted to the world of politics could also provide the basis for forecasting the winner of the U.S. presidential election. After all, polls had proven unexpectedly inaccurate during the previous electoral cycle of 2016 so there was a case for exploring other possible ways of projecting the likely winner.
We decided to build an election media monitor that would provide daily updated forecasts based on news analytics, at both a national and a state level. And we made it freely available to all as a web dashboard.
How Accurate Was Our Forecasting Model?
Now that the election is over, how did our experiment in applying news analytics to forecasting the election go, and how accurate was our model?
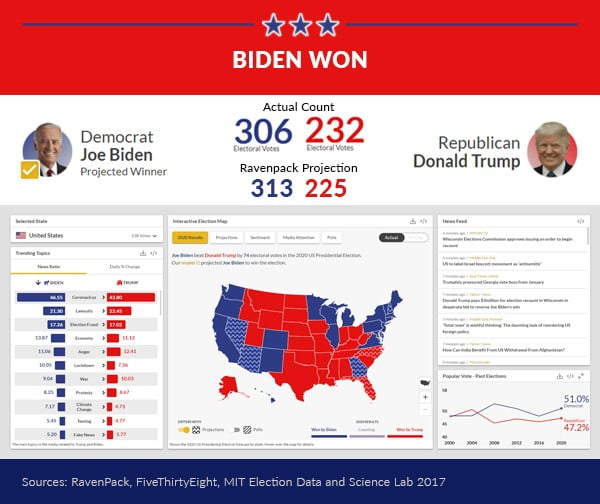
On the eve of the election, our model forecast Joe Biden to win by 313 electoral college votes (ECV) to Trump’s 225. In the end, Biden won by 306 ECVs to Trump’s 232. We were 7 ECVs off the eventual result.
Performance VS Other Models
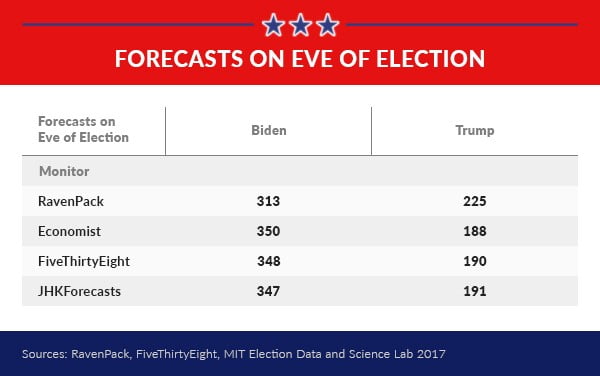
Compared to other leading monitors we also performed well, at least on an ECV basis. We came closer to the end result than either of the monitors built by The Economist, www.fivethirtyeight.com, or JHKForecasts.
Although our monitor came close to predicting the eventual winner at a national level it is also true that we reached the result via a different route to that which was achieved in the election.
In 6 states – New Hampshire, North Carolina, Georgia, Florida, Arizona, and Nevada – our projections differed from the final result.
Yet, this is not in many ways surprising. The news defies segregation at a state level. Local news is influenced by and influences the broader national debate with which it overlaps. Whilst this may have impacted the model’s accuracy at a local level, the ripples evened out overall and delivered an end result that was close to the actual result.
Combining With Poll Data
In the past, we have found that using our sentiment data in conjunction with official polls can be mutually enhancing.
Where the two agree they often reinforce each other and seem to increase prediction success; where they disagree it is a warning that the state prediction should be the subject of much closer scrutiny.
At a macro level, for example, both our model and opinion polls agreed that Biden would be victorious, and that was the end result.
Even at a state level, the same is also broadly true, though not 100%. Out of the 6 states where our projections differed from the election result, 4 were also states where the polls and our data disagreed, warning something was awry.
In all but 2 states, Florida and North Carolina, the agreement of official polls with our data had a reinforcing effect and correctly predicted the end result.
Combining With Other Monitors
Assessing how well our data performs in combination with other major monitors is another avenue of interest.
It would be expected that if one were to average out the projections from the 4 monitors compared above, the resulting average would provide a more accurate forecast.
Conducting the experiment at a state-level would have resulted in a mean forecast that would have deduced the correct result in eleven of the thirteen key marginals we have been following, as shown in the table below – a fairly good success rate.
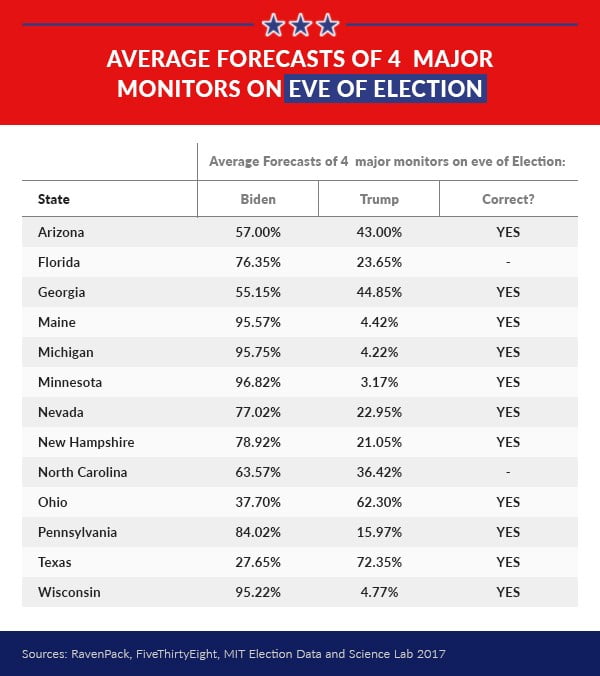
The only 2 states where it failed were Florida and North Carolina (again). Indeed, these 2 states appear to have fooled quite a few forecasters!
Overall, the results from our 2020 election news analytics experiment recommend the continued relevance of our data in a growing number of domains outside of finance, including tracking the Coronavirus pandemic via our Covid monitor and by researchers in the behavioral sciences.