Hotly debated among demographers today is the happiness of the younger generation. Some analysts point to lower income. Others point to the decline of marriage. Others point to the harmful effects of constant technology use, such as phone games or abuse of video game consoles. Still others point to the detrimental effects of social media overuse.
Another explanation was released this week – that a chunk of the younger generation must move to big cities in search of a job. Instead of owning a home in a nice, suburban neighborhood, they move to Los Angeles, New York, Chicago, and the other big metropolitan areas. Some like it. Others have no choice.
The Data
Where’s the evidence? This week the Bureau of Economic Analysis (BEA) released their GDP by MSA statistics (Gross Domestic Product by Metropolitan Statistical Area). It shows an enormous dominance of big cities, and a dominance that continues to expand.

Q2 hedge fund letters, conference, scoops etc
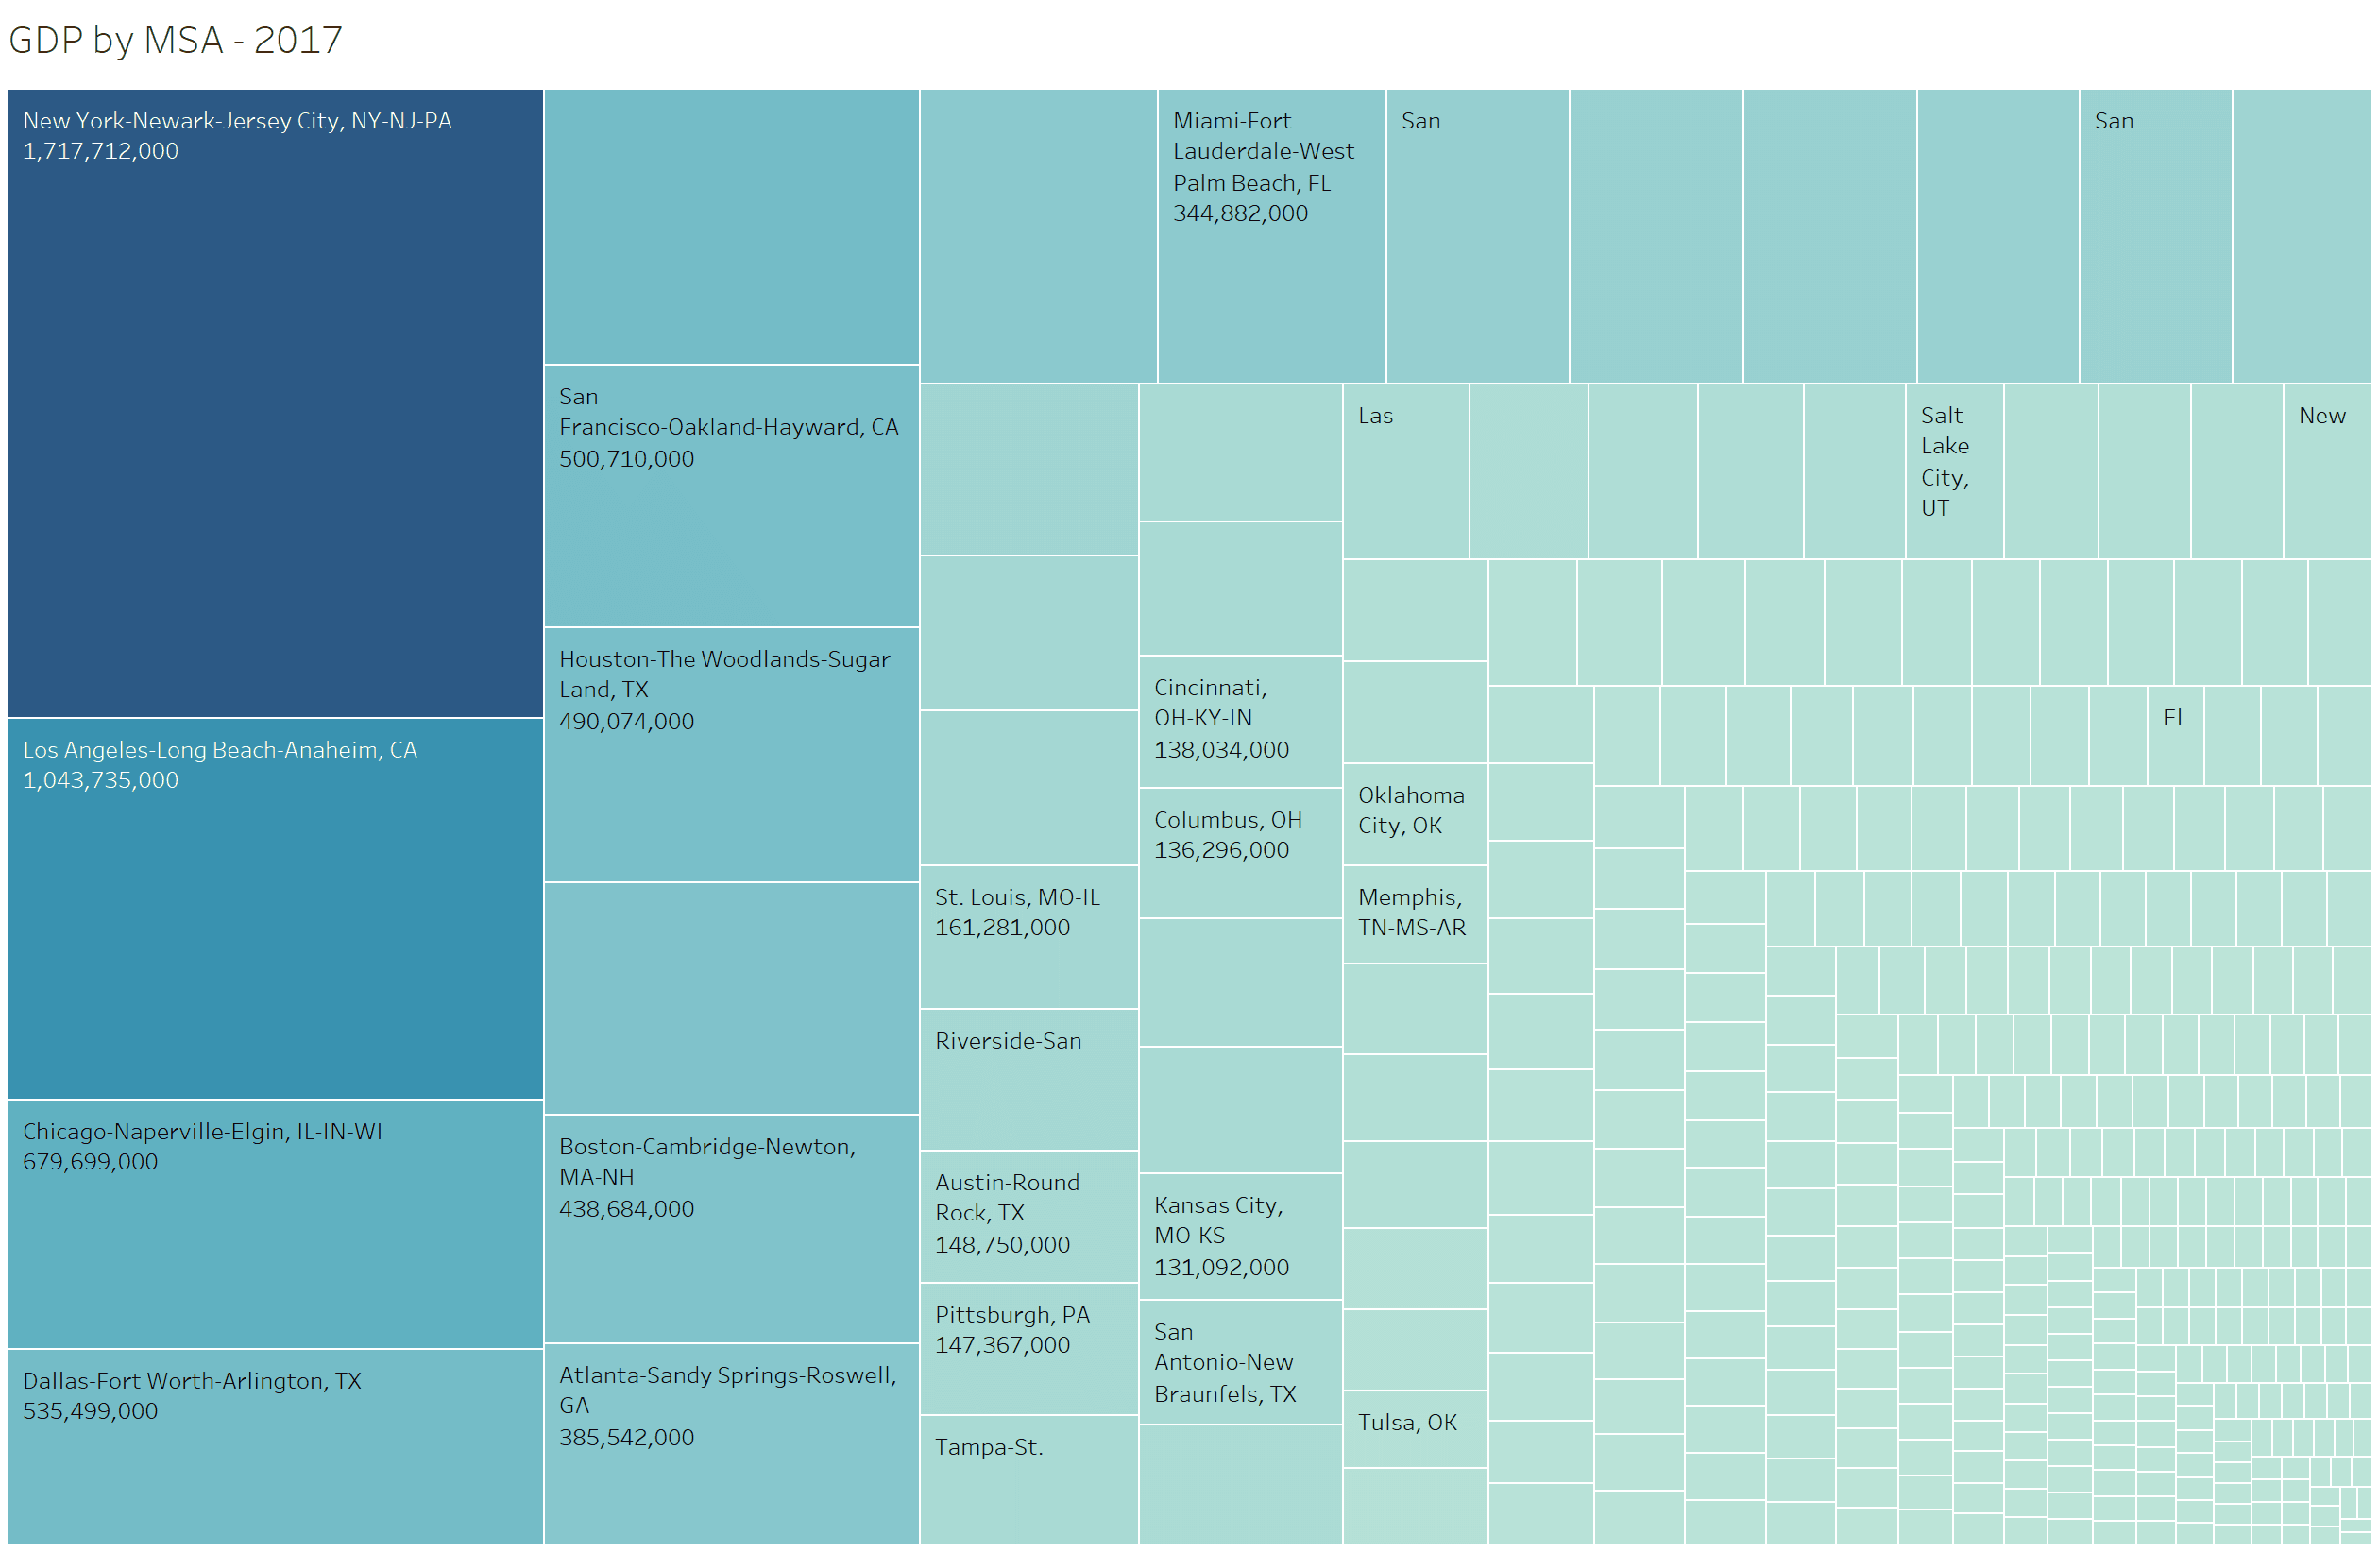
Here’s a look at total GDP by MSA.
In 2017, the top 5 MSA areas – New York-Newark-Jersey City, Los Angeles-Long Beach-Anaheim, San Francisco-Oakland-Hayward, Dallas-Fort Worth-Arlington, and Chicago-Naperville-Elgin – accounted for 25% of all GDP. That’s 1.3% of all MSA’s accounting for 25.5% of all GDP.
If you want a high paying job, one of these areas is likely where you’ll end up.
Is the Trend Reversing?
Some might say – “well, ya, that’s the way it was, but the trend is reversing with the advent of the gig economy”. Curiously, a reversing trend hasn’t shown up yet. From 2012 to 2017, these same 5 MSAs accounted for 27.9% of all GDP growth. That’s right, the trend is getting stronger, not reversing.
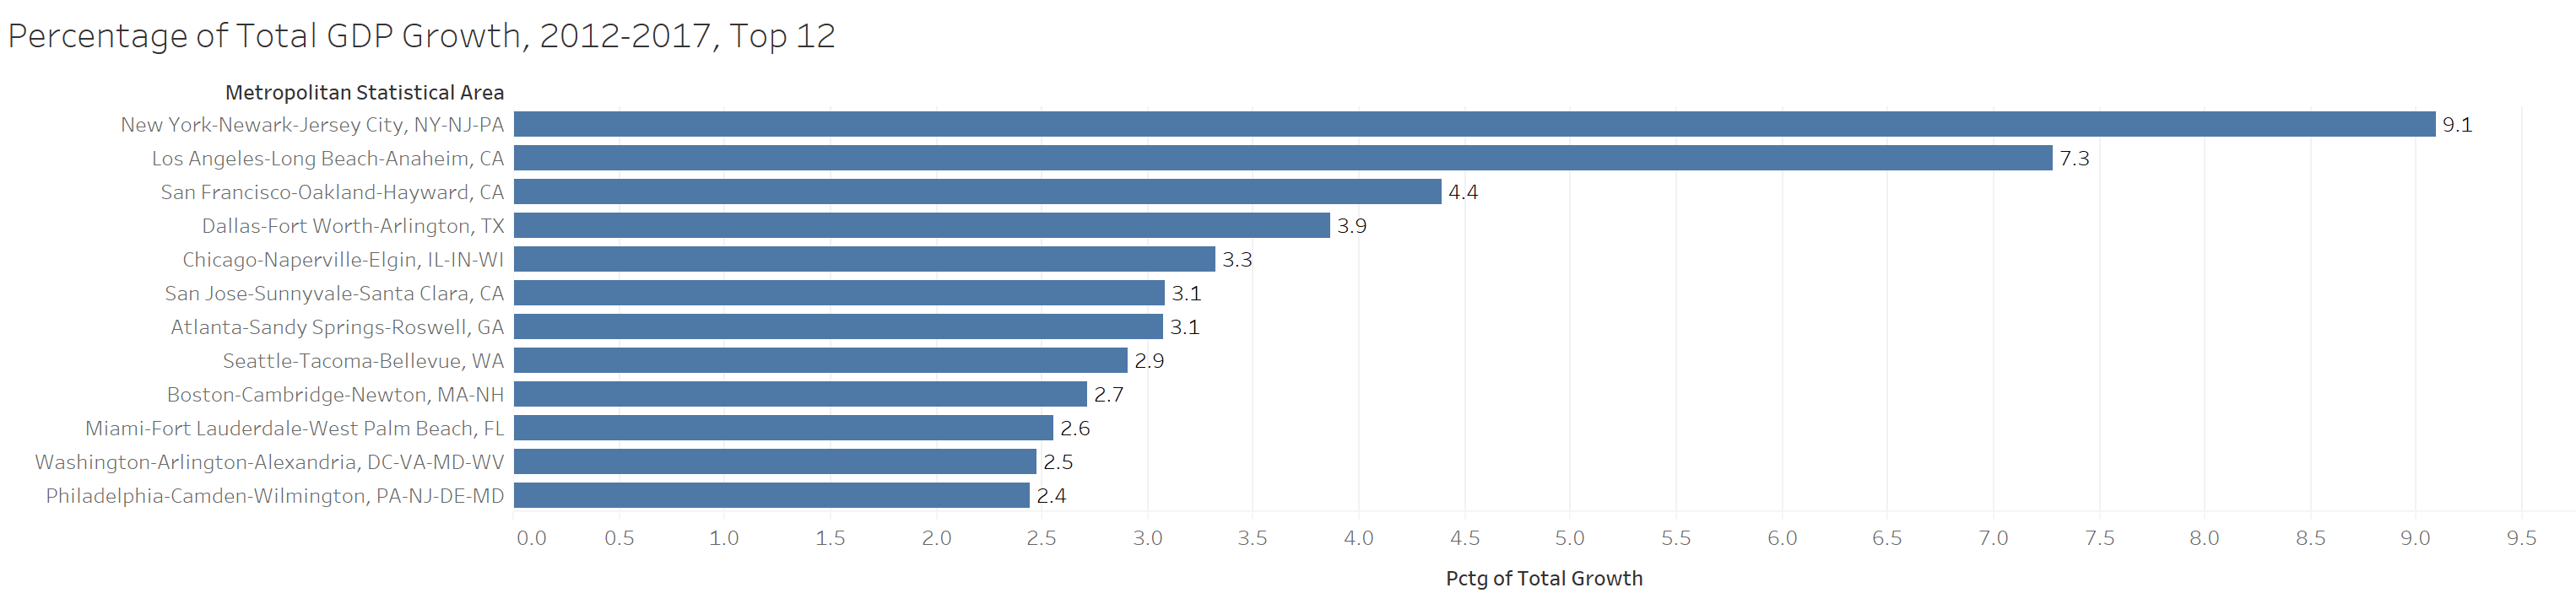
Perhaps even more interesting, the top 12 largest MSAs accounted for a massive 47.2% of all GDP growth. That’s 3.1% of all MSAs accounting for 47.2% of all GDP growth.
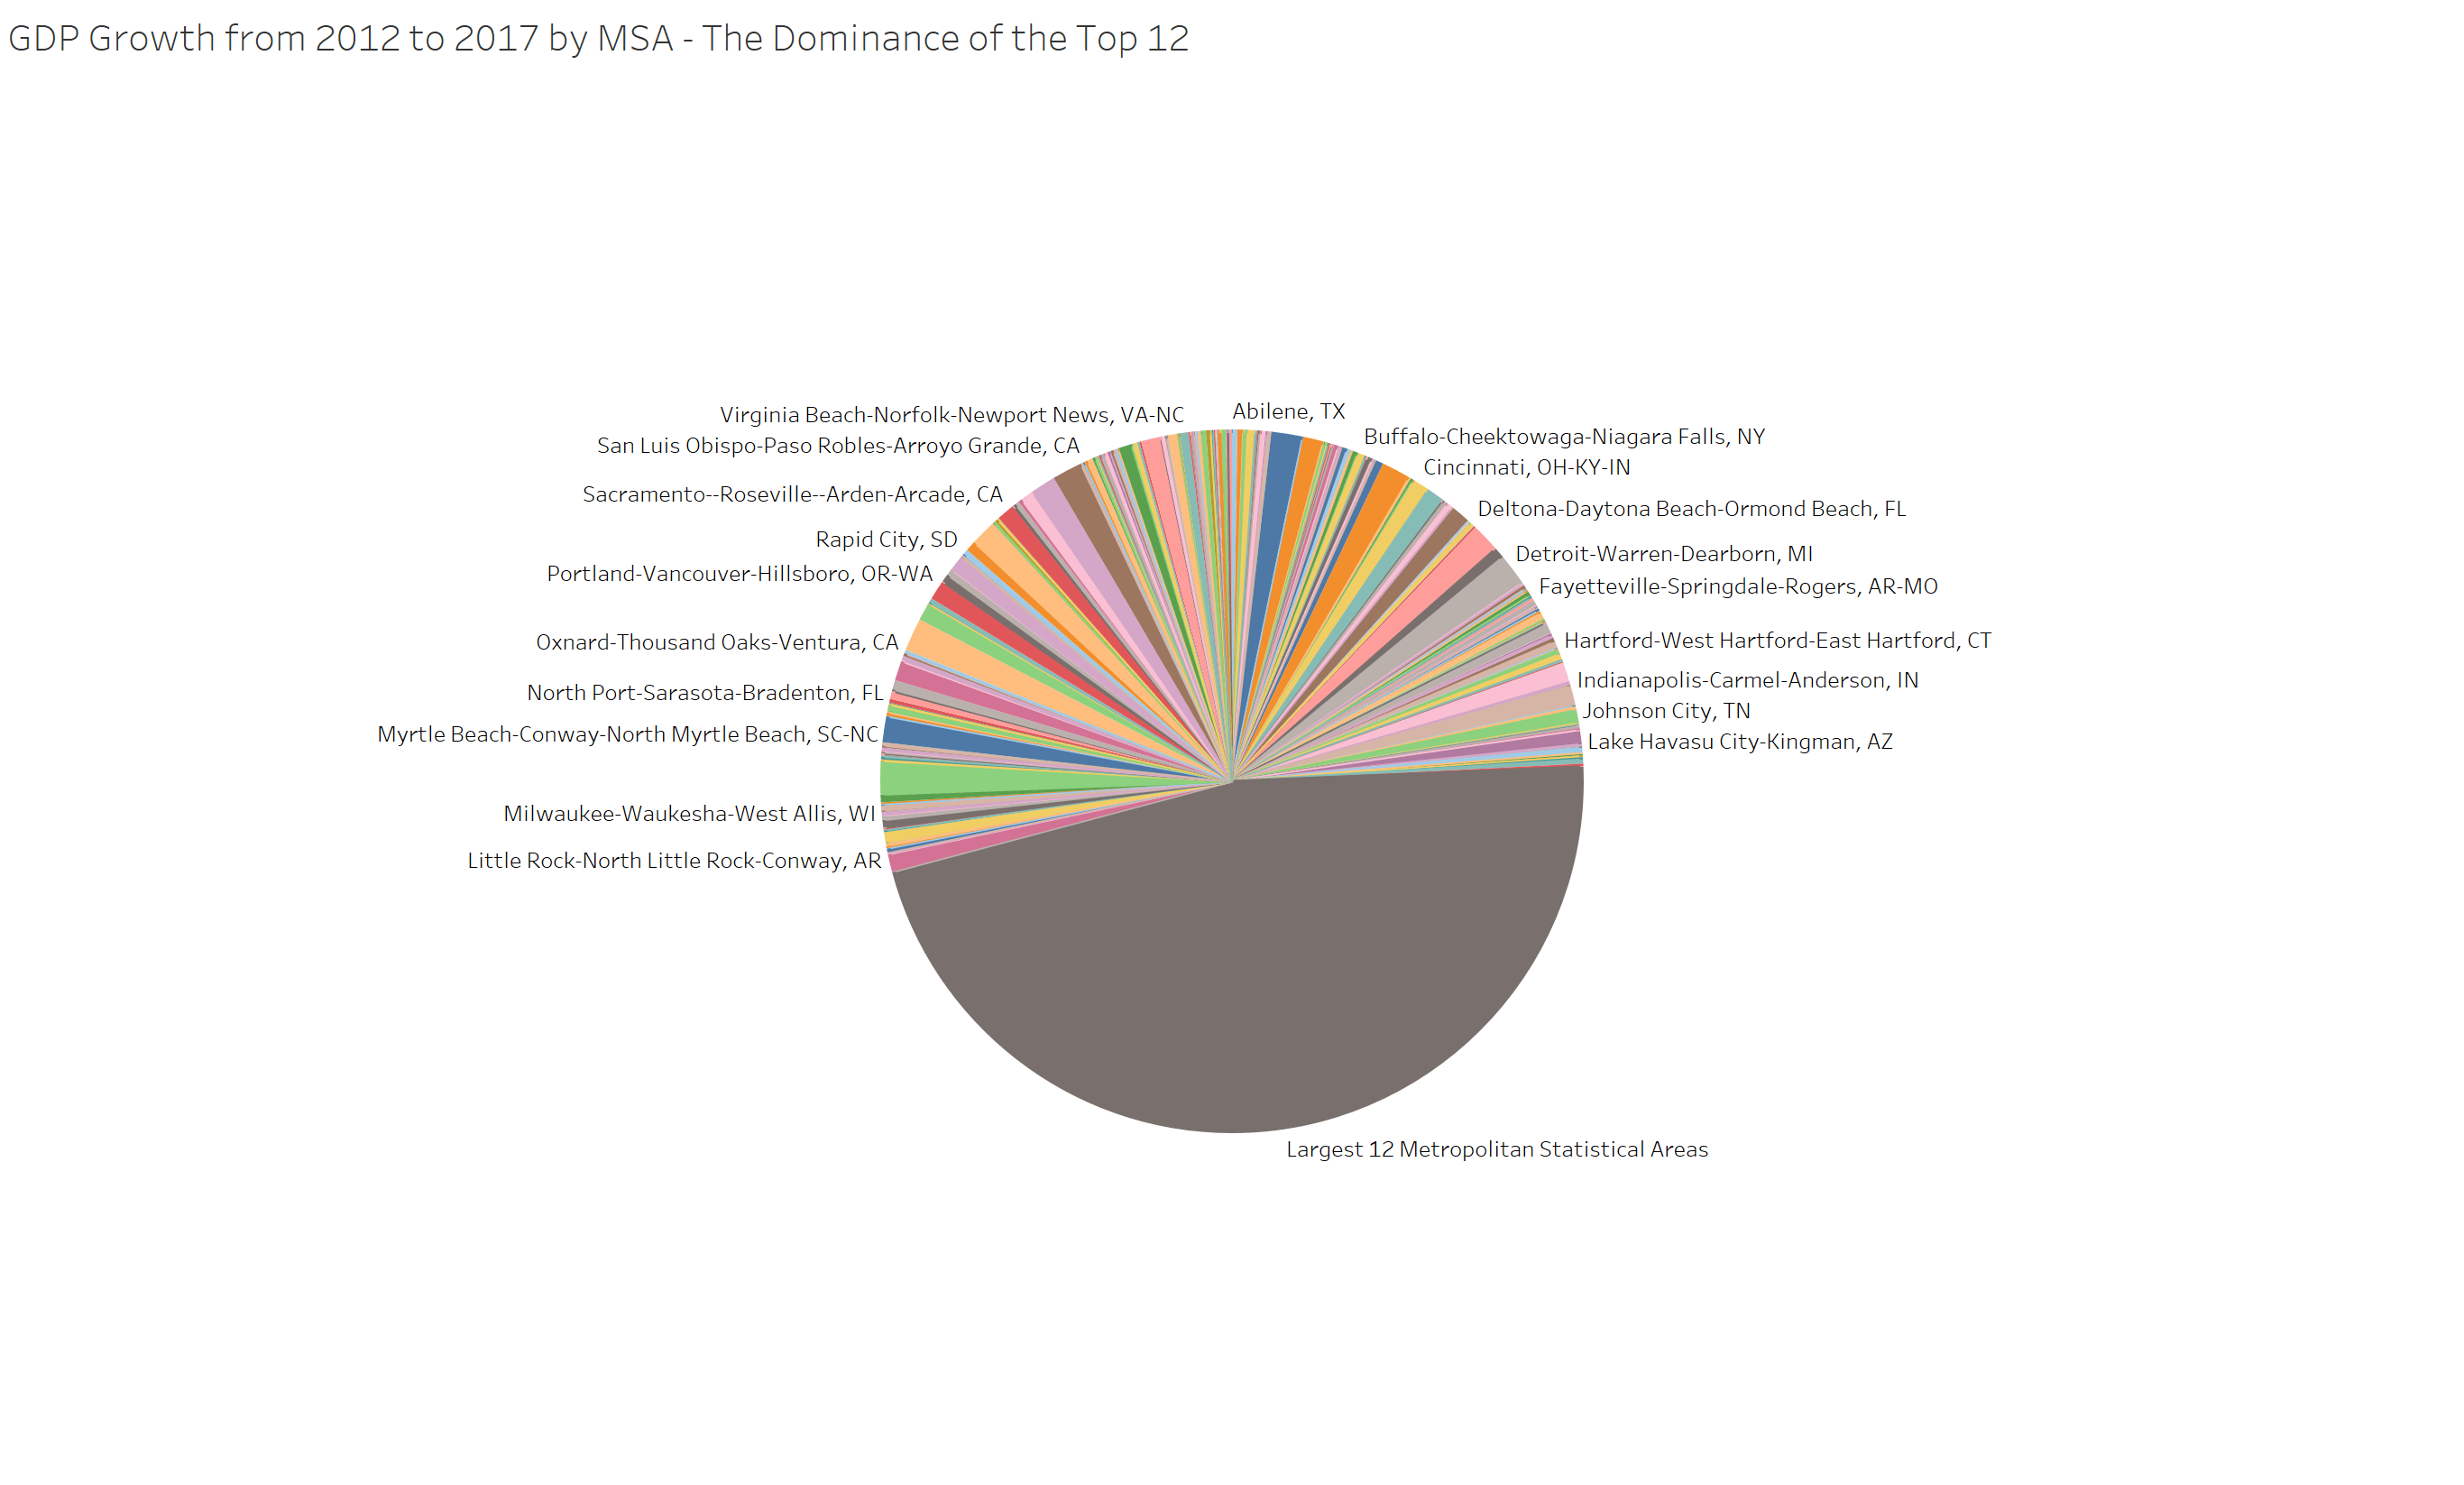
The top 12 are listed here.
The Large Cities’ Dominance Shows Up in Building Permits
Outside of GDP, where else does the growing dominance of large cities show up?
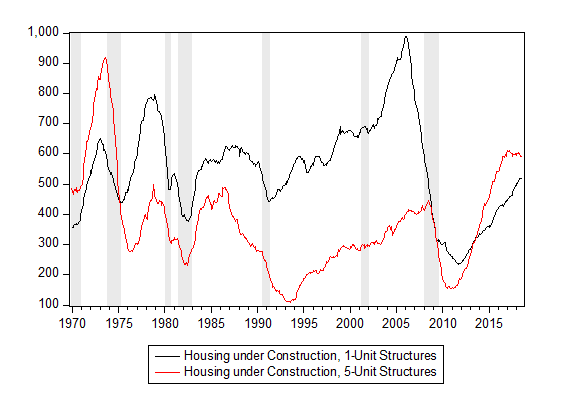
Well, one place where the effect clearly shows up is housing starts. Since August 2013, homes under construction with 5-units or more (i.e. apartments or condos) have outnumbered single-family homes (i.e. the white picket fences). We haven’t seen this since March 1975.
The most recent figures for August 2018 have 593,000 5-unit structures under construction and only 519,000 single-family homes.
It looks like the trend might be slightly reversing for the younger generation, but we’re still a while away from letting the good times role for the non-dominant MSAs.
Conclusion
If you’ve ever wondered why a chunk of the younger generation appears so unhappy, part of the reason stems from their job prospects. As opposed to their parents’ generations, jobs are not easily coming to them.
Instead, large parts of the young generation must move to big cities – and give up on the white picketed fence American Dream. The future doesn’t appear to be shifting directions either.
If you like the articles, and would like access to all the raw data and visualizations behind our articles, please subscribe.


