
Overview
According to Barclay Hedge, the Hedge Fund Industry, excluding Managed Futures, has grown from $500 billion to $3.5 trillion during the 15-year period from 12/31/2002-012/31/2017. This essay will analyze the major source of returns which comprise the Barclay Hedge Fund Index (“BHFI”) during that time frame. There are 14 different categories of benchmarks that are listed by Barclay Hedge. The risk adjusted returns of the index are primarily determined by equity hedge fund strategies and strategies correlated to equity hedge funds. We estimate the index has between 80%-90% of its risk allocated to equity strategies or strategies that are highly correlated to equity strategies. We believe that hedge funds, as represented by the BHFI, can effectively be viewed as equity replacements. Further, we also believe that the proper benchmark for Equity Hedge Funds are Target Volatility strategies. We will use the Barclay Hedge Fund Index (“BHFI”), and two of its categories, Barclay Equity Long Bias Index (“BELBI”) and Barclay Equity Long Short Index (“BELSI”) to represent Equity Hedge Funds.
Q1 hedge fund letters, conference, scoops etc
There are three issues we will address in this essay. First, The BHFI provides little diversification to traditional Long Only Equity indexes due to its high correlation. Second, Equity Hedge Fund managers do outperform traditional Equity Indices on a risk adjusted basis. This may or may not be surprising to some, but it was surprising to us. Third, we hypothesize the reason for this outperformance is hedge funds engage in a risk premia strategy called intertemporal risk parity. Other terms for this are called Target Volatility and Constant Volatility. In other words, this outperformance by BHFI over Long Only Equities can be also matched by using Target Volatility strategies. That is, Target Volatility Equity strategies outperform Long Only Equity strategies by a similar amount as Equity Hedge Fund strategies outperform Long Only Equity strategies, once fees are equalized. When lower fees are applied to Target Volatility strategies they, therefore, outperform Hedge Funds. We assert the best benchmark for Equity Hedge Funds are not Long Only Equity indices but Target Volatility Equity strategies. We are not aware of any studies which have discussed these three topics in an integrated fashion. If our combined hypotheses are accurate this can have a significant impact on how one should view the performance of Hedge Funds.
Barclay Hedge Fund Indices Are Highly Correlated To Traditional Long Only Indices
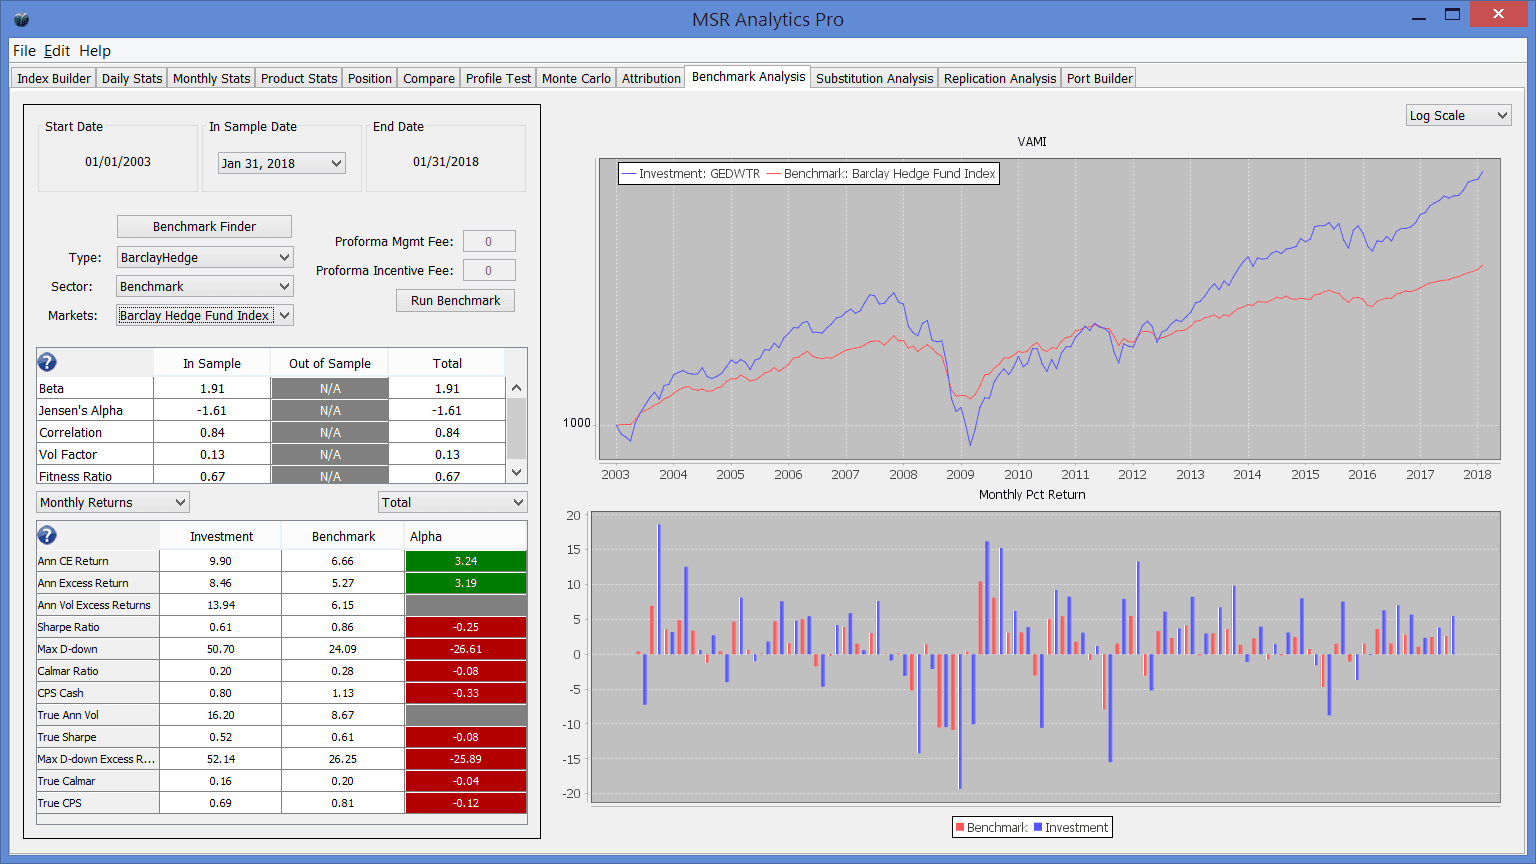
It is generally assumed that hedge funds create diversification. This can be true, of course, depending on what investors combine them with. What surprises us, however, is how highly correlated the BHFI is with Long Only Equities. We first compared the MSR Global Equity Dollar Weighted Total Return Index “GEDWTR” to the BHFI. The GEDWTR consists of 7 equally notionally weighted futures contracts (SPX, NDX, DOW30, FTSE, EUROSTOXX30, DAX, Nikkei). These are the most traded equity futures indices and represent about 43% US, 43% Europe, and 14% Japan. The GEDWTR is a traditional long only equally weighted Total Return index which reinvests dividends and is rebalanced daily to maintain equal notional weightings among the 7 equity futures markets. The monthly correlation between GEDWTR and BHFI is .84 and the annual correlation is .94. Chart 1 provides a comparison of a variety of performance statistics, some of which may be unfamiliar. We will discuss the meaning of “True Sharpe” a little later in the paper. CE means cash equivalent, or total annual return; Calmar ratio means annualized return divided by maximum drawdown over the time frame measured; excess return is total return less the risk-free (RF) rate; and CPS is the sum of the Calmar ratio and Sharpe ratio. We also use the term “True” Calmar. All the True Calmar does is use excess returns above the risk-free rate in the numerator rather than total return.
CHART 1 – GEDWTR VERSUS BHF
BHFI Outperforms Long Only Equity Strategies on a Risk Adjusted Basis
So far, we have asserted that the BHFI is virtually an equity replacement. We use this term from an analytical perspective as one cannot invest in the BHFI. However, we will be describing the practical implications of this observation in the rest of this essay. Most articles and essays that compare hedge fund performance versus mutual fund performance, or any Long Only Equity strategies, such as the S&P, tend to emphasize absolute returns rather than risk adjusted returns. Many articles have been written about the underperformance of hedge funds to equities, but they are not often discussed in risk adjusted terms. However, a recent essay by Pensions and Investments (Hedge funds produce higher risk-adjusted returns than equities …) references a study by Preqin and AIMA that show that hedge funds have outperformed equities on a risk adjusted basis. While we agree with their conclusion, we believe that Target Volatility is the cause of this outperformance. We will return to this topic shortly. But before we continue, we first want to discuss how to properly compare risk adjusted performance.
We find it extremely unusual that every Hedge Fund Index, and individual hedge funds, calculate their Sharpe ratios as if the returns of hedge funds follow the equivalent of Burton Malkiel’s famous “random walk”. Sharpe ratios convey misleading information when this is done. Hedge Fund returns do not follow a random walk (Random Walk Theory – Investopedia). The BHFI and its components have very high positive serial correlations, typically about .30. A random walk return profile has zero serial correlation. We use the term “Adjusted Sharpe”, or “True Sharpe” to account for serial correlation and to differentiate the way we quote Sharpe ratios than do all the various index data providers as well as hedge funds themselves. (see Rulle: Sharpe Ratios Reported by Hedge Fund Indices Underestimate Annual Standard Deviation).
This is a topic that has been written about for at least 25 years by many academics and practioners, (including by William Sharpe), and yet, with all the quantitative talent in the industry, this continues to be ignored. It is likely not a coincidence that Sharpe ratios are higher when a random walk is assumed. The Calmar ratio is an intuitive and helpful way to understand why the True Sharpe is a better measure of risk adjusted returns. True Sharpe ratios also account for large left tail results (and, perhaps more importantly, left tails yet to come) as do Calmar ratios. Strategies with higher Calmar ratios than other strategies tend to have lower comparative “random walk” Sharpe ratios, but higher comparative True Sharpe ratios.
Let us now return to the relative risk adjusted performance of the BHFI and the GEDWTR (Chart 1). The True Sharpe ratio is .61 for the BHFI and .52 for GEDWTR (from here forward we will always use the “adjusted” or “True” Sharpe ratio). The True Calmar Ratio is .20 for BHFI and .16 for GEDWTR. So, even when we calculate the risk adjusted returns accounting for serial correlation in Hedge Funds, Long Only Equities still underperform Hedge Funds. Further, GEDWTR has no fees attached to it, while Hedge Funds tend to charge about “1&20” on average. If we were to charge the same 1&20 to the GEDWTR, the Sharpe ratio of the latter would be .38 versus .61 for the BHFI. This is significant outperformance by the BHFI. Now that we have plowed through how to look at risk adjusted returns, should we be surprised at this outperformance?
When we thought about this at first, we were surprised. After all, this would seem to be prima facie evidence, that when adjusted for equal fees, Equity Hedge Funds provide pure Alpha, even if they keep a large part for themselves. Yet, think of all the essays that have been written demonstrating that Passive Index funds outperform Actively Managed Funds. Both Vanguard (The case for low-cost index fund investing) and S&P/Dow Jones (Persistence Scorecard: December 2017) make compelling cases that Passive Indexes outperform Actively Managed portfolios . Equity Hedge Fund managers are nothing if not active managers. While higher fees tend to be part of Vanguard’s and S&P’s arguments for Passive Index outperformance, it is not the sole reason. But as we have shown, Equity Hedge Funds clearly outperform Equity Indexes. We believe this performance is explainable, and not merely prima facie evidence of Alpha, as implied by Preqin and AIMA. Outperformance is very likely the result of a definable risk resulting from Target Volatility strategies. We will now turn to a discussion of “Target Volatility”, which we believe is the likely source of this outperformance and is really a source of risk premium.
Let’s first describe Target Volatility. (For a more technical explanation of Target Volatility please see Morningstar Target Volatility Methodology Paper). A Target Volatility portfolio seeks to maintain a constant standard deviation of returns. For example, assume we use a simple rolling 6 month look back period to implement target volatility (see Predicting Volatility – Lazard Asset Management). As the underlying volatility of the market rises over time, to maintain the desired target volatility, we will need to reduce the absolute dollar or notional size of the portfolio. Conversely, if the volatility of the market declines we would need to increase the absolute notional size of the portfolio to maintain the constant volatility of a portfolio. In short, the portfolio will get smaller in size as volatility rises, and larger in size as volatility declines. Interestingly, as a general matter, we do not observe a significant difference in risk adjusted returns in most asset classes when using either method. However, the one exception to this observation appears to be in the equity markets.
We believe Target Volatility is likely the cause of Equity Hedge Fund benchmark outperformance versus Long Only Equities. While it is not possible to directly calculate the risk weighting through time of equity portfolios in the BHFI, since we cannot get the information, our experience tells us that equity traders likely de facto engage in this activity purely as a function of risk management. The use of VAR limits provides an example of how this can happen. If a trader has a certain VAR limit, this will incentivize them to increase their position sizes as volatility declines, while also decreasing their positions as volatility rises, exactly what Target Volatility strategies do. But regardless of the precise cause, Equity Hedge Fund outperformance, is very similar to the outperformance one would expect if they did directly engage in Target Volatility strategies. We will demonstrate this shortly.
We need not merely speculate, however. Target Volatility is a well-known phenomenon. It is a type of Risk Parity strategy (called intertemporal risk parity) that has been used in various ways since the early days of the OTC derivative markets. In addition, there are many studies which have documented its relative performance to traditional Long Only Indices. In a paper written by Papageorgiou, Reeves, and Sherris, the authors conducted an empirical analysis comparing a Constant Volatility Weighted (or intertemporal risk parity) S&P portfolio and a Constant Dollar Weighted S&P portfolio (the normal S&P portfolio) and demonstrated that the former portfolio outperformed on a risk adjusted basis. The authors found the results consistent throughout sub-periods of time as well. (Equity Investing with Targeted Constant Volatility Exposure). The time frame covered was from 1929-2013. They calculated the annualized daily information ratio (annualized daily returns/annualized daily volatility) of the two portfolios which were .65 for the constant volatility portfolio and .51 for the constant dollar weighted portfolio. Under the assumption of equal average volatility for both portfolios, the constant risk portfolio outperformed by 200 basis points per year.
AQR, in 2017, produced a paper (AQR – Portfolio Rebalancing: Common Misconceptions) performing a similar analysis on 17 equity markets beginning in 1975. 15 of the 17 markets had a higher Sharpe ratio when using Target or Constant Volatility then did those same markets dollar weighted. They too found this phenomenon primarily worked only in equity markets. Perchet, Corvalho, Heckel, and Moulin seek to explain why this phenomenon occurs in their paper “Predicting the success of volatility targeting strategies: Application to equities and other asset classes“. The primary reason they site is that volatility clustering, when combined with an inverse relationship between volatility and returns, will create higher risk adjusted returns. This is the case only in equity markets.
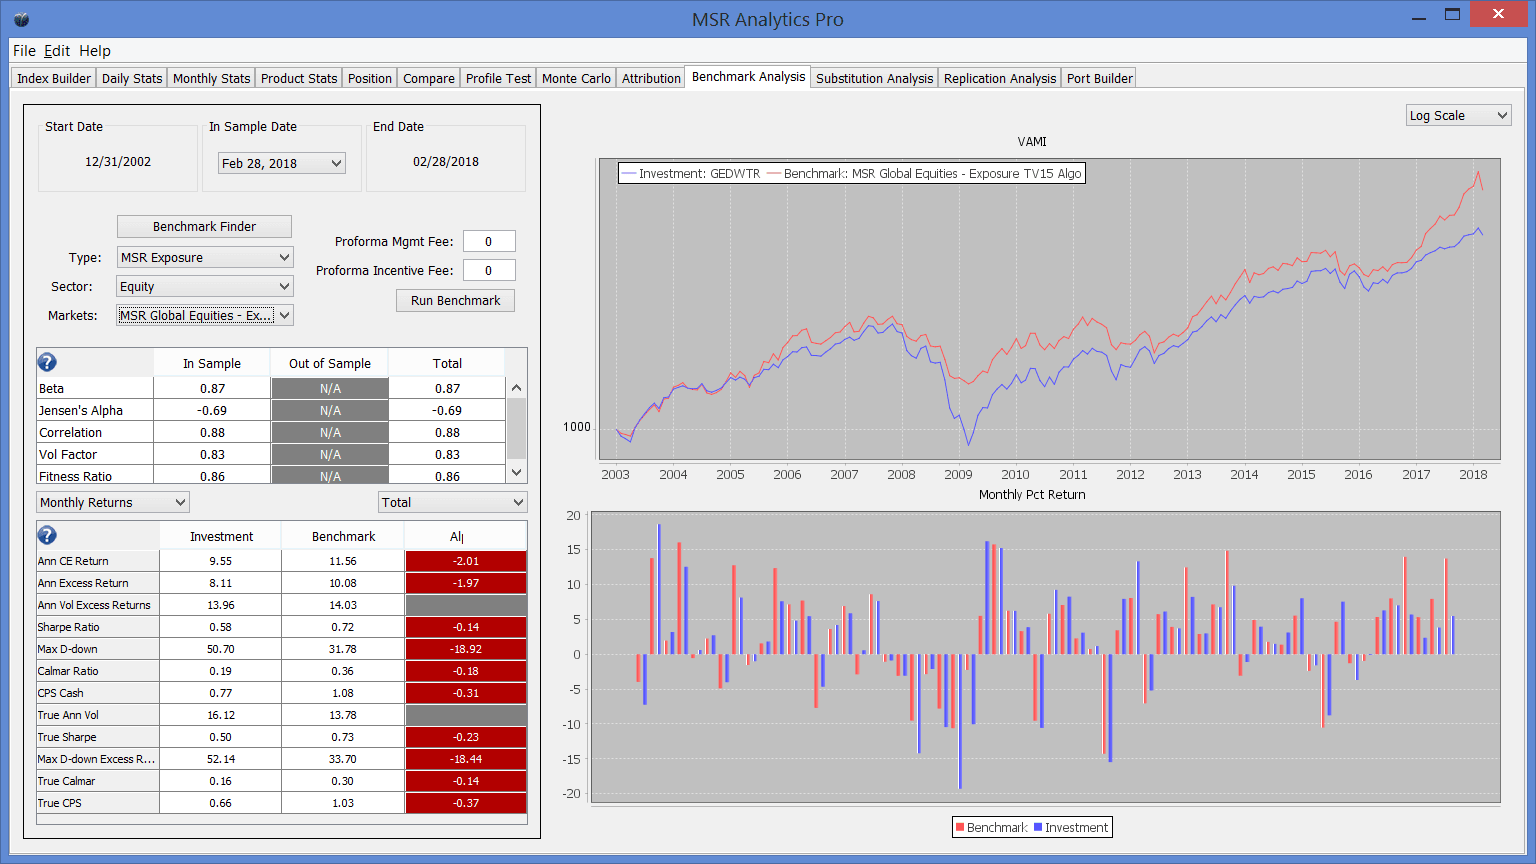
We will now compare in Chart 2 below the GEDWTR (Global Equity Dollar Weighted Total Return index) performance versus the GETV15TR (Global Equity Target Vol 15 Total Return index) from 01/01/2003-02/28/2018. Recall, the GEDWTR is a traditional Long Only Total Return index which reinvests dividends and is rebalanced daily to maintain equal notional weightings among the 7 equity futures markets. The GETV15TR is a Constant Target Volatility portfolio of the same instruments (while 15% is the average monthly volatility of the equity markets, the choice of TV15 versus TV10 or TV20 does not impact risk adjusted returns). The GETV15TR is rebalanced daily to maintain a constant risk weighting as described above. The Sharpe ratio of the GEDWTR versus the GETV15TR are .50 versus .73; the monthly correlation is .88; the comparative Calmar ratios are .16 versus .30; the comparative excess returns are 8.11 versus 10.08; and the comparative maximum drawdowns are 50.7% versus 31.78%. These results confirm the results documented in the studies we referenced. We also got comparable results when comparing dollar weighted US Equities and dollar weighted Non-US Equities to each of their Target Volatility equivalents. The dollar weighted S&P versus the Target Volatility S&P from 12/31/1982-2/28/2018 also gets similar results. Constant Volatility equity portfolios do outperform traditional dollar weighted portfolios
Chart 2 GEDWTR vs GETV15TR
What is the risk that Target Volatility portfolios assume which creates this outperformance? It is primarily volatility risk. The volatility risk is the potential of a sudden spike in volatility after an extended period of lower volatility when Target Volatility traders are likely to be more leveraged. This is a risk because spikes in volatility are usually associated with a decline in returns. The result of taking this risk has been earning a risk premium which has created outperformance. The willingness to potentially suffer sharp short-term declines in prices when one is leveraged (or to underperform when one is de-levered) is the risk one takes when one uses Target Volatility. Yet, over the long run, this strategy has paid off with lower maximum drawdowns, higher Calmar ratios and higher True Sharpe Ratios than only Long Only indices, just as Equity Hedge Fund indices have. This is a simplified version of the phenomenon that Perchet, Corvalho, Heckel, and Moulin discusses in greater detail in their paper.
Hedge Fund Returns Versus Target Volatility Returns
What we demonstrated in the previous section was simply confirming the research that we referenced earlier. Constant Volatility portfolios do outperform traditional long only portfolios. We will now compare Hedge fund returns to Constant Volatility portfolios. Recall that our hypothesis is that Hedge Funds’ (i.e., BHFI) Sharpe ratios will outperform dollar weighted portfolios (e.g., GEDWTR) by a similar amount as Target Volatility portfolio Sharpe ratios (e.g., GETV15TR) will outperform dollar weighted portfolios (i.e., GEDWTR) once adjusted for fees. A little simple algebra tells that we should expect the fee adjusted Sharpe ratios and Calmar ratios of the BFHI and the GETV15TR to be approximately equal.
We will test the hypothesis by assuming the BHFI has average fees of 1&20. We will then compare that to the GEDWTR portfolio in Chart 3. Then, in Chart 4 we will charge 1&20 to the GETV15TR and compare that to GEDWTR. For the hypothesis to be correct, we should expect the difference between the two pairs of Sharpe ratios and Calmar ratios of the BHFI versus GEDWTR and the GETV15TR versus GEDWTR to be approximately the same, once the fees have been equalized.
CHART 3 – GEDWTR Versus BHFI
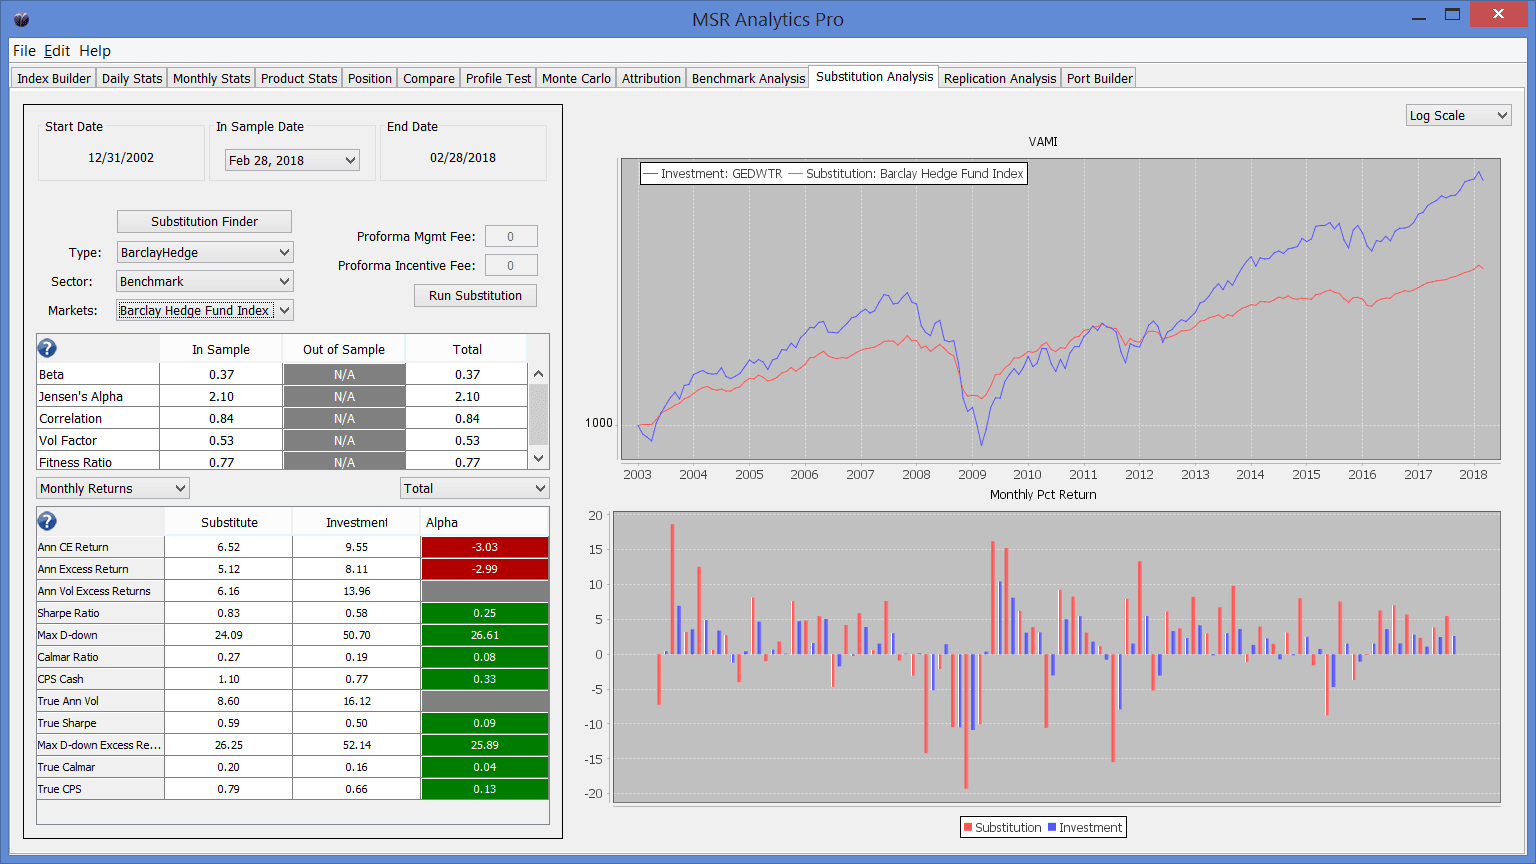
Chart 4 – GEDWTR VERSUS GETV15TR (ASSUMING FEES OF “1 and 20”)
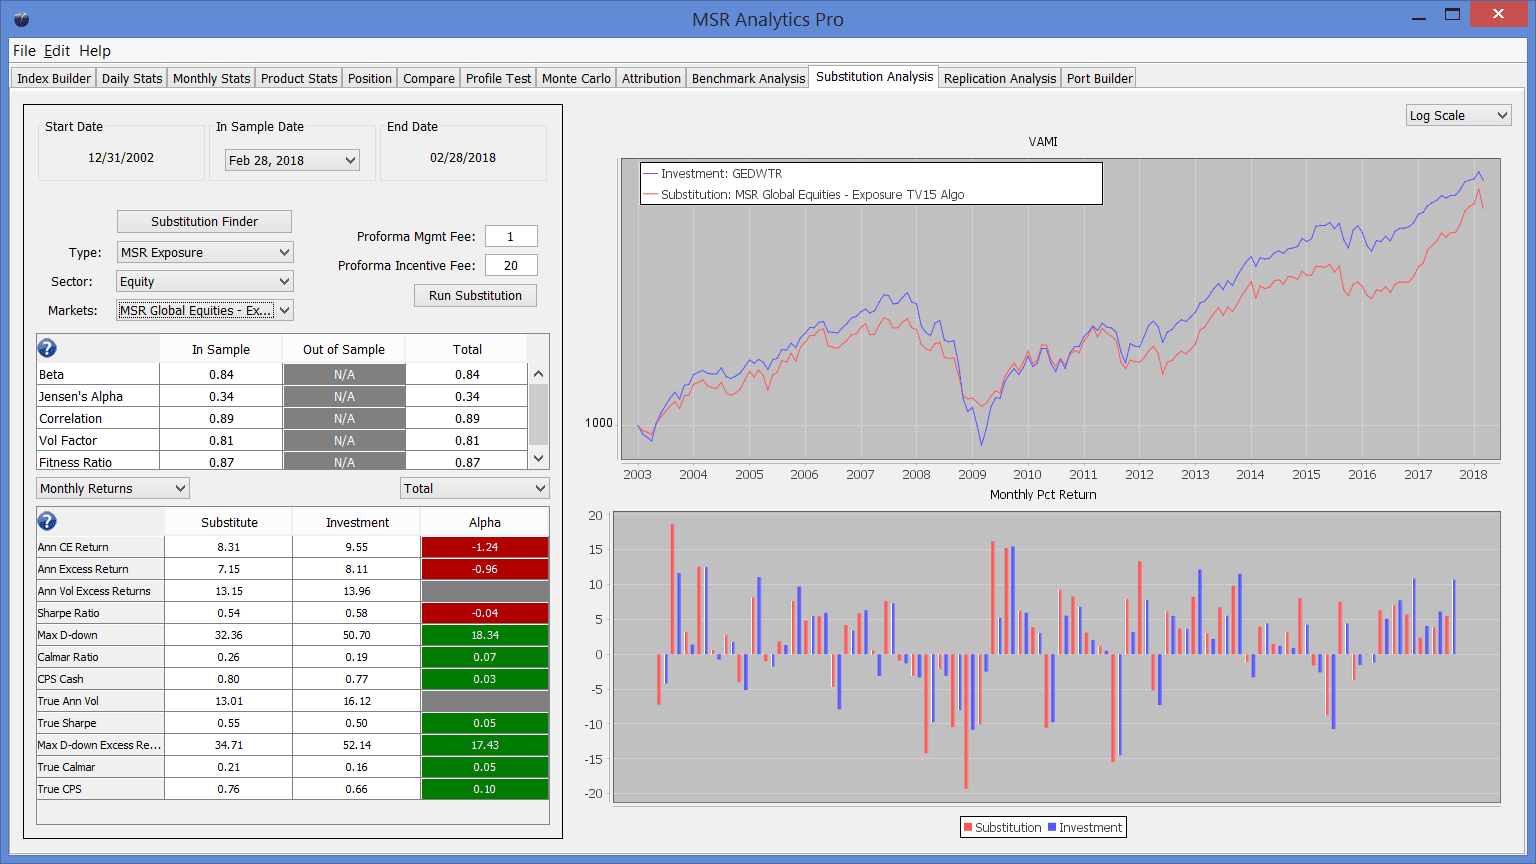
When we compare the difference in Sharpe ratios and the difference in Calmar ratios in the BHFI versus GEDWTR and the GETV15TR versus GEDWTR, we discover the differences are very close when fees are made the same. That is, our hypothesis appears to hold up. The BHFI outperforms the GEDWTR (Chart 3) by a little more than the GETV15TR outperforms the GEDEWTR (Chart 4). The relative Sharpe outperformance is .04 for the BHFI (.59 versus .55) but the relative True Calmar ratios are better for the GETV15TR (.21 versus .20). The relative correlations of the BHFI versus GEDWTR and the GETV15TR versus GEDWTR are .84 and .89.
Finally, in Charts 5 and 6, we directly compare the GETV15 to both the BHFI and the combination of the Barclay Equity Long Bias Index and the Barclay Equity Long Short Index (“BELBI+BELSI”) assuming equal fees.
CHART 5 – GETV15TR VERSUS BHFI ASSUMING FEES OF 1&20
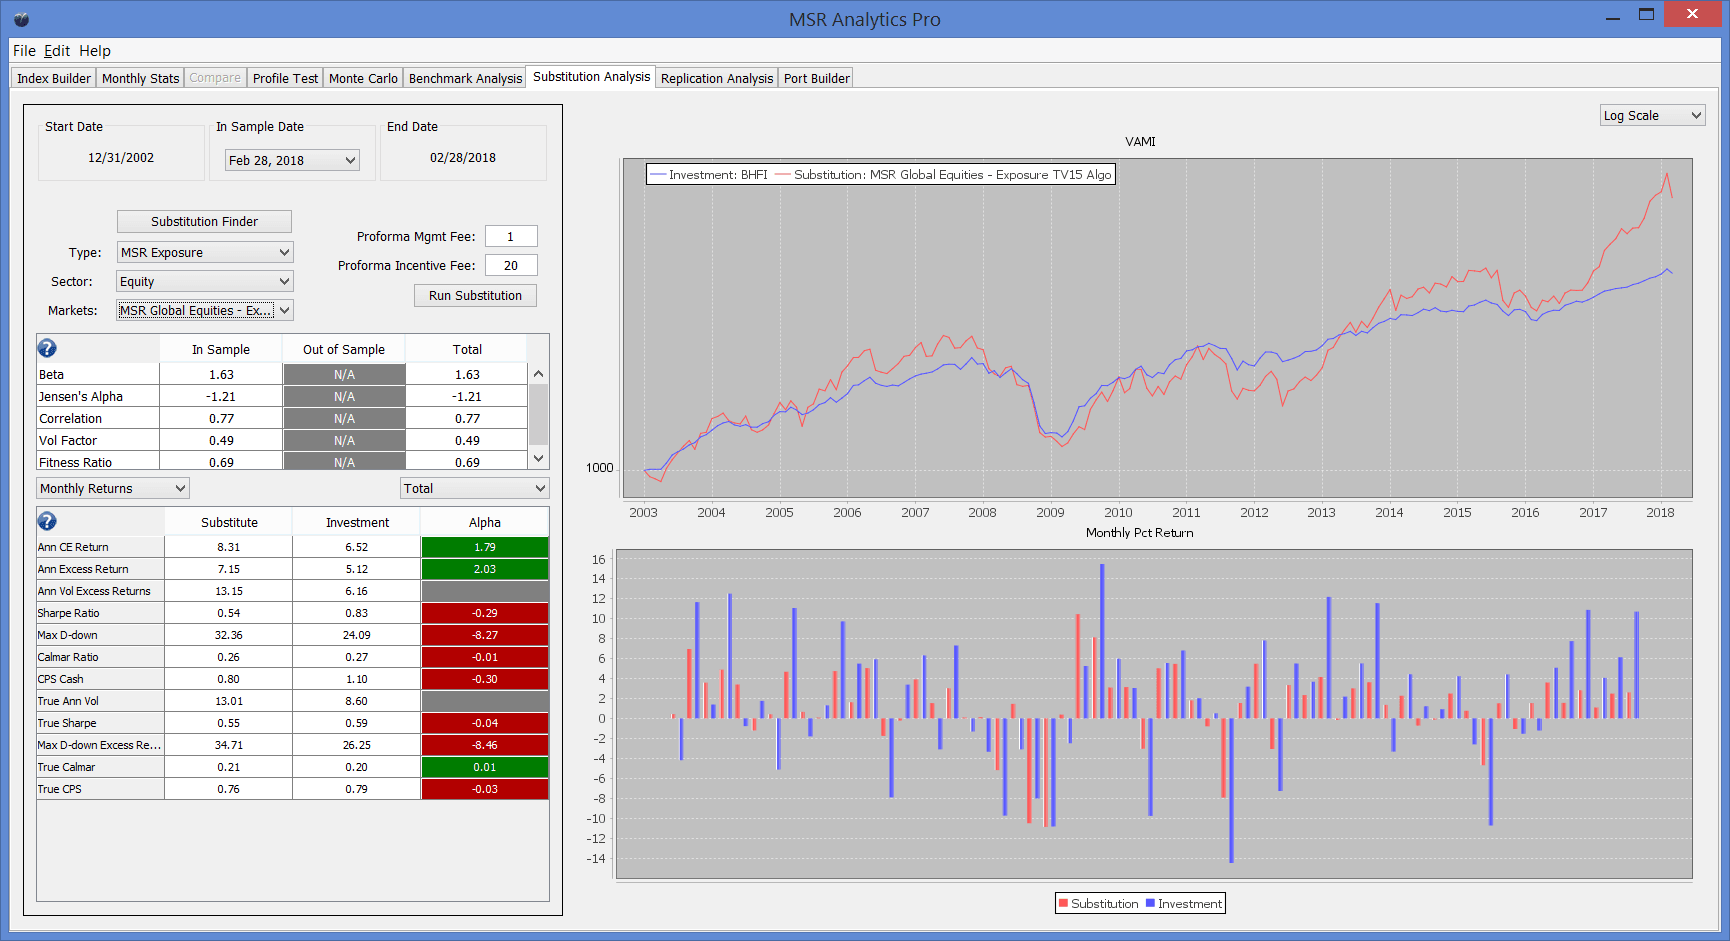
CHART 6 – GETV15 VERSUS (BELSI + BELBI) ASSUMING FEES OF 1 &20
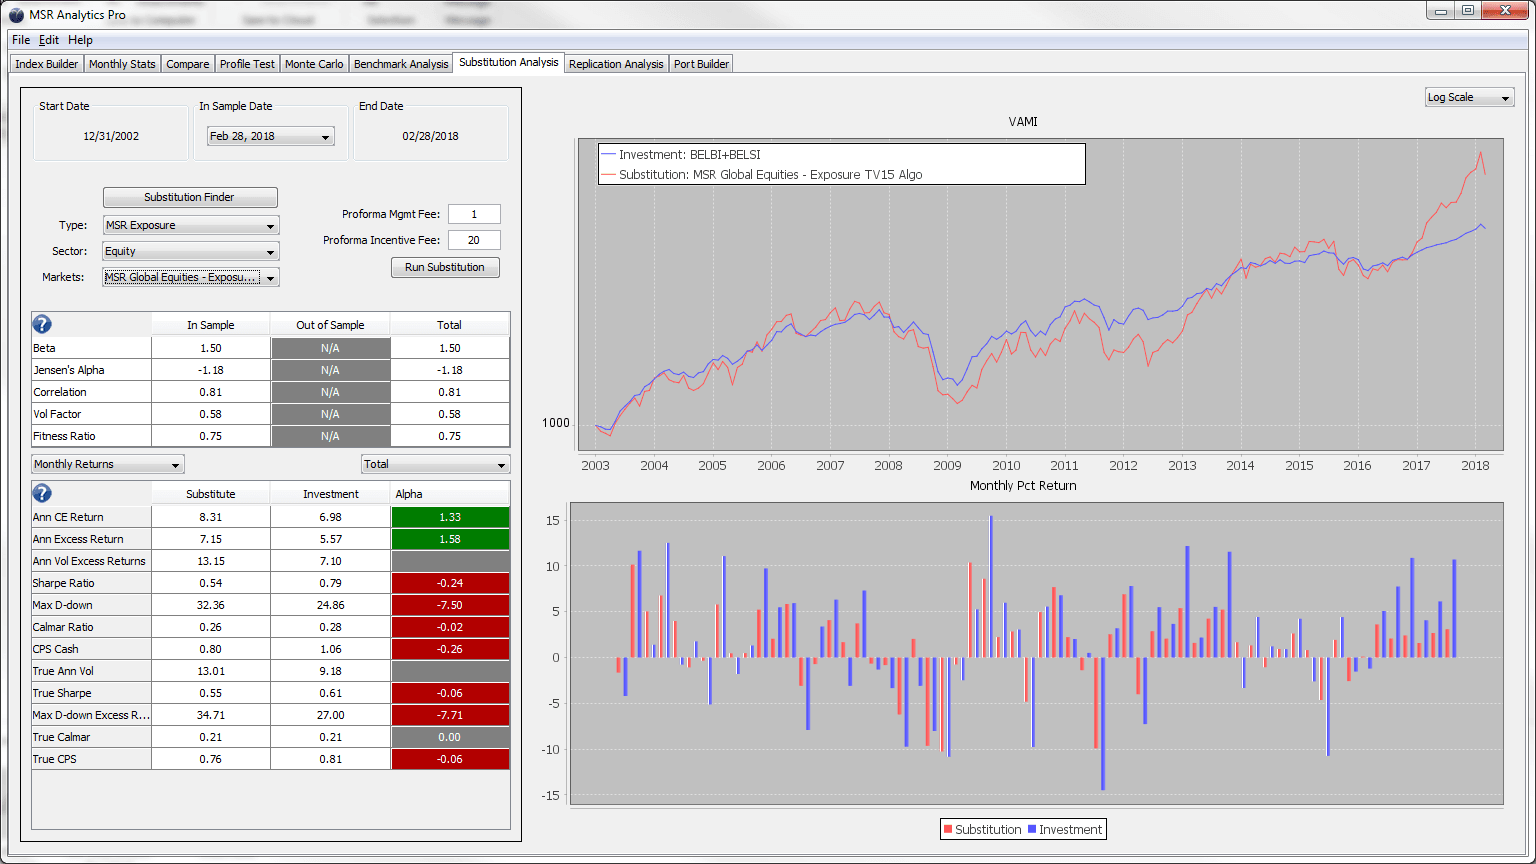
The direct comparison of the GETV15TR versus the Barclay Indices show the Calmar Ratios to be almost identical and the Sharpe ratios of the Barclay indices to be about .05 higher when we assume the fees are 1&20 for the BHFI and GETV15TR.
Conclusions
Why is any of this significant? We do not believe it is coincidental that Equity Hedge Funds outperform Dollar Weighted indexes by virtually the same amount Target Volatility Indexes outperform Dollar Weighted indexes. This means that Equity Hedge Funds and Target Volatility indexes have virtually the same results when fees are made equal. We have also demonstrated this through a direct comparison of Hedge Funds versus Target Volatility Indices. But Target Volatility Indexes are…………Indexes. They are transparent and easily implemented. It would be impossible to charge “1 and 20” for a transparent index. Target Volatility Strategies can be viewed as a replacement for Equity Hedge Fund Strategies. Target Volatility Strategies not only outperform Long Only Equities but also outperform Equity Hedge Funds when fees are fixed below Hedge Fund fees.
In the same way that Vanguard and S&P/Dow Jones factor in fees when comparing Active and Passive strategies, we should also factor in fees when comparing Target Volatility Strategies to Equity Hedge Fund Strategies. A transparent Target Volatility Index should charge the same as other transparent liquid alternative strategies, or no higher than 50 and 100 basis points. We use a 75-basis point fee (which is high for an index strategy) for a GETV10TR index and compare it to the “BELBI+BELSI” portfolio. This result should be an excellent Benchmark for Equity Hedge Funds. We can use the same argument that Vanguard and S&P/Dow Jones makes when comparing Passive and Active Long Only Funds, except apply it to Target Volatility versus Equity Hedge Funds. Chart 7 compares a 10% Volatility Global Equity Index to the BELBI+BELSI portfolio assuming a 75-basis point fee.
CHART 7 – GETV10TR VERSUS (BELBI+BELSI) with 75 basis point fee
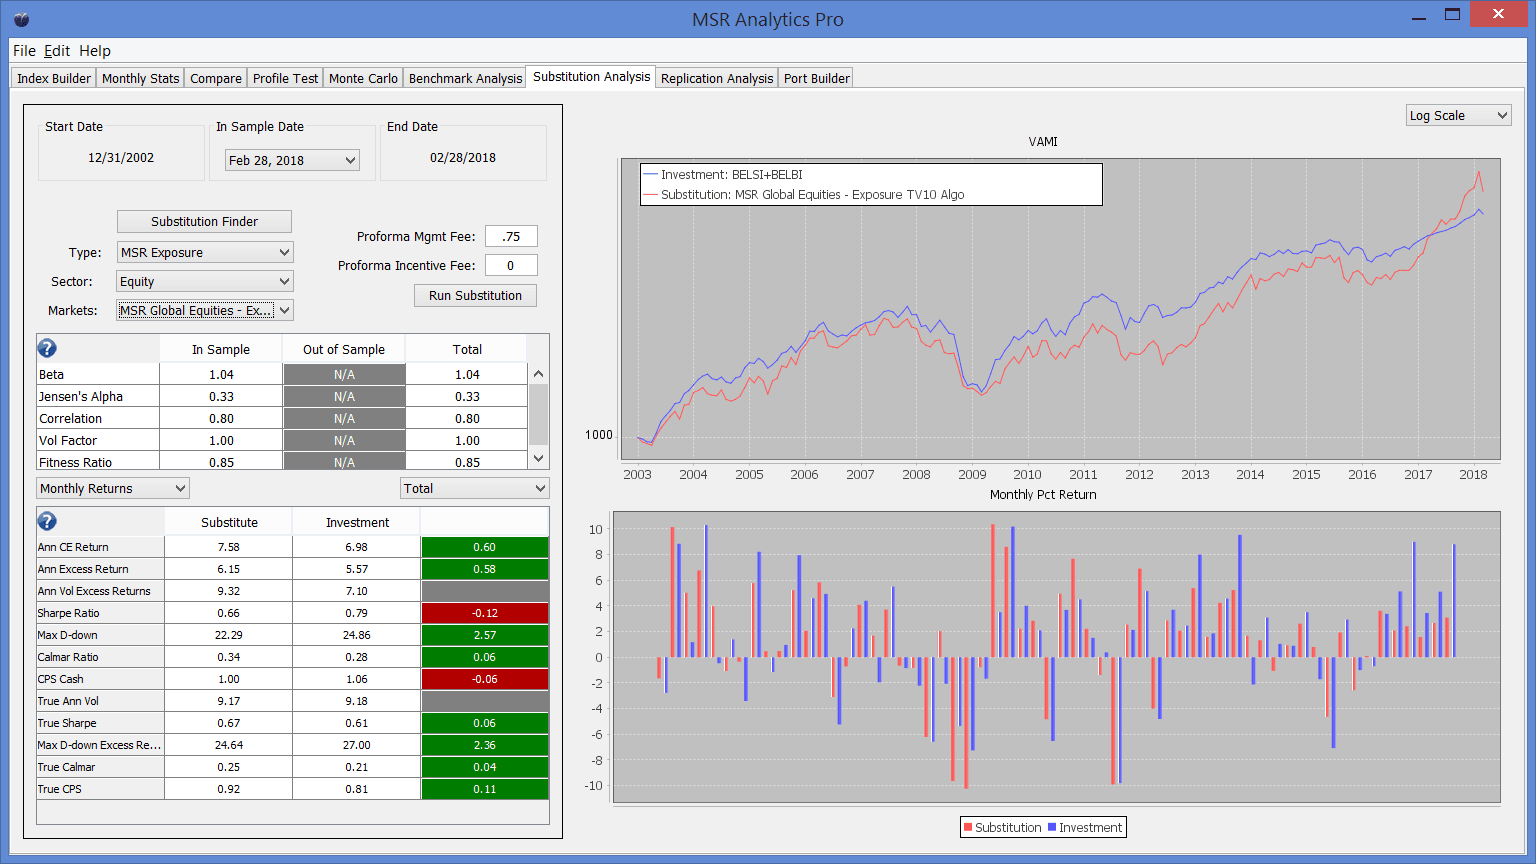
The GETV10TR is an example of a potential Benchmark for Equity Hedge Funds. It is also an excellent liquid alternative replacement investment for Equity Hedge Funds. More importantly, we have introduced the idea that any alpha one thinks that equity hedge funds provide is derived from exposure to the risk premia strategy described in this paper – target volatility. We are not aware of anyone making the same conclusion even though every component idea in this paper is known and well documented.
Michael S Rulle Jr
Founder and CEO
MSR Indices LLC
MSR Investments LLC
973 723 6011 (Cell)
973 706 5136 (Office)


