
The business cycle in the US undergoes waves of booms and busts that create euphoria, and then widespread pain when the economy implodes. This cycle will continue if the Federal Reserve tries to “manage” the $20 trillion US economy to achieve its objectives of maximum employment and 2-percent inflation. It’s tactics involve targeting short-term interest rates, known as the fed funds rate. The fed funds interest rate is the rate banks charge each other for overnight loans.
Q3 2021 hedge fund letters, conferences and more
Since the Federal Reserve was created in 1913, its track record reveals what critics of central banking have been asserting for more than two centuries, namely, a central bank cannot “micromanage” an economy no matter how large or small.
Despite the Federal Reserve’s counterproductive policies, which were responsible for the Roaring Twenties and the Great Depression and numerous booms and busts for the past seven decades — including the dotcom and housing bubbles and the current “everything bubble” — the US economy’s output of goods and services has grown enormously. In short, the US economy, or more precisely the free enterprise system, is incredibly resilient and most entrepreneurs have been and are innovative and resourceful, otherwise they couldn’t have navigated their businesses through the waves of boom and bust.
Nevertheless, corporate managers and small business owners need an economic “lighthouse” to illuminate where the economy is headed. They should be monitoring several key indicators to help them guide their companies. When the economy has been in a relatively long upswing, such as in the 1960s, ‘80s and ‘90s, and businesses experience robust sales and profits, that’s the time entrepreneurs will want to prepare for the inevitable downturn. After all, we know stock prices of even great companies have had substantial “corrections” of 50 percent or more during a long-term bull market. So, too, can a company’s sales plunge and profits turn into losses during a recession.
So what clues can give business decision makers insights into the economy’s direction?
-
Watch The Yield Curve Closely
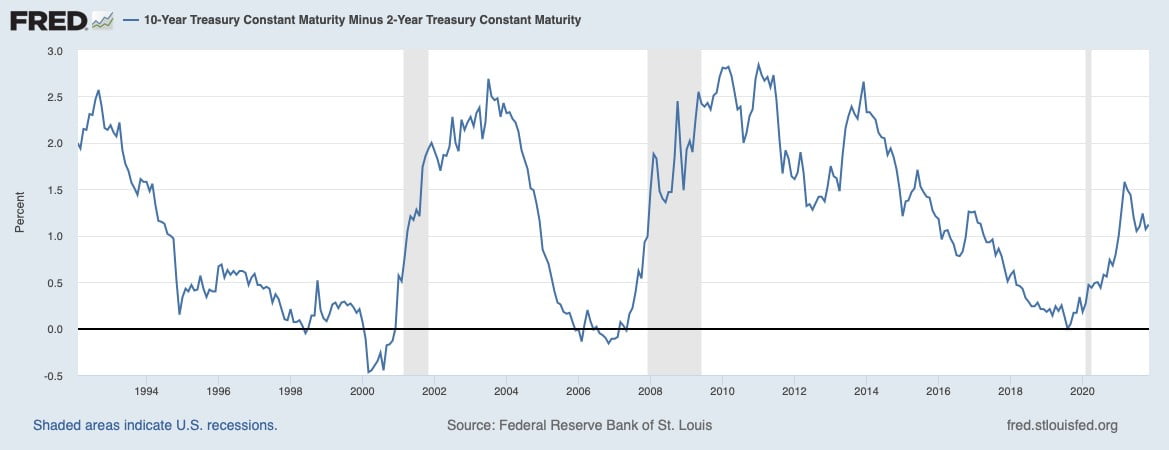
The yield curve is one of the most widely followed financial indicators that portend a recession — usually within a year. The yield curve reveals the relationship between short- and long-term interest rates. Typically, the yield curve is upward sloping, like today, when short term rates are below long-term rates. This reflects a substantial amount of liquidity in the financial markets. When the Fed becomes concerned that the economy is “overheating,” it tends to raise the fed funds rate to cool down price inflation, which occurred prior to the bursting of both the dotcom and housing bubbles in 2000 and 2007, respectively.
In the chart, notice the yield curve virtually inverted at the end of 2019, suggesting that a recession would have begun sometime in 2020. However, the lookdowns in early 2020 in response to COVID-19 caused an economic downturn, not a typical cyclical recession.
Now that the economy is in another cyclical upswing because of the massive injection ($4 trillion) of liquidity by the Federal Reserve, which has purchased $120 billion of Treasury securities and mortgage-backed securities monthly to “simulate” the economy. At its most recent meeting, the Federal Open Market Committee (FOMC) decided to reduce its monthly purchases to $105 billion. In other words, the Fed will continue to have its foot on the monetary pedal to inject substantial amounts of liquidity into the financial markets even though price inflation has accelerated to a 5 percent annual rate year over year. In the past, accelerating inflation would set off alarm bells at the Fed to raise interest rates to dampen inflationary pressure and expectations. Currently, the thinking at the Fed is that price inflation is “transitory” and therefore monetary policy doesn’t need to be tightened.
-
Track How The Stock Market Is Trending
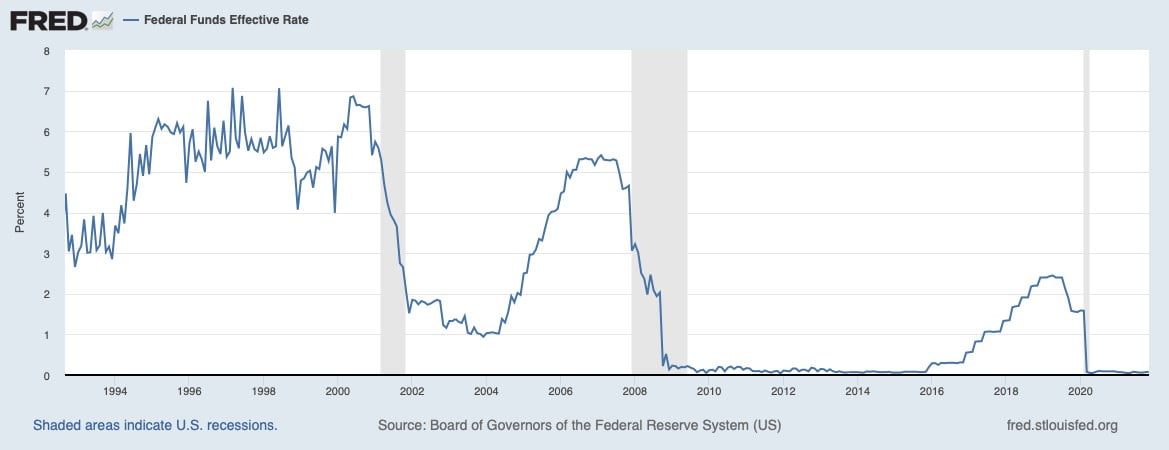
Another reliable indicator that provides an early warning sign that the boom is ending is the stock market going sideways for a length of time even though companies’ earnings are robust. Since the stock market is “forward looking,” investors would in effect be forecasting that the good times are ending and a recession will begin soon. And when the fed funds rate begins to increase and then starts declining, a recession usually begins.
The chart below shows this phenomenon before both the dotcom and housing bubbles burst. And the fed funds rate plunged in early 2020 as the Fed responded to the pandemic, turning the economic implosion into another cyclical upswing.
How long will the current boom last? No one knows for sure, but the economic and financial indicators have an excellent track record of pinpointing the end of the boom and the beginning of the downturn. These indicators should be on every entrepreneur’s radar screen. When the yield curve inverts, raising cash and putting expansion plans on hold may be prudent to navigate the next downturn.
About the Author
Murray Sabrin, PhD, is emeritus professor of finance, Ramapo College of New Jersey. Sabrin was the New Jersey Libertarian Party nominee for governor in 1997 and twice sought the Republican nomination for U.S. Senate. His newly released book is Navigating the Boom/Bust Cycle: An Entrepreneur’s Survival Guide (Business Expert Press, Oct. 5, 2021). Learn more at murraysabrin.com.


