
Mittleman Investment Management investment commentary for the second quarter ended June 30, 2018.
Q2 hedge fund letters, conference, scoops etc
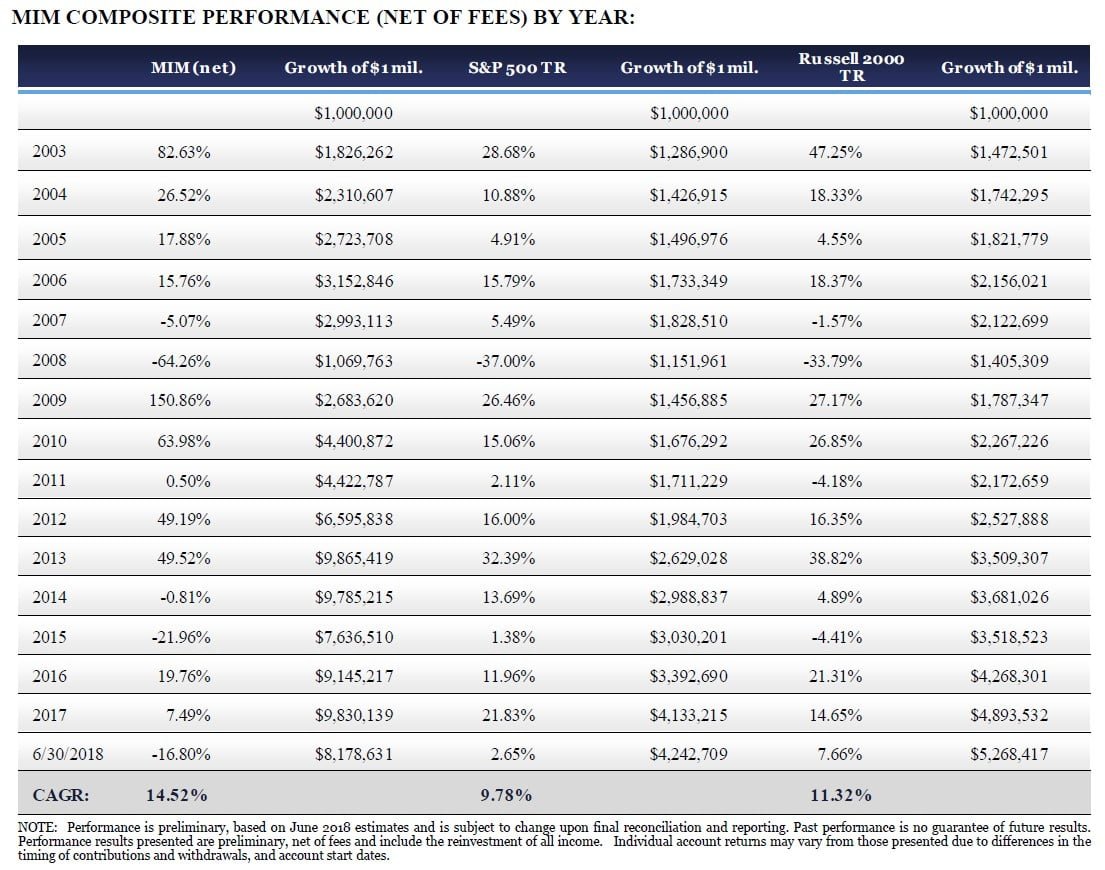
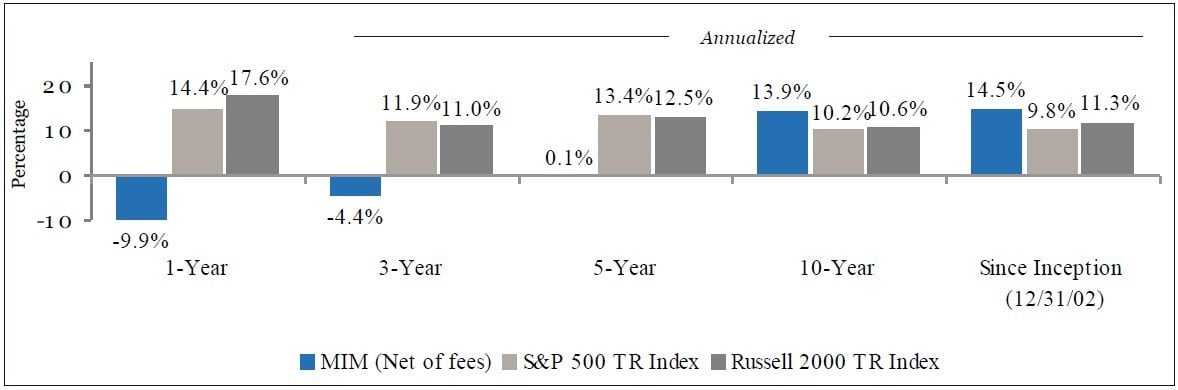
Mittleman Investment Management, LLC’s composite declined 6.3% net of fees in the second quarter of 2018, versus gains of 3.4% in the S&P 500 Total Return Index and 7.8% in the Russell 2000 Total Return Index. Longer-term results for our composite through 6/30/18 are presented below:
Before addressing the positions that contributed and detracted most from our second quarter results, I’ll comment more broadly on our severe under-performance year-to-date, and over the last few years. We hit an interim peak in our performance on August 31, 2014 and our results over the 3 years and 10 months since then have been brutal. And while some other higher profile practitioners of concentrated value investing have suffered similarly through this period, our stocks seem to be close to winning the unpopularity contest among those of our similarly situated value-oriented peers.
Yet, we own an entirely different, more globally diverse portfolio and believe our holdings offer a far superior risk / reward ratio in the aggregate than those held by most of our esteemed peers. More importantly, the more recent stock price declines are completely at odds with the stable and in most cases improving fundamentals and financials of the businesses in which we’ve invested. For example, our emerging markets exposure weighed heavily on our results recently, but with very little justification. Jardine Strategic (JS SP $36.48) was down 7.8% YTD as of 6/30/18, from $39.58 to $36.48. But it’s NAV per share actually rose during that period, from $59.08 to $62.00, at 70% above the quarter-end price. Jardine’s NAV was $35.9B ($62 per share) on 6/30/18 and comprised almost completely of publically traded securities of leading businesses in Southeast Asia, and an NAV per share which has grown more than 20% per year since 12/31/99. KB Financial (KB $46.48), owner of Kookmin Bank, the largest retail bank in South Korea, with huge excess capital (Tier 1 Common Equity = 14.6%), has seen its share price drop 21% YTD from $58.51 on 12/31/17, despite earnings per share on track to grow from $7.35 to $7.53 (P/E ratio = 6) and book value per share at nearly $77 this year. Another emerging market bank we own, Sberbank of Russia (SBRCY $14.36) dropped 16% YTD from $17.03 despite earnings per share on track to grow from $2.36 in 2017 to $2.48 (P/E ratio = 5.9) in 2018. So while the stock prices of almost all of our emerging market holdings have dropped precipitously YTD, the fundamentals for most remained stable, while some improved, so what was cheap already has now become much more so.
As often is the case in value investing, and in our past experience specifically, our prior streaks of significant under- performance have always been followed by a more than offsetting rebound, usually within a compressed timeframe, thus making the wait, and the endurance of the pain, worthwhile. We remain supremely confident that our recent stretch of seemingly too much time spent sowing seeds will be resolved in a similarly satisfying manner once the harvesting season resumes for us.
You’ve been hearing various versions of that message from us for a few years now, and so it’s probably more annoying than it is comforting at this point, but as I’ve pointed out in past investment reviews, we tolerate being very much out of sync with the broader market as we believe doing so leads to a better long term outcome, as has been our actual experience. Even in our much diminished current state of performance, our track record since our composite’s inception on 12/31/02 is 14.52% net of fees vs. 9.78% from the S&P 500 total return index, such that $1M invested with us on 12/31/02 would be worth $8.179M on 6/30/18, versus $4.243M from the S&P 500 over that same 15.5 year time period. And the most recent Broadridge/Lipper ranking available, for the 10-year period ending 3/31/18, has us ranked #3 out of the 416 managers in Lipper’s international/global equity universe (report available upon request).
A relatively new client sent me the following quote from Cliff Asness of AQR which he knew I’d find encouraging and true. Cliff manages at AQR a much larger pool of funds than we do, and he does it with an entirely different set of strategies, but he cites some universal truths here about investment discipline and patience:
“I used to think that being great at investing long-term was about genius. … genius is still good, but more and more I think it’s about doing something reasonable, that makes sense, and then sticking to it like grim death through the tough times.”
“If you have a three year period where something doesn’t work, it ages you a decade. You face an immense pressure to change y our models, you have bosses and clients who lose faith, and I cannot really convey the amount of discipline you need.”
“I’m in a business where if 52% of the days I’m right, I’m doing pretty well over the long-term. That’s not so easy to live with on a daily basis. When I say a strategy works, I kind of mean six or seven out of 10 years or just a little more than half the days. If your car worked like this, you’d fire your mechanic.”
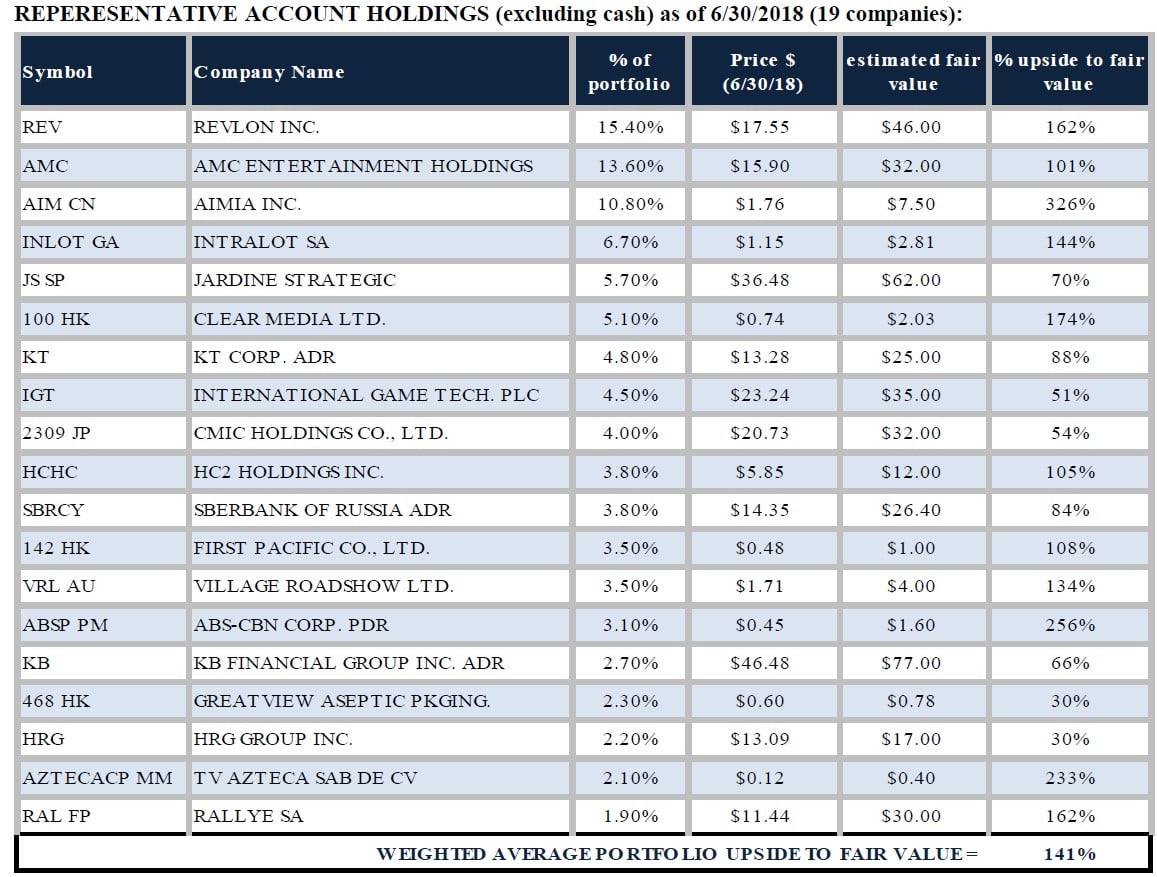
Sticking to it through the tough times is obviously easier said than done. We do so by focusing on intrinsic value, as best we can appraise it, and taking advantage of irrational market pricing, not taking instruction from it. Our holdings are trading, on average, at 9.3x free cash flow vs. the popular indices trading at roughly double that, and comprised of companies with, in general, far less resilient economic characteristics than our holdings possess. The 141% upside potential in the portfolio to reach our appraisal of current fair value is the largest distance away from fair value that our portfolio has traded in nearly a decade. And although we remain focused on the long-term outlook, there are a number of potential positive catalysts for many of our holdings including Revlon, AMC, Aimia, Intralot, Jardine Strategic, HC2, and others that we expect may manifest in the near-term, and that should provide a meaningful boost to our overall performance should they occur.
Contributors/Detractors
The top three contributors to our Q2 2018 performance were Aimia Inc. (AIM CN): $1.34 to $1.76 (+31%), AMC Entertainment (AMC): $14.05 to $15.90 (+15% with dividend), and HC2 Holdings (HCHC): $5.26 to $5.85 (+11%).
We discussed Aimia (AIM CN) at length in our Q1 Investment Review, as it was the biggest detractor from that quarter’s performance. Our two director nominees (Jeremy Rabe and Phil Mittleman) were affirmed to the Board at the company’s annual general meeting of shareholders on April 27th. On May 8th, Jeremy Rabe was named President and Chief Executive Officer, replacing David Johnston, who exited shortly after our nominees joined the board. Jeremy was the founding CEO and a member of the Board of Directors of Aimia’s 49% owned JV with Aeromexico, Premier Loyalty & Marketing, and was responsible for the management of Club Premier, Mexico’s leading coalition loyalty program, from its inception in 2010 through 2014, a period of outstanding growth. He was most recently an Operating Partner with Advent International, a leading global private equity firm where he provided strategic support to portfolio companies including LifeMiles, the loyalty program of Avianca. We are pleased with the recent progress made at the Board and management level and are optimistic that further evidence of success will be forthcoming. Aimia remains one of the most exciting investment opportunities in the public markets today. Our sum of the parts valuation is C$10.00 (USD 7.50), which is 4.25x the quarter-end price:
Aeroplan (Canada): ownership (100%), estimated min. fair value = C$1B, 10x C$100M EBITDA post 2020 = C$6.57 per share (we ignore the C$2B miles redemption liability for purpose of enterprise valuation, as airlines don’t charge frequent flier liabilities to EV in their M&A transactions, viewing it as an ongoing negative working capital benefit as long as business is a going concern, and a substantially reduced cash cost in a liquidation / run-off scenario which we view as extremely unlikely.) Aeroplan likely has strategic value well above our C$1B minimum estimate in that its 5M members and its key commercial contracts occupy a critical role at the nexus of a very valuable ecosystem involving TD Bank, CIBC, Visa, Amex Canada, and Air Canada, which have hundreds of millions of annual profits at stake in preserving it.
PLM Premier (Mexico): ownership (48.9%), est. fair value = US$489M, 10x US$100M EBITDA est. 2019 = US$3.21 per share 5.3M members in fast growing coalition loyalty program anchored by Aeromexico, Mexico’s flagship airline. Aimia invested US$124M for a 48.9% stake between 2010-2012, and since then received US$84M in cash dividends. At last financing round in 2012, PLM total enterprise was valued at US$518M, and it has grown substantially since then. Comps are Smiles Fidelidade S.A. (SMLS3 BZ) and Multiplus S.A. (MPLU3 BZ) and trade at 8x to 6x EBITDA recently, down sharply in emerging market sell-off, but fair value likely closer to 10x EBITDA for both.
Cardlytics (CDLX): ownership (2.978M shares), price on 6/30/18= $21.76 = USD 65M = US$0.43 per share
Think BIG Digital – Air Asia: ownership (20%), estimated fair value = USD 50M, US$3 x 16M members = US$0.33 per share
Air Miles Middle East (U.A.E.): ownership (100%), estimated fair value = 0, 1.4M members
Fractal Analytics (NJ, USA): ownership (5%), est. fair value = US$18M (5% of $360M (6x $60M sales) = US$0.12 per share
Assets (excluding cash) = C$1.817B = C$11.93 / US$9.07 per share
(+ cash & bonds C$500M – C$45M working cap. need– C$329M debt – C$43M pension deficit – C$323M preferred – C$34M accrued interest) = -C$274M
NAV: = C$1.543B / US$1.157B / 152.3M shares = C$10.13 / US$7.60 per share (CAD/USD = 1.31 as of 6/30/18)
AMC Entertainment (AMC) was our second best performing stock of Q2, but the move up was surprisingly muted given the explosive rebound in the box office. Q2 2018 saw box office receipts soar to an all-time record, not just for any Q2, but for any quarter in history, putting the box office up 9.6% YTD through 6/30/18, and making 2018 the first year to surpass the $6B total box office mark so quickly. All of which should again make the bear thesis that the movie theater business is a dying industry seem that much more flimsy. To put it in the simplest perspective, AMC dropped from $35.50 on Dec. 31, 2016 to $10.80 on Nov. 17, 2017 as the box office declined 2.7% last year. This year, the box office is up 9.6% YTD and breaking all-time records again, and yet AMC is only back up to $15.90, with a nearly 20% FCF yield, and a 5% dividend yield. AMC is also benefitting from share buybacks, cost cutting efforts, and non-core asset sales that have reduced leverage. The company introduced a sustainably priced subscription option to compete with the unsustainable offering from Moviepass. Its AMC Stubs loyalty program reached 15M members, up from 2.5M members just over 2 years ago when CEO Adam Aron revamped the program. The company also said that it was considering an IPO of its European division in London as valuations for movie theaters in Europe are generally much higher than in the U.S., offering an attractive deleveraging option. And yet with all of this, AMC’s share price has recovered less than half of what it lost in 2017, while nearly 30% of the float remains short. Why? It’s hard to imagine, but in spite of the box office hitting new records almost every 2-3 years, there remains a large contingent of investors who believe the box office is dying because they enjoy watching “The Crown” at home on Netflix, as if Netflix dooms the theater business any more so than Blockbuster Video and the VCR did in the 1980s. There were congressional hearings in 1982 over whether or not the VCR would destroy the studios and/or advertising on free TV. Those concerns were wrong then, and we believe they are wrong now, and that the numbers speak for themselves, and the stock will not be able to stay this low for much longer, as we look for $32 per share in fair value (9x EBITDA of $950M, 12x FCF of $350M), up 101% from the current price of $15.90.
HC2 Holdings (HCHC) on May 2nd announced the sale of BeneVir BioPharm, a developmental-stage biotech company focusing on oncolytic viral immunotherapy, in which HC2 held a 76% stake. HC2 paid just $8M for its stake in BeneVir, which we were using in our estimates of NAV. This transaction provided a net of $85M in cash at closing to HC2, plus additional contingent payments of up to $900M based on achievement of certain predetermined milestones. The up-front cash component alone increased HC2’s NAV by nearly $2/share (raising our estimate from $10 to $12/share), without handicapping the likelihood of the future milestone payments coming in from the acquirer, Janssen (a pharmaceutical company owned by Johnson & Johnson). To put into perspective the full value creation that would take place in the event those milestones were achieved, $900M represents an additional $17 per share in value to HCHC holders (vs. a current price of $5.85), the receipt of which would be spread out over many years. We believe there are additional monetization opportunities within HC2’s business mix, of similar or greater size than Benevir. Management has also expressed their intent to lower their cost of capital through a global refinancing of their $510M of 11% debt due 12/1/19, which should produce significant savings on interest expense, and possibly allow for share buybacks. We are optimistic that investors will soon begin to appreciate that the current NAV, coupled with the significant upside of many of its holdings, warrants a much higher stock price.
The three most impactful detractors from our Q2 2018 performance were Revlon (REV): $20.60 to $17.55 (-14.8%), Intralot (INLOT GA): $1.41 to $1.15 (-18.4%), and Village Roadshow (VRL AU): $2.39 to $1.71 (-28.7%).
Revlon (REV) dropped further after missing Q1 2018 estimates released on May 10th. While there were plenty of good data points to recognize, such as 25% growth in online sales, 25% growth in China, and 25% growth in the travel (airport) sales channel, along with continued growth from their Elizabeth Arden business and international sales in general, a botched transition to SAP software at their main manufacturing facility in Oxford, NC caused major disruptions in shipments and a significant loss of sales. They claim the problem has since been solved, and shipments are back to normal now, but the misstep compounded the negative sentiment around the shares from the lingering worries about domestic demand. A seemingly endless revolving door at the CEO level probably stops now as Revlon appointed its first ever female CEO in the company’s 86 year history on May 23rd, but news that it was Ron Perelman’s 44 year-old daughter, Debra, caused understandable concern. She has worked at Revlon and with the parent company since 1998, but with no discernible track record at the C-suite level. Nepotism doesn’t always lead to bad outcomes, but it does add an element of uncertainty until we can get a sense of her competence and game plan, which we will get a glimpse of when Revlon reports Q2 results on Aug. 3rd.
Historical analogy time: I remember when iconic value investor Jean-Marie Eveillard of First Eagle Mgmt. bought McDonald’s stock at $25 in 2002 (already down from a high of $49.56 in December 1999), and then was buying more at $12 in 2003 (-75% from interim peak 3.25 years prior), and talking in the press about a $30 price target. I considered it then and passed because I thought the headwinds of a clear trend towards healthier foods would be long-lasting. I went so far as to go the McDonald’s nearest my office which was in the underground part of the Rockefeller Center complex around 47th St. & 6th Ave. to check out the place. I found it filthy and with many shady characters strewn about the seating area; with inattentive cashiers. And so based on that rudimentary channel checking, and constant bombardment in the press about the shift away from fast-food to health-food, I thought the sales declines they were seeing in Japan and the core U.S. market over the prior two years might be more chronic than transitory. The trend towards healthier, more expensive food options not only persisted but it accelerated dramatically, and yet MCD’s stock hit Jean-Marie’s target of $30 one year later in 2004 (shortly after they began the “I’m Lovin’ It” ad campaign in 2003, and despite the release of the damning documentary “Super Size Me” in 2004 which showed the devastating effects of eating only McDonald’s food for one month), and today it’s $158 per share. EBITDA, which had dropped 26% from $4.3B in 1999 to $3.2B in 2002, more than fully recovered to $4.7B by 2004, and was $10.2B in 2017. Rating agency Standard & Poor’s downgraded McDonald’s $10B in debt in early 2003, citing “Standard & Poor’s does not believe that McDonald’s will be able to regain its former stature for the foreseeable future.” It only took a year for them to be proven wrong. So when short-sellers say Revlon is hopelessly behind the trend towards more expensive, more natural make-up, I’d say they are forgetting about the resilience and adaptability such enduring global brands have shown over many decades.
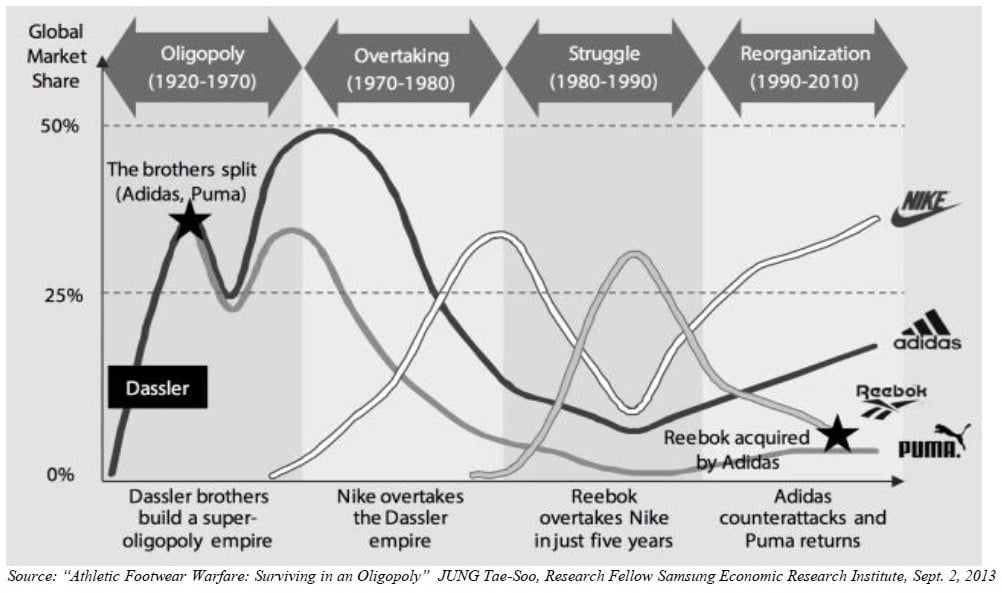
The sneaker market provides another useful analogy. There was a period (late ‘90s, early ‘00s) in that industry, much like cosmetics today, when new entrants and a shift in preferences challenged the market leaders. If you were unlucky enough to had bought Nike’s stock (NKE) at an interim peak of $9.55 in March 1997, it hit $3.23 (-66%) by March 2000, while the Dow Jones climbed from 7,000 to 11,235 (+61%) over those same 3 years. But by March 2008 NKE was as high as $17.65, (DJIA 12,600) and today NKE is $76.59 (DJIA 25,200). Adidas (ADS GR) had an even worse drop, from €42.31 in June 1998 to €11.50 (-73%) in Sept. 2001 in just over 3 years, and now it’s €189. Puma (PUM GR) dropped from €33.76 in March 1997 to €11.65 (-66%) in March 2001 over 4 years, today it’s €499.
Revlon’s interim peak of $41.67 occurred in April 2015, today it’s $16.60 (-60%) after 3.25 years. Its closest comp, Coty (COTY) peaked at $32.20 in July 2015, and today is $13.78 (-57%) over 3 years. And newcomer to the mass market color cosmetics space, e.l.f. Beauty, Inc. (ELF), dropped from a high of $32.54 in Nov. 2016, to $15.33 (-53%) today. Unless the U.S. mass market for color cosmetics is truly in secular decline (we think not), the multi-decade proven players (Revlon and Coty (Cover Girl, Rimmel)) should rebound sharply. And even if the mass market here continues to lose out to the ongoing trade-up (premiumization) trend for another 5 or 10 years, that segment of Revlon’s overall sales has already been reduced to less than 30% of total company sales, and 50% of sales are from still growing international markets.
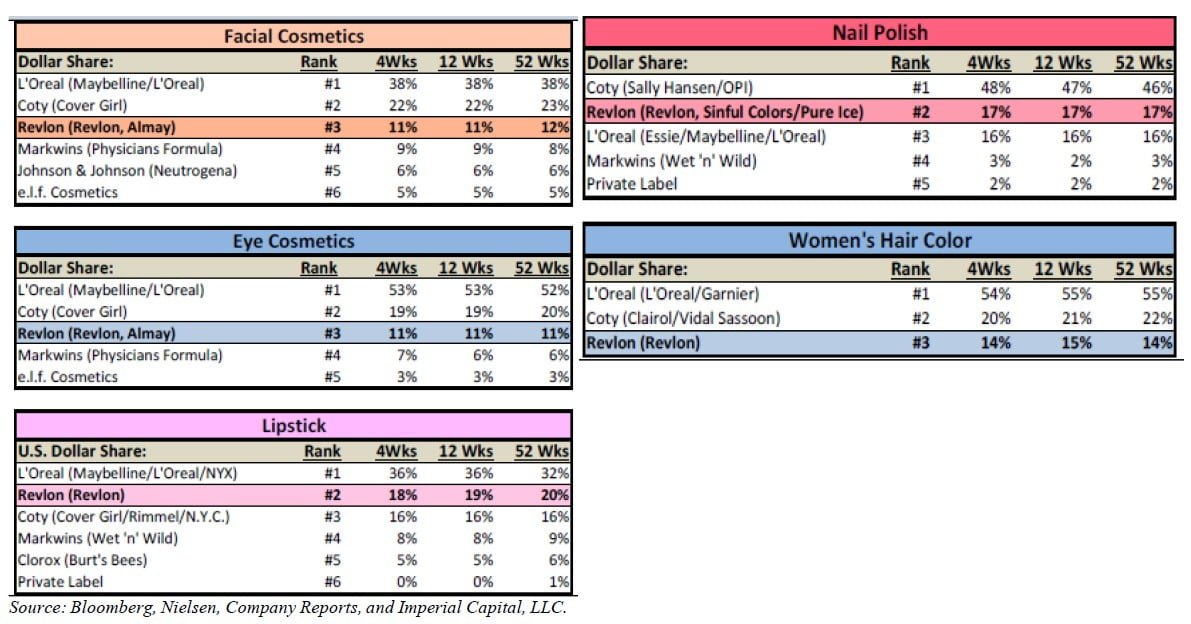
You can replace Nike, Adidas/Reebok and Puma in the following graphic with L’Oreal/Maybelline, Cover Girl, and Revlon to get a vague sense of the long term shifts in market share (for color cosmetics in the U.S. mass market), but also the endurance of these core brands and the wisdom of investing in them when they’re down. I couldn’t find a chart to show this graphically but Cover Girl was #1 in the 1980s, Revlon took the lead by the mid-1990s (market share jump from 11% in 1990 to 20% in 1995), and L’Oreal / Maybelline took the #1 spot shortly thereafter and has retained it ever since. I bought Maybelline’s stock (symbol was MAY back then) around $17 in late 1994 /early 1995 (down from $30+) when Maybelline saw declining sales as Revlon was ascending to #1. I had read about it in a newsletter that highlighted insider buying in the upper teen price range by Wasserstein Perella, the LBO fund that was Maybelline’s largest shareholder. I sold it in the low $30 in late 1995 on rumors of a takeover putting the stock at my estimate of fair value, only to see it soar nearly 35% higher still when it was bought out by L’Oreal in a behind the scenes bidding war with Benickser AG (now Coty) for $44 per share only a couple of weeks later in Jan. 1996. The point being, enduring brands generally bounce back.
Of course, not all brands endure indefinitely. Schaefer Beer, founded in 1842, became the 5th best selling beer in the U.S. by the time it went public in 1968, with the catchy jingle in their commercials “Schaefer is… the one beer to have when you’re having more than one…” Well, not anymore. So no level of market share held for any amount of time guarantees a brand a future, but we’re pretty confident that, back to the sneaker analogy, Revlon is no L.A. Gear ($70M sales in 1987, $819M in 1990, $196M in 1996, stock price $2 to $50 to $0), but the various Kardashian-branded cosmetic lines might be. Young celebrity-branded fragrances went up big for a while and came right back down not long after in 2015, so it wouldn’t be a surprise to see the same thing happen in color cosmetics, with too many new entrants, many based on the personal popularity of an individual celebrity, a shake-out seems inevitable.
The cosmetic industry is all about prestige brands today, and while Revlon has prestige exposure since buying Elizabeth Arden in late 2016, its growing (sales +10% in Q1) but only 35% of total sales. At some point in the next five years a recession is likely to occur (given we’re already closing in on an all-time record for expansion) and the mass market should reclaim some market share (via consumer trade-down known as the “lipstick effect”) that the prestige market has taken over the past few years. Regardless, with much better distribution now in specialty stores like Ulta (expansion roll-out completed in April) and online, I think Revlon can reach $3.1B in sales in 3 years (a 4.7% CAGR from $2.7B currently), and EBITDA margin should recover substantially to 16% (currently 10%, peak was 21%), so that’s roughly $500M in EBITDA, which should convert $200M to FCF. At 13.3x EBITDA and 20x FCF the stock would be $75 per share then, 4.6x the current price of $16.30, and a 66% CAGR over each of the next 3 years.
Revlon maintains meaningful market share positions is all color cosmetics categories and hair color. We had heard rumors that Beiersdorf AG (BEI GR) bid on Revlon in early 2016 but walked away over price. That they might be interested is no surprise, as Beiersdorf (maker of Nivea and La Prairie skin care products, among other personal care lines) is sitting on $5.2B in net cash, just about the amount needed to buy-out Revlon at $42 (2x sales of $2.7B). I would also suspect that Johnson & Johnson (JNJ) might be interested, in that they could combine their mass market leading skin care business (Neutrogena, for which they paid 19x EBITDA and over 3x sales in 1994) with a stronger player in color cosmetics, where they have much lower market share.
A buy-out of Revlon would be less than ideal because it would deprive us of the longer term upside, but it wouldn’t be a terrible outcome either if it achieved no less than 2x sales, which is $42+.
Intralot (INLOT GA) saw its stock fall 18% in Q2 for reasons mostly unrelated to its business operations. At first, a Greek online news service wrongly tied the company to a short-seller’s report on FF Group (FFGRP GA) which owns retailer Follie Follie and with which Intralot has no connection whatsoever. That caused instant and severe panic selling. The short-seller himself claimed he had no position or report to issue on Intralot, and yet the stock did not fully recover, despite aggressive stock buyback activity by the company, and significant insider buying. Beyond that, it was weakness in the emerging markets where Intralot does significant business that weighed on the stock for the remainder of the quarter. In particular, their operations in Turkey and Argentina were affected by currency weakness in those countries. Intralot is bidding on the Pennsylvania State lottery contract, with the results due soon. Although not part of our fair value estimate, a win there would likely increase their U.S. EBITDA by a very large amount. In addition, they are actively considering doing an IPO for their U.S. division, and we would expect an 8x to 10x EBITDA valuation whereas in Greece the Intralot parent company trades at 5.5x EBITDA. We think the timing for an IPO of their Intralot USA division couldn’t be better given the recent legalization of sports betting here, a business where Intralot already has major scale and should win some significant contracts here.
Village Roadshow (VRL AU) is the largest theme park operator in Australia, and also a movie theater chain. There was a fatal accident at a water park called Dreamworld (owned by Ardent Leisure, AAD AU) in October 2016, and a huge drop in theme park attendance ensued, for all Australian operators. We started buying Village Roadshow in Q1 2017, at half the price it was a year and a half prior, with the simple expectation that theme park attendance would revert to normal within a reasonable time frame, and the stock appeared too cheap if that were to be the case. Nearly a year and a half later, the attendance is still way off, and the stock is half of what we initially paid. We’ve bought more recently to lower our average cost and take advantage of a now truly extraordinary level of undervaluation for such a well-positioned collection of businesses. Theme park attendance should eventually recover and they have interesting growth opportunities in Asia as well as the exclusive franchise for Top Golf in Australia, the first of which they just opened in June: https://topgolf.com.au/
Australia is a prime destination for Chinese tourists, and that is reflected in the valuation of some of the more obvious tourism-related businesses like Sydney Airport (SYD AU A$7.05) near its all-time high with an EV/EBITDA valuation of 17.6x on 2019 estimated. Our Village Roadshow (VRL A$1.86), having just completed a rights offering at A$1.65 in which the 41% controlling shareholders (Burke & Kirby) fully subscribed by investing a further A$21M into the shares, as did we for eligible institutional shareholders, trades at barely 5x EBITDA (2019, calendar estimated). We felt the rights offering was unnecessary as the company had already substantially deleveraged through asset sales (sold their theater ops in Singapore for 10x EBITDA, and did some sizable sale/leasebacks of land under their theme parks), but I was informed that Australians have a more conservative view of what constitutes an appropriate leverage ratio and they wanted to be extra cautious given their expansion plans with Top Golf. In any case, we see the shares nearly tripling from current level to get to our estimate of fair value, a target valuation of only 9x EBITDA and 14x FCF. Ardent Leisure (AAD AU A$2.05) despite being the cause of the accident that disrupted the industry so severely down there, is already trading at 10x EBITDA now.
In conclusion
We cannot achieve success without the continued support of our client base, and we appreciate the patience you have shown in the face of seemingly constant reminders of “easy” money being made in tech stocks, growth stocks, crypto-currency, and the like. It’s been encouraging to us that some clients have taken notice of the opportunity set either by adding to their existing investments in our strategy or initiating a new allocation. In fact, since our last interim peak in performance 8/31/14, through 6/30/18, nearly four years of extreme under-performance has transpired and yet we’ve received net inflows of $38M. That is extraordinary when you consider other higher profile value-oriented investment managers experiencing similar bouts of underperformance have seen massive, multi-billion dollar outflows over that same period. I think it’s a testament to the extraordinarily high-quality of our client base. A European value investor with a great long-term record met with us recently to consider investing with us as their strategy is essentially at capacity, and he said that his success was 50% due to stock selection and 50% due to client selection, and we couldn’t agree more.
As happens rarely, but then again, often enough, we find disparities between market price and fair value in many of our holdings to be astonishing. It is frustrating to see such mispricing persist for so long, but at some point fair value usually gets expressed in the stock price. We know we must be wrong about some of them, because probability and history argues so, but we can’t tell which ones will prove to be mistakes as of yet. That said, we’ve been right much more than we’ve been wrong over the 15.5 years and nearly 100 stocks that we’ve owned during that time, and thus the long-term track record you see on the next page.
Thank you again for your trust and patience. Sincerely,
Christopher P. Mittleman
Chief Investment Officer – Managing Partner
Mittleman Investment Management


