
In investing, there are 2 schools of thoughts about risk:
- The volatility school that views variance as risk.
- The permanent loss of capital school that views risk as a permanent reduction of the amount invested.
The volatility school has strong academic credentials. This branch of finance theory has developed to a stage where you can numerically bring risk into the investing process.
Risks have been classified into systemic and non-systemic and proponents have shown how you can trade off between risks and returns. You can also bring risk into your valuation by using the Beta.
Q2 2022 hedge fund letters, conferences and more
Unlike the volatility school, there is a dearth of literature on managing permanent loss of capital. And in many instances, it is about why volatility should not be considered as risk rather than how to assess permanent loss of capital.
At the same time, all the discussions on risk as permanent loss of capital are qualitative. As such, it is very challenging to determine whether all the risks measures adopted are sufficient.
This article is an attempt to fill this void. It is base on both my value investing experience as well as my corporate risk management experience.
There are 3 stages to this risk management framework:
- Identifying the possible causes that can lead to a permanent loss of capital.
- Assessing the threats.
- Mitigating permanent loss of capital involving avoiding, accepting, reducing, or transferring risks.
Possible Causes For Permanent Loss Of Capital
I used an Ishikawa diagram to help identify the root causes that can lead to a permanent loss of capital. There various causes were based on my personal experience as well as a literature search on how others have suffered losses.
| Notes
An Ishikawa diagram shows the causes of an outcome and is often used in manufacturing to show where quality control issues might arise. It is sometimes referred to as a fishbone diagram. It resembles a fish skeleton, with the “ribs” representing the causes and the final outcome appearing at the head of the skeleton. In such a diagram:
|
To suffer a permanent loss of capital, the investment has to be sold at a price that is lower than the buying price. For simplicity, I will ignore the situation where the investment has been sold due to short term volatility. From a value investment perspective, this is unlikely to happen.
I then grouped the various causes into 4 main ones:
- Deterioration in the intrinsic value due to changes in the fundamentals – both macro and micro.
- Issues with portfolio construction.
- Wrong assessment of intrinsic value in the first place.
- Stock market changes due to regulatory changes.
These are the main direct causes and there are other root causes for each of them as shown in the Ishikawa diagram. Refer to Chart 1.
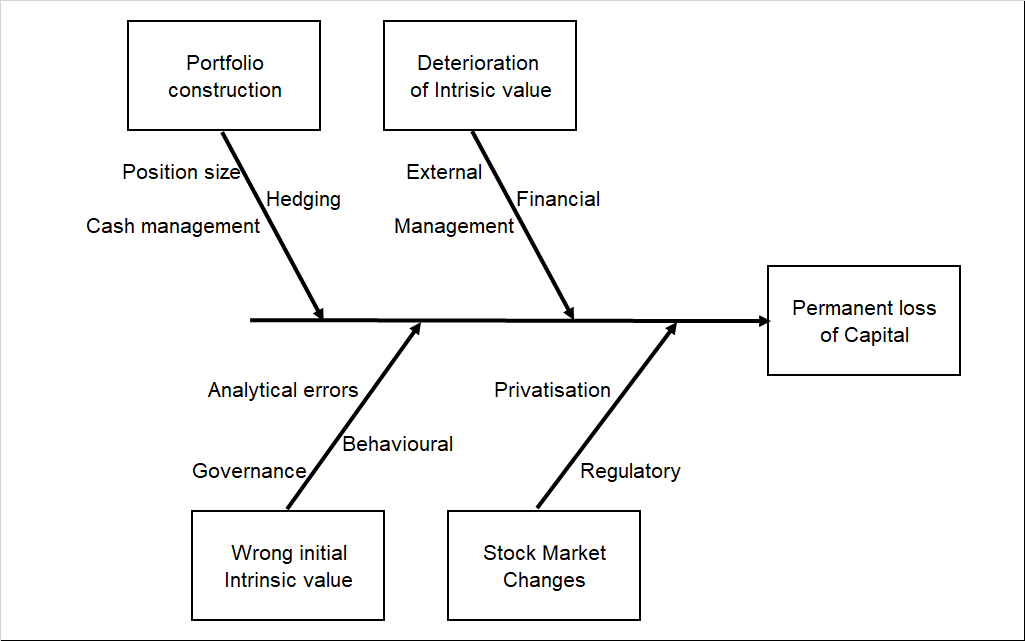
Chart 1: Cause and effects on how to incur a permanent loss of capital
The details of each of the root causes for the boxed items in the Ishikawa diagram are presented below.
Deterioration of intrinsic value
The intrinsic value of a company could decline over time. Over the long term, the market price will decline to reflect this.
- Management could be the cause of the decline. This could be adopting the wrong strategy or plainly incompetent.
- Financials – if the company has debt, there could be changes to the loan situation that affect its profitability or cash flow.
- External – this covers all the social, political, economic and technology changes that negatively impact the company.
Portfolio construction
- Position size. This relates to the number of stocks in the portfolio and the amount to be allocated to each stock.
- Cash management. From an individual investor, if you don’t have cash for emergencies, you could be forced to sell your shares at the wrong time.
- Hedging refers to other strategies of guarding against risk.
Wrong initial intrinsic value
The assessment of intrinsic value is the heart of value investing. If this was wrongly assessed at the start, the purchase would be a mistake that would be realized much later.
- Governance. The intrinsic value is generally assessed based on the financial statements. If there are issues due to the poor quality of earning or even creative accounting, the computed intrinsic value would be wrong.
- You could have made some analytical errors in assessing the intrinsic value.
- Your behavioural biases can skew your estimates of intrinsic value.
Stock Market Changes
- Privatization – you are sometimes forced to sell at below your purchased price due to a privatization exercise
- Regulatory – these relate to rules that affect the availability of the stock eg trading restrictions. There is a “feedback loop” here. If the business deteriorates there is a higher likelihood of some listing guidelines that may affect its liquidity.
The above Ishikawa diagram shows the first level cause-and-effect. You can have a second or even third level cause-and-effect diagram for the more complex cases. For example, in the case of the External factors, you could further break it down into different economic or social factor.
Assessing The Threats
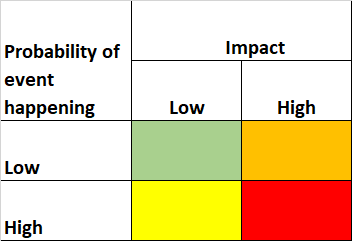
The goal of threat assessment is to evaluate the likelihood of occurrence of each of the threats and the impact.
I classify each cause in the Ishikawa diagram into one of the following 4 coloured cells based on the assessment of its impact and the likelihood of it occurring as per the matrix below.
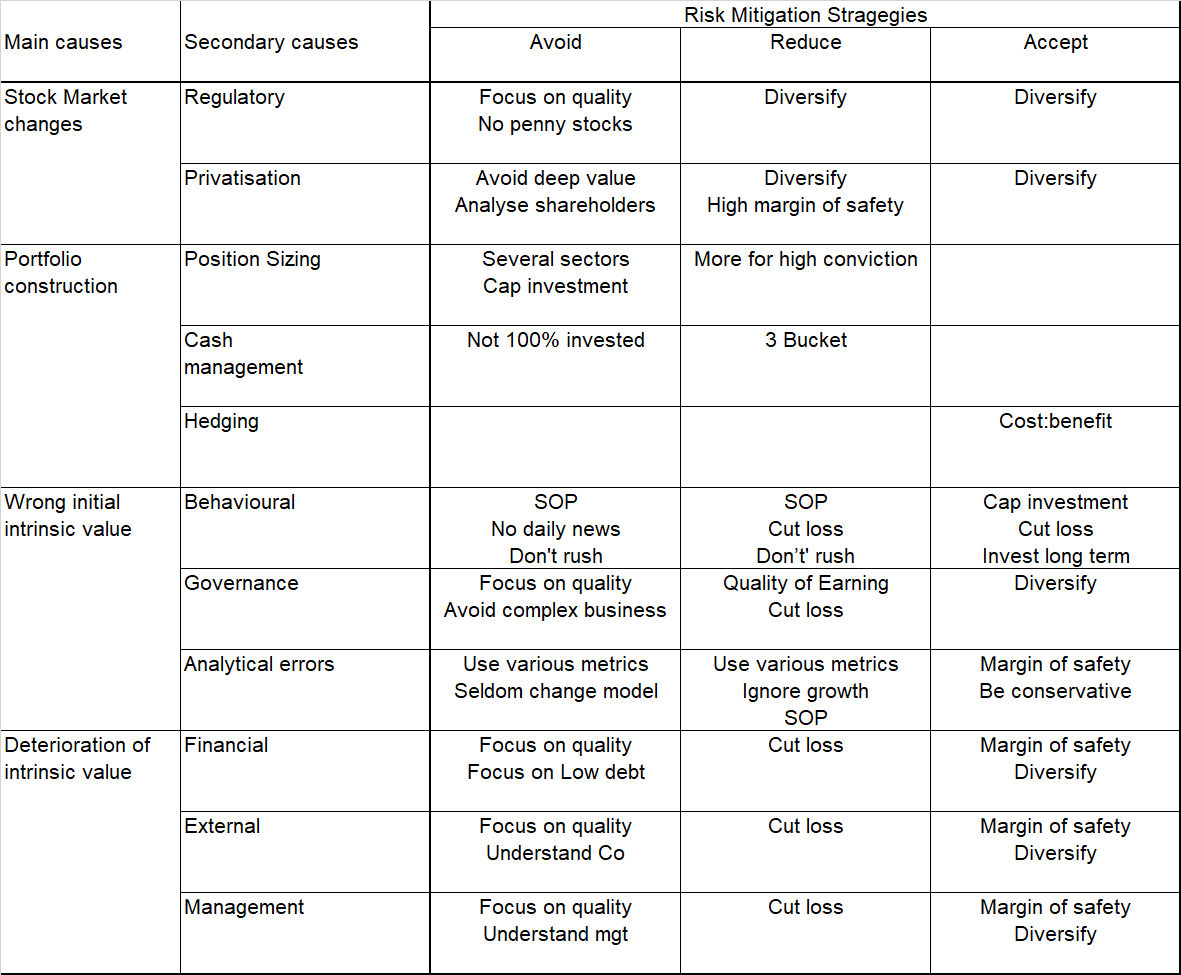
Chart 2: Threat assessment matrix.
Determining the likelihood of the cause is a judgement call based on your own investing experience.
Over my investing life, there have been several occasions where I have suffered a permanent loss of capital. I have then my used this experience to classify the various causes into “high” or “low” probability ones.
If you don’t’ have sufficient experience with bad investments, I would suggest that you play safe and classify a cause as “high probability” if you are not sure.
When it comes to assessing the impact, I think along the following lines:
- If it impacts the whole portfolio, I classify it as “high impact”.
- If it affects a single stock, then I look at the consequences. If it can wipe out the whole investment, I classify it as ‘high impact”. If it only reduces a small % of the investment, I classify it as “low impact”.
For example, I would consider a deterioration in the intrinsic value due to poor management as a “high impact” one. For my investment process, the following fall into the red cells:
- Deterioration in the intrinsic value – poor management.
- Wrong initial intrinsic value – behavioural.
- Stock market changes – privatization.
Risk Mitigation
The idea of slotting the various risk into the 4 cells is because it will help you identify the risk mitigation measures. There are costs associated with each of these mitigation measures so it is important to have an idea of which cell a particular risk falls into. Generally
- I would “Accept” the risks that fall into the green cell.
- I would “Avoid” or “Transfer” the risks that fall into the red cell.
- I would “Reduce” or “Transfer” the risks that fall into the orange cell.
- I am ambivalent on what to do when it comes to the yellow cell.
Given the various items that can lead to a permanent loss of capital, the risk management approach is to identify various measures to handle them. The table below summarizes the various measures that I have adopted categorized into:
- Avoiding the threats.
- Reducing the likelihood or impact of the threats.
- Accepting the threats.
You will notice that some measures cut across several risk mitigation categories. At the same time, to transfer some of the risks, I have some of my net worth invested in bonds and properties. These have a different risk profile than those of stocks.
Furthermore, if you view the threat as a function of both the likelihood of the event and the impact of the event, then depending on the nature of the threat,
- Some of the measures focus on the likelihood.
- Some focus on the impact.
- Some cover both likelihood and impact.
Discussions
The risk management process involves the following steps:
- Identify the causes that can lead to the risk.
- Assess the impact and the likelihood of the occurrence.
- Adopt the mitigation measure to manage the risk.
I have used the fishbone diagram to frame the various cause-and-effect. I would hasten to add that you may have your own way to frame them.
The point is not to debate who has the better fishbone. The fishbone diagram is a means and not the end. The most important thing is that it provides you with a framework to think about the risks.
My threat assessment is very qualitative. In theory, it is possible to assign a score to each cell so that we can have a quantitative assessment. However, there are two challenges to such a quantitative assessment.
- How do you validate the score assigned to each of the cells?
- How do you weight the individual threat items to derive an overall score?
The question is whether such a scoring method would provide any useful information compared to a visual assessment. As such I have continued to use the qualitative approach.
The risk mitigation measures you adopt will of course depend on your own situation. But I hope that this framework provides a way to ensure that you have mitigation measures to cover all the ways you can suffer a permanent loss of capital.

Editor’s Note: The article is from H.C. Eu who blogs at Investing for Value. He is a self-taught value investor and has been investing in Bursa Malaysia and SGX companies for more than 15 years. He has recently published a value investing book “Do you really want to master value investing” on Amazon. This is going to be available for free download on 13 Sept 2022, Pacific Date Time.


