
Logica Capital commentary for the month ended July 2021.
Q2 2021 hedge fund letters, conferences and more
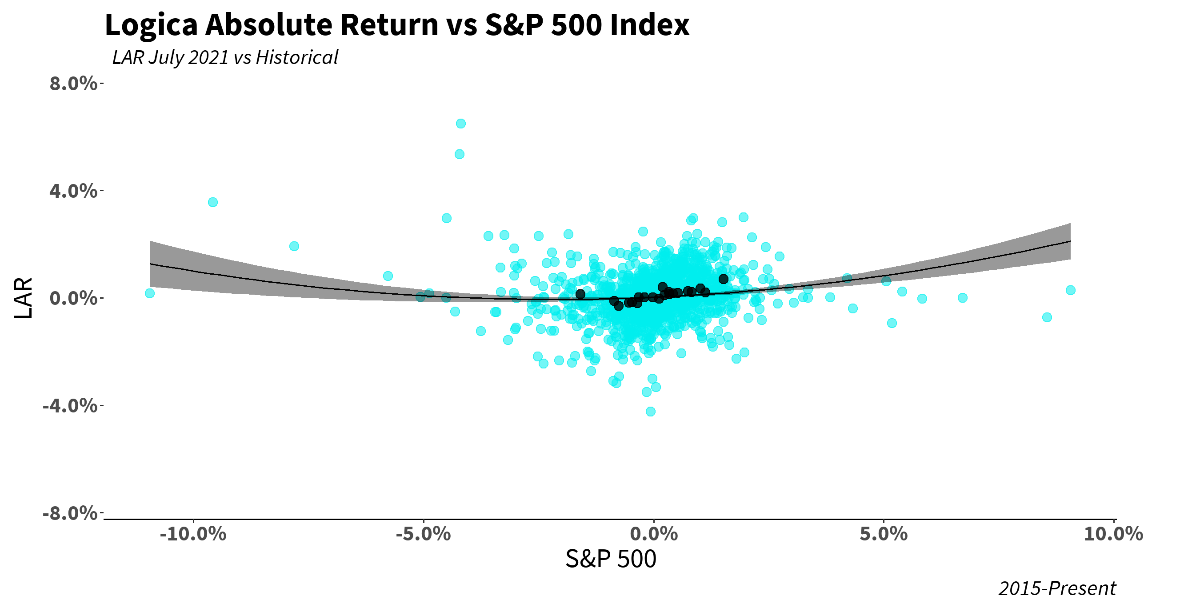
Logica Absolute Return (LAR) – Upside/Downside Convexity – No Correlation
- Tactical/dynamic balanced Put/Call allocation – Straddle
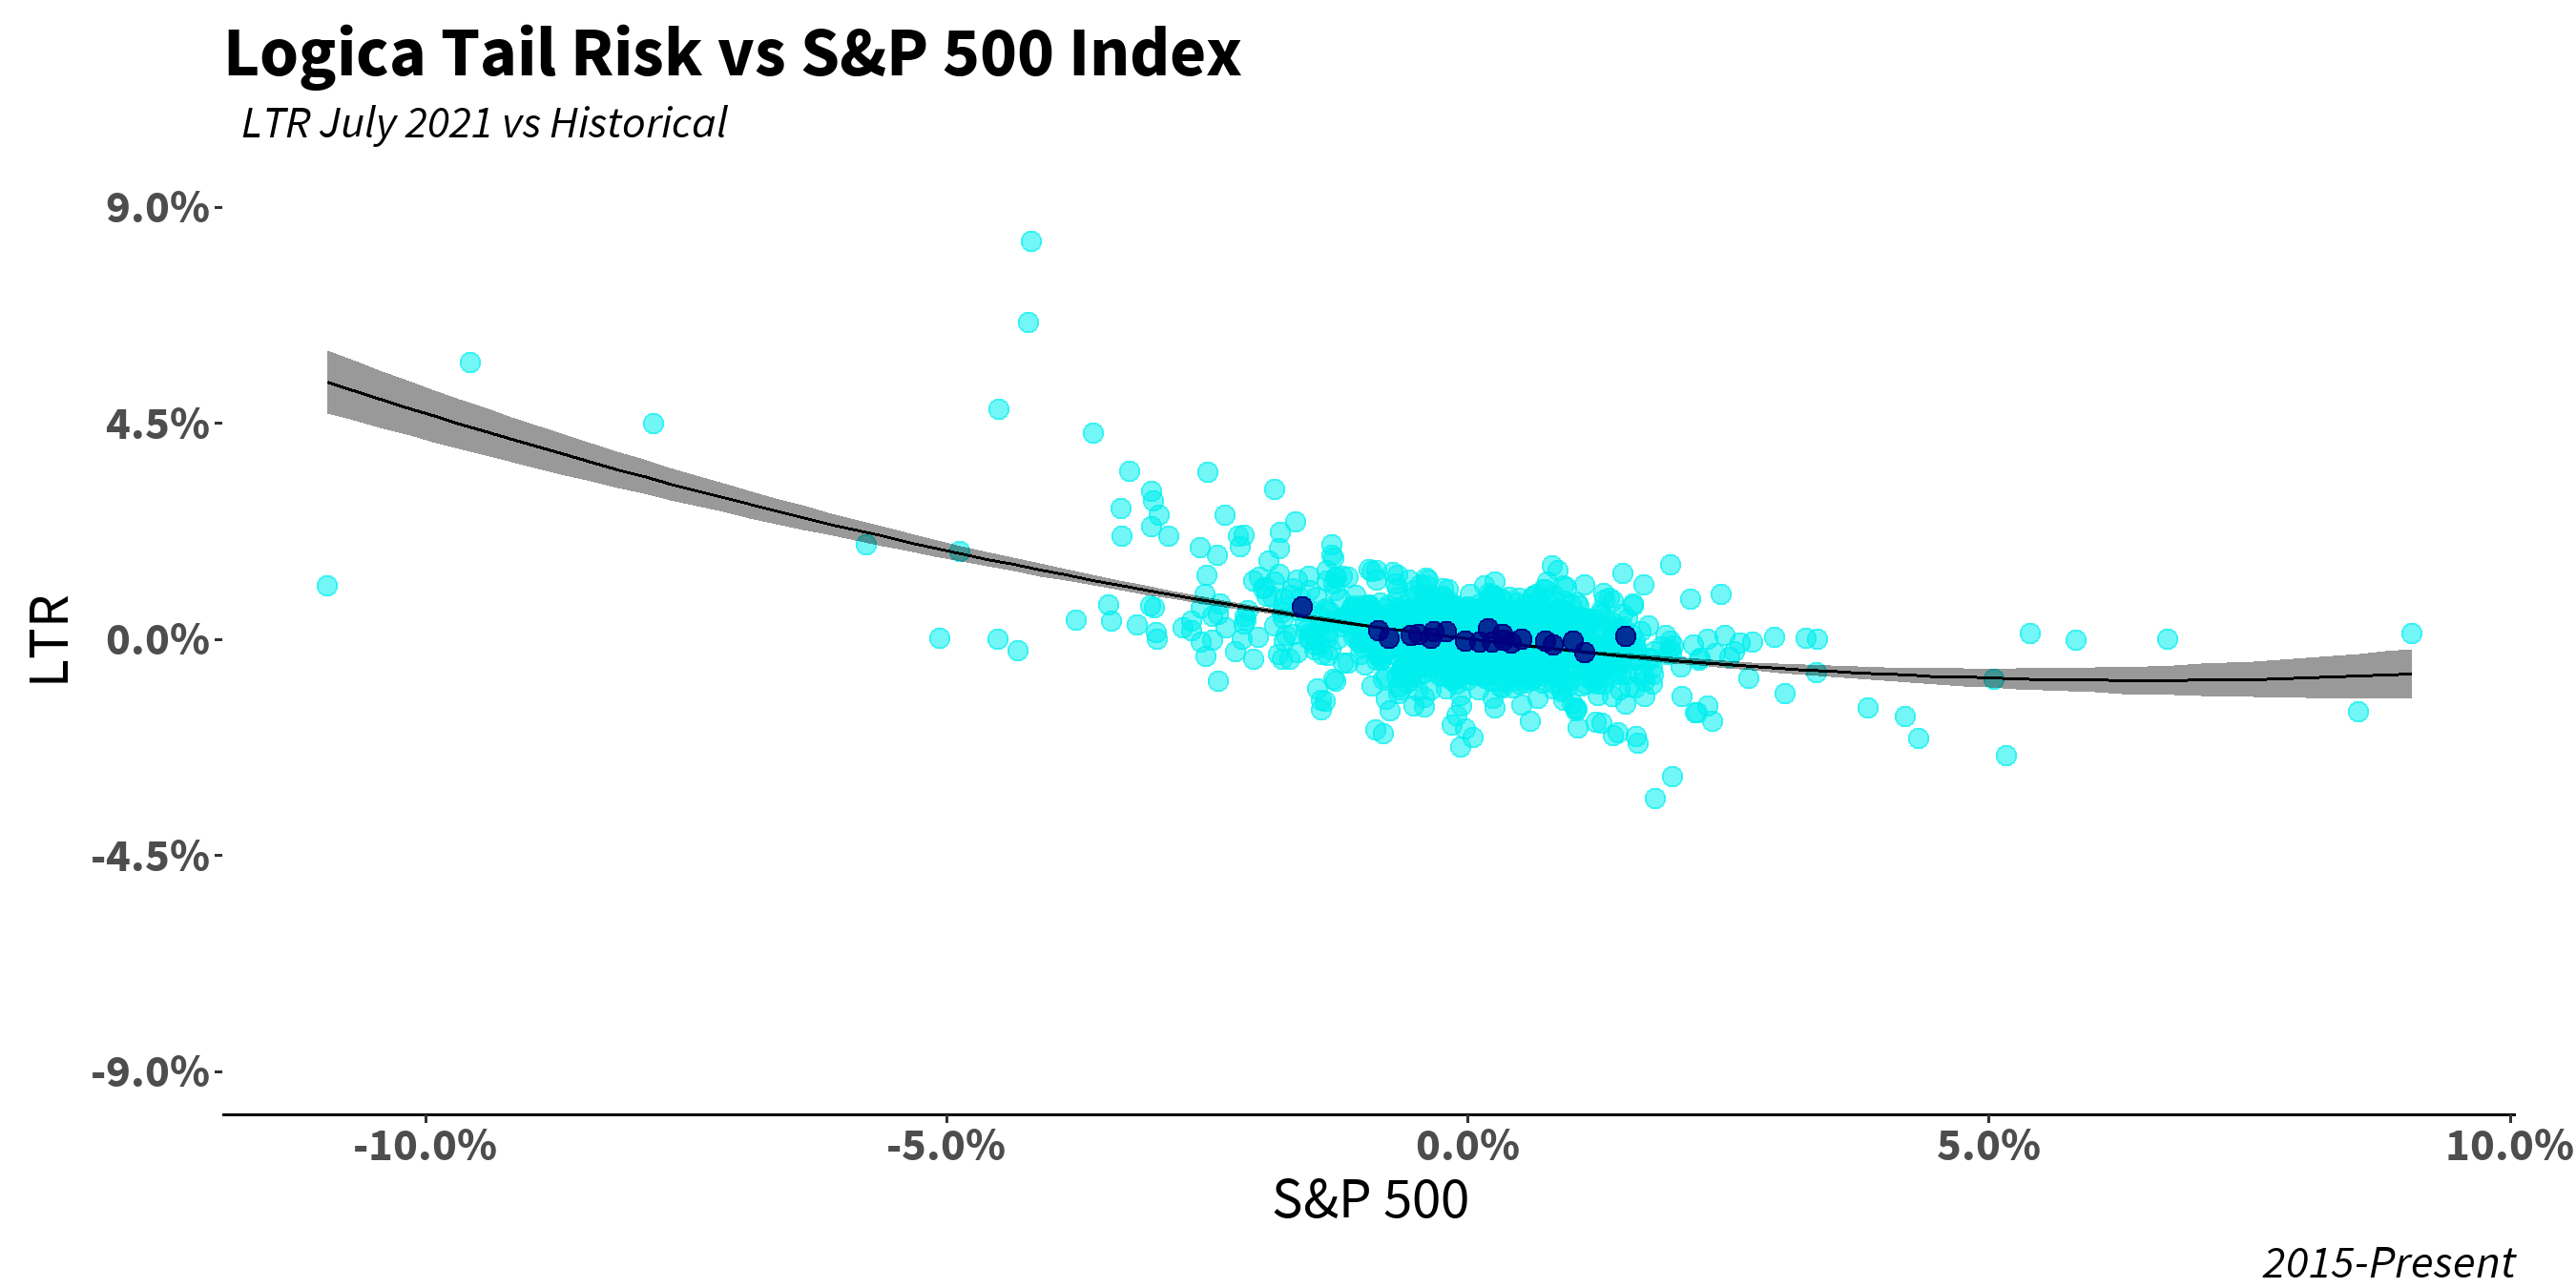
Logica Tail Risk (LTR) – Max Downside Convexity – Strong Negative Correlation
- Tactical/dynamic downside tilted Put/Call allocation – Ratio Straddle
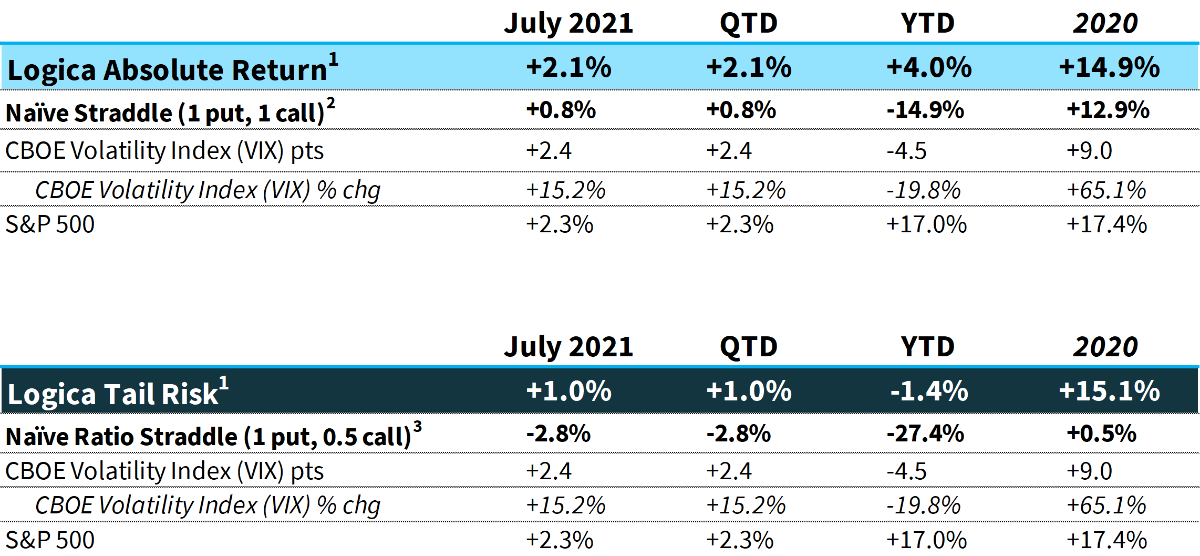
Summary: Equity markets continue to charge ahead with seemingly little resistance, although factor rotations continue to play out under the hood with the S&P 500 and Nasdaq 100 both up more than 2% while the Russell 2000 was down more than 3.5% in July. VIX/Implied Volatility provided a bit of a tailwind for a change, ringing its first positive month since January 2021.
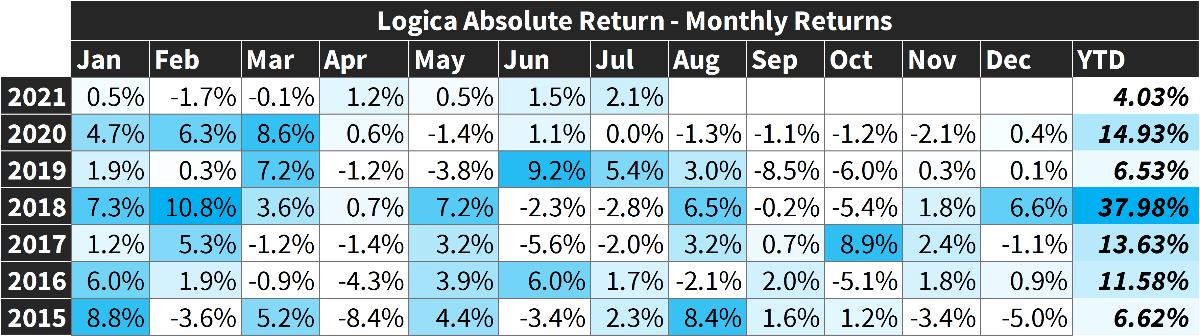
- Returns are Gross of fees. LAR Fund +1.98% (net), LTR Fund +0.87% for July 2021
- Naïve Straddle Return: a 1.5 month out, S&P 500 at-the-money put and call bought on the final trading day of prior month and sold on the final trading day of current month. This return on premium is divided by a factor of 6 to be comparable to Logica’s typical AUM-to-premium ratio.
- Naïve Ratio Straddle Return: a 1.5 month out, S&P 500 at-the-money put and at-the-money call (divided by 2) bought on the final trading day of prior month and sold on the final trading day of current month. This return on premium is divided by a factor of 6 to be comparable to Logica’s typical AUM-to-premium ratio.
“And when it rains
You’re shining down for me
And I just can’t get enough
And I just can’t get enough”
-Depeche Mode
Commentary & Portfolio Return Attribution
For many months (perhaps even a year now), like a broken record, we’ve been telling anyone that would listen that opportunities in the volatility space only get better the longer vol deterioration continues, and relatedly, the cheaper it gets (think of it as value investing for volatility).
Though there was actually some appreciation in implied vol this month (albeit a meager +2.4 points on VIX), the current environment has presented a perfect example of how simply removing/reducing the barrier of significant vol deterioration has really helped our strategy flourish.
Over each of the past 4 months (during which LAR has generated a positive return of +5.3%) the largest volatility headwind we experienced was during May (VIX -1.9 points). While vol moving down a couple points certainly doesn’t help, contrasting this with the environment with the latter half of 2020 obviously reveals a completely different world. Recall that from April 2020 through the end of 2020, VIX experienced down months of -29.4, -6.6, -6.0, and -17.5 points.
To put a cap on it: when implied volatility levels are decently low relative to historical, there is far greater probability one will experience a month like this, where the underlying market (S&P 500) appreciates while implied volatility also appreciates. This should be a huge boon to anyone holding long equity and long vol exposures, and why we continue to beat a dead horse about the benefits of investing in vol when it’s lower (which, ironically, is when you think you need it the least!).
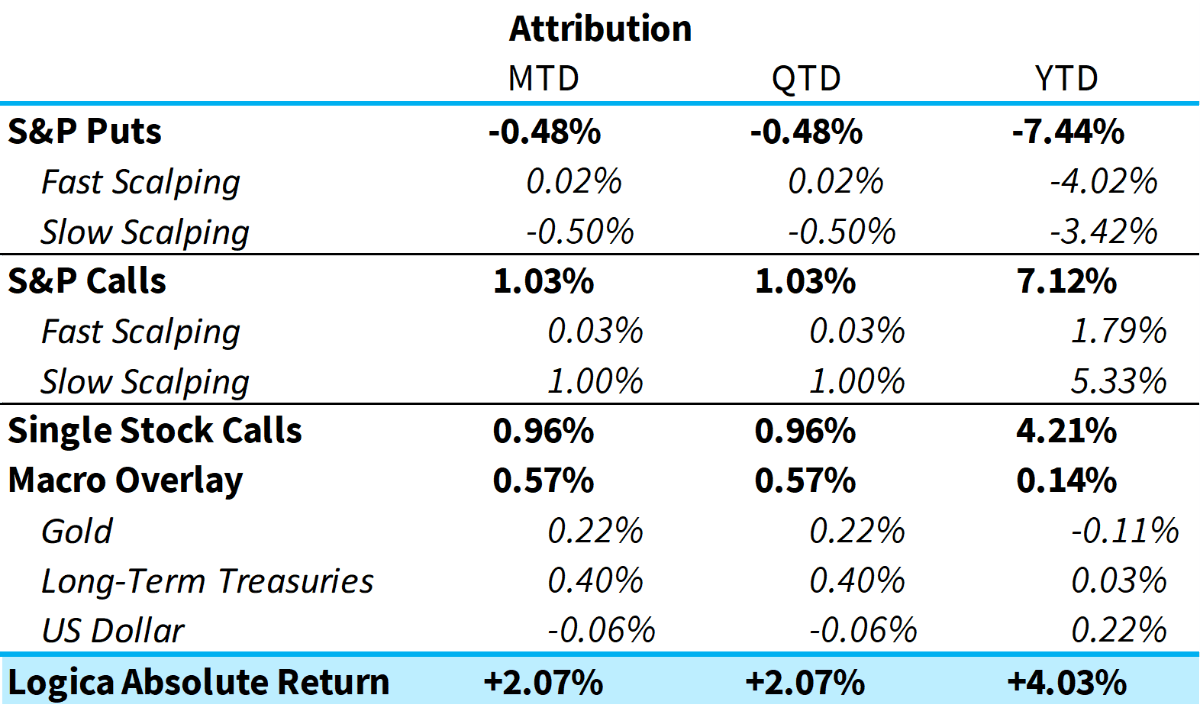
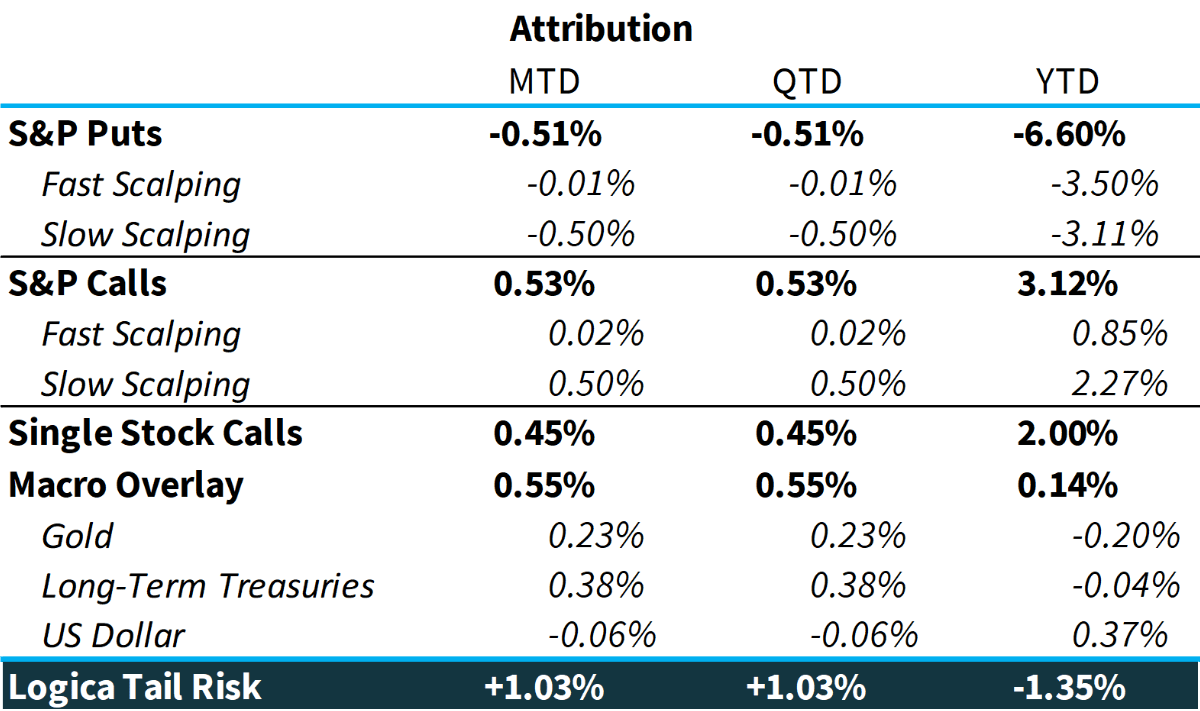
For this month, we are most satisfied by the performance of our “fast scalping” S&P Puts module. This process is known as “gamma scalping” and is our primary mechanism for monetizing profit along the way in order to mitigate the cost of carry. July is a nice example of the value of this process, as visualized in our scatter plots further down.
Intra-month volatility on the S&P 500 was up slightly this month (albeit, still nothing to write home about), which gave us ample opportunities to scalp. Any time we can have a long S&P Puts module come out positive on a month where the underlying was up – much less to the tune of +2.3% – is a major coup. Simply said, we achieved a positive output while being fully short an underlying that rose.
Elsewhere, most modules ran as expected, e.g., Calls went up! Most notably, we saw significant contribution from our Macro Overlay modules, bringing them positive YTD after a somewhat painful ride earlier this year. We wrote extensively about that experience in a prior letter, particularly with regards to substantive downside moves in Gold and Treasuries, and hope to see a continuation of the reversal story through the end of August.
Single stock calls were largely buoyed by increased exposure to growth/quality. Our momentum and diversifier exposures lagged the S&P this month, but we remain happy about being exposed to idiosyncratic bets across several “factors.” We see great benefit in taking concentrated convex bets but doing so across a more diverse range of exposures.
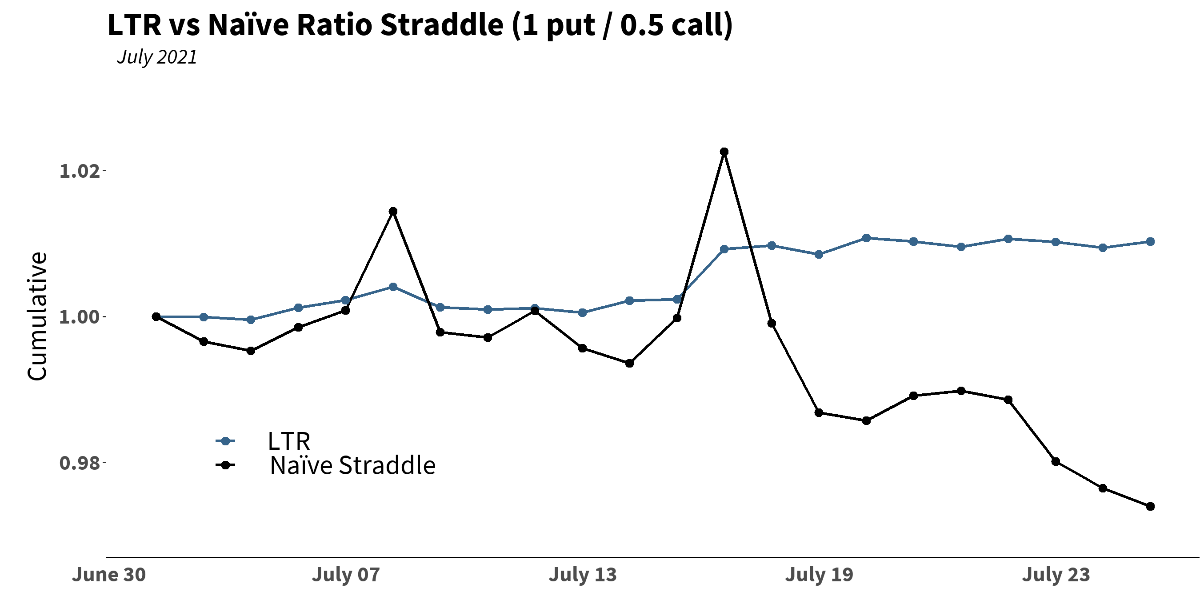
Both strategies nicely outpaced a naïve straddle in July. We continually see how a naïvely implemented (think “buy and hold”) strategy consistently fails to hold on to gains when volatility spikes:
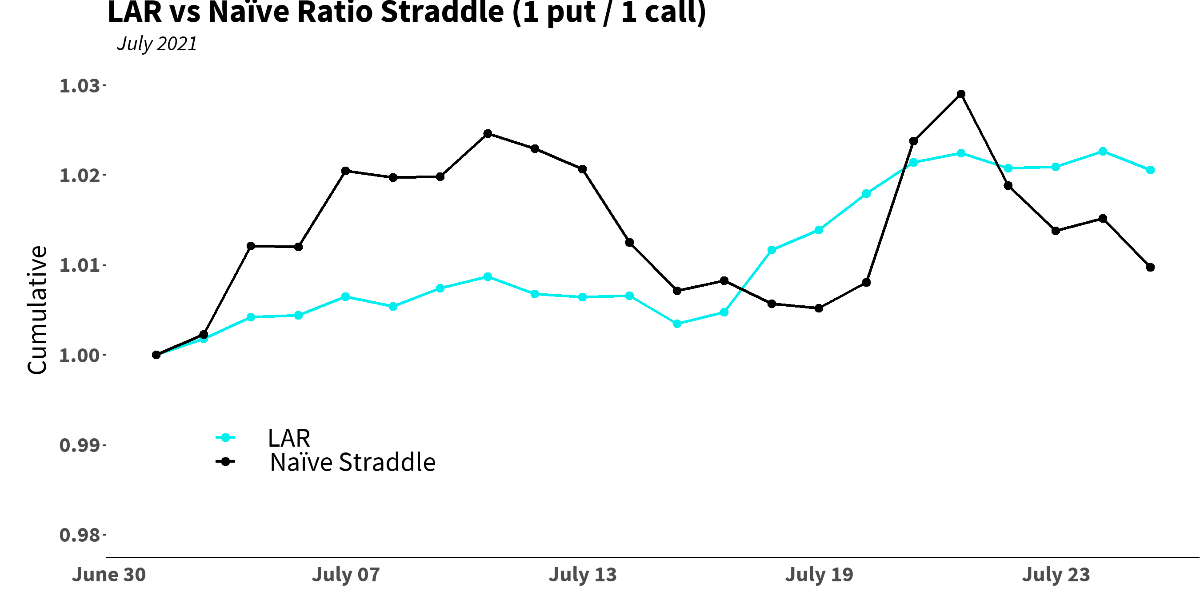
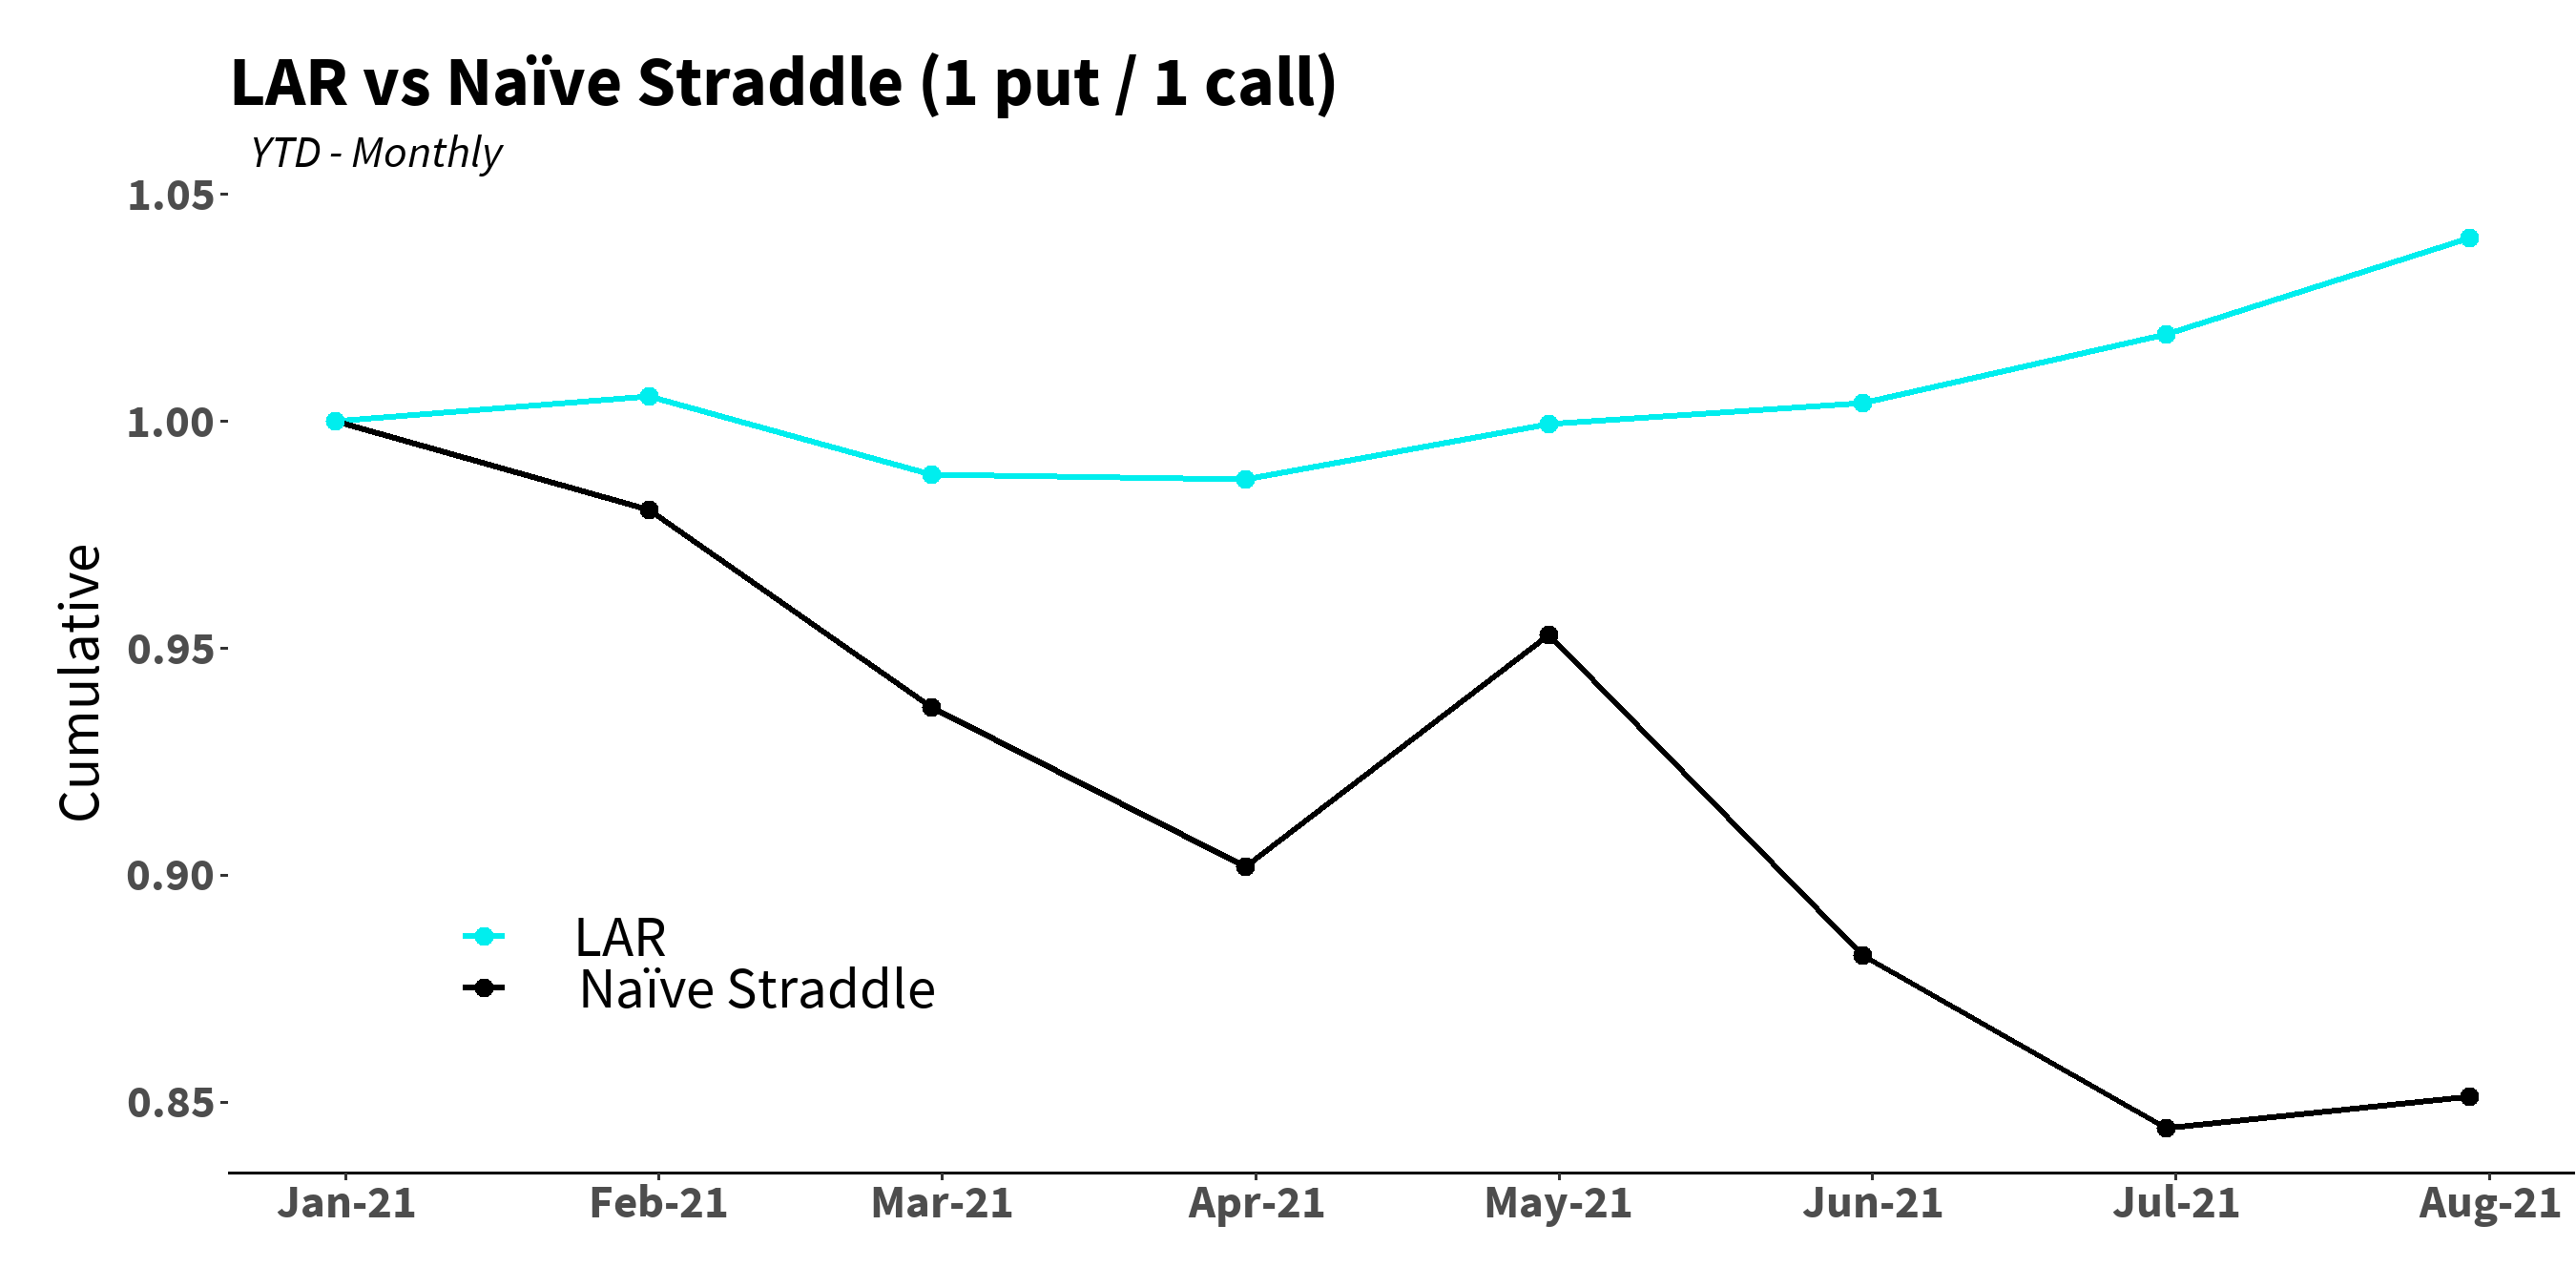
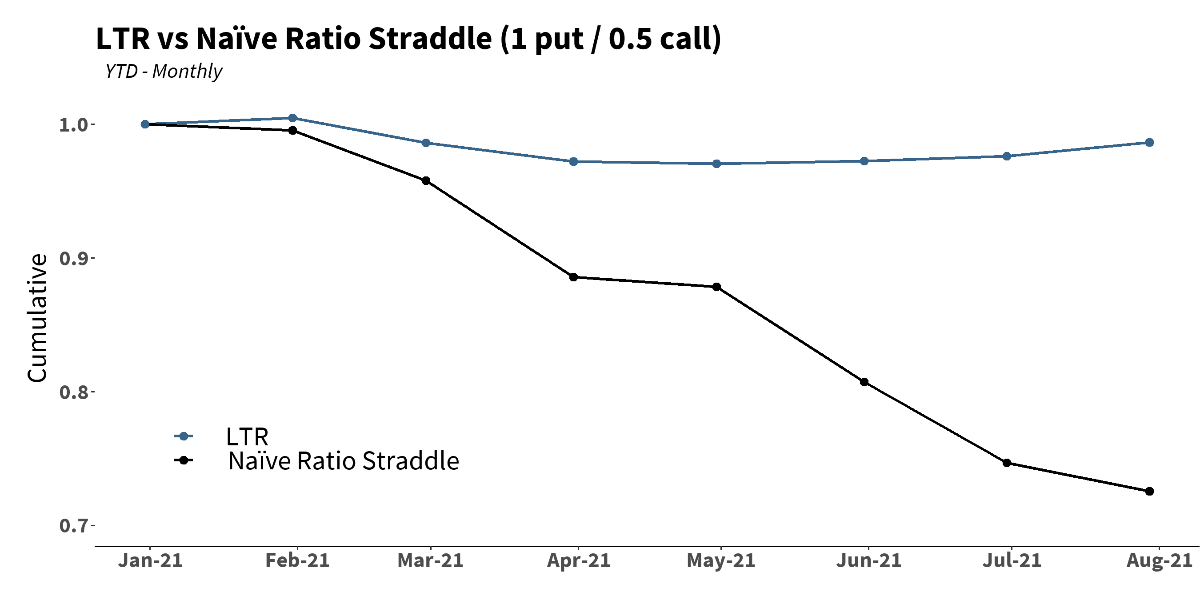
Year-to-Date, we see the same phenomenon:
Digging deeper, our daily distribution of returns was as expected, with one interesting difference: we were able to slightly outperform our historical distribution at the extremes, namely, on the best and worst S&P 500 days over the month. Recall that our fast scalping S&P Puts module helped to monetize profits, while our Calls naturally participated in the market’s climb. The big point being that both our strategies were positive on both “extreme” days:
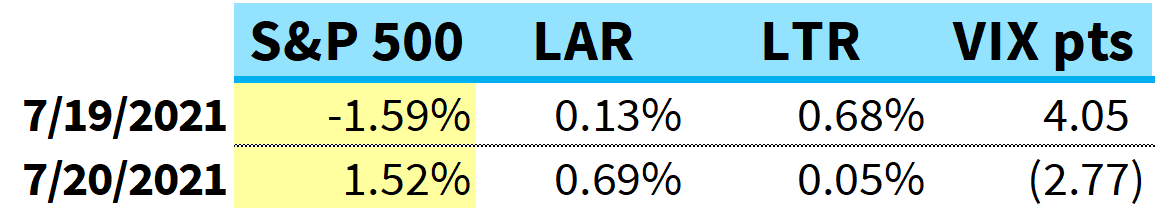
Visually, we can see these outcomes (the two most distant dots on either side):
“One pays for everything; the trick is not to pay too much of anything for anything.” – John Steinbeck
We often use the phrase “there’s no free lunch.” This is a helpful way to think about the world because it has us constantly evaluating if what we’re doing is sustainable long term – especially when it comes to trading models. A question we get asked most often is to explain how we pay for the cost of holding long volatility.
And the reason for the constant query, of course, is because most understand the benefits of being long vol: benefiting from uncertainty, performing well in times of crisis, and helping to optimize a portfolio’s long-term geometric return, just to name a few.In the vol space, most approach the problem of carrying long vol exposure by shorting volatility at some other place on the volatility surface (either moneyness or expiry/tenor).
While this is a viable approach, it carries with it several issues. First and foremost, it is counter-thesis; one is literally short the thing they most want to be long (volatility!), and hence introduce the worst kind of risk — the exact opposite outcome. Secondly, this style typically increases the complexity of managing the book, often causing one to initiate new positions to offset existing ones.
This makes it more time intensive, and worse, introduces more variables to continually account for (with multiple legs of long and short options, one must be much more attune to second, third and higher order derivatives, which are dynamic exposures themselves that can change dramatically from minute to minute).
Whenever one adds variables or additional components to a model, complexity increases at a non-linear rate. Essentially, one moves from trying to juggle 2 balls, to 3 balls, to 10 balls, etc…where juggling 10 balls is not just twice as hard as juggling 5, it’s exponentially harder.
One moves from something that is difficult, but doable with enough practice (juggling 5 balls), to something that is nearly impossible (juggling 10 balls; of note, the world record is 11 balls1). This thought process is to illustrate the importance of reducing complexity, which in investing, will reduce both the path dependency and the margin of error.
With that said, and as our investors are aware by now, instead of shorting volatility to pay for our long volatility, we opt instead to modulate our delta exposure so that most days we are intentionally not delta neutral at the portfolio level (depending on the strategy/module in question, this may be, on average, a positive, zero, or negative delta exposure).
(As an aside, we also modulate our vega [and vomma/volga] exposures, which are the amount of money we will make/lose given each point increase/decrease in volatility. For now, let’s just stay with delta.)
This modulation allows us to deal with some portion of volatility headwinds by scalping profits along the way. The wonderful thing about this is implied above: we have simplified our pieces and so our path is more certain.
If we were to tilt our delta positive, for example, we are taking the defined risk of not participating immediately upon a downside move in the underlying. Of course, the beauty of defined risks and discrete paths is that one does not have to change exposures in real-time (and is not as subject to gap risk): if we wake up tomorrow and the S&P 500 is down 5%, while we of course are not assured any specific magnitude of profit, we are very comfortable with the likelihood that even at a mild positive delta tilt, our Call exposure will have quickly dwindled, while our Put exposure will have increased dramatically.
On the other hand, if one is delta neutral via shorting an at-the-money Put option while being long a 20% out-of-the-money Put option (a Put spread), they are very much less certain as to when the OTM Put option gain will overtake the ATM Put option loss – and get less and less certain as the number of legs in that spread increase, as at that point, the specific path the underlying takes has a much larger effect. With some option spreads, one can oscillate between having a long and short volatility exposure depending on how the underlying moves. Added uncertainty is exactly what we don’t want.
As to the broad question, how can one possibly make enough money to offer this improved path independence (and all the other benefits of pure long vol) without spreads? Said differently, what other risk is taken to achieve this purity of long vol? Obviously, any strategy that has any hope of making money needs to take risk somewhere! The simple answer, as shared above in describing our modulation strategy, is delta risk. If we are not willing to take counter-thesis risk (short vol), then we must take some directional risk, i.e., delta exposure (whether long or short).
But ironically, delta risk, especially when bounded, is not as much risk as one might think – if one is exclusively long volatility. We’ve talked ad nauseum about how a volatility headwind is so difficult to overcome, and how most of our efforts are geared toward this singular issue (especially given the environment of late 2020/early 2021).
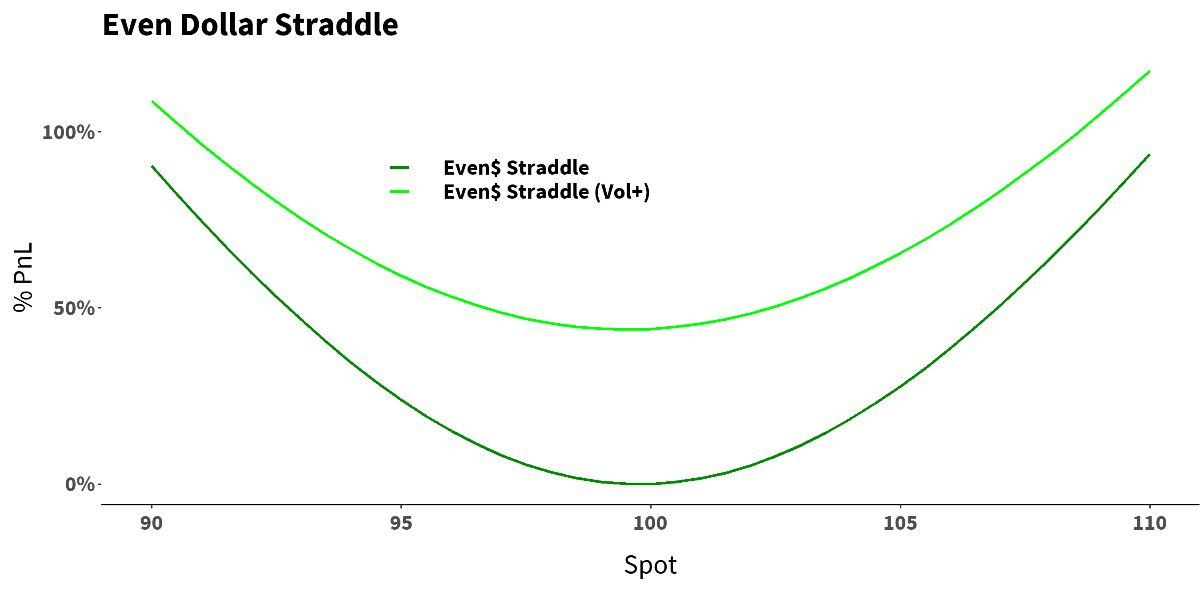
But on the heels of this month, we demonstrate below how beneficial a volatility tailwind can be. With a delta neutral straddle exposure, we can see the PnL profile dramatically moving in our favor with an 8.5 point increase in volatility (this illustration is simply the reverse of a prior 8.5 point volatility decay chart we included in our March 2021 letter that looked closely at vol deterioration):
Now, for illustration purposes, we show a long delta tilted straddle: long 1.3 Calls for every 1 Put. Hence, no longer delta neutral. We see that with a modest volatility tailwind of +8.5 points – as would surely be expected during a crisis (recall that during February 2020, VIX increased 24.6 points, and then another 45 points to the peak in March 2020)– even a long-delta tilted straddle is in very good shape given a significant down move in the underlying.
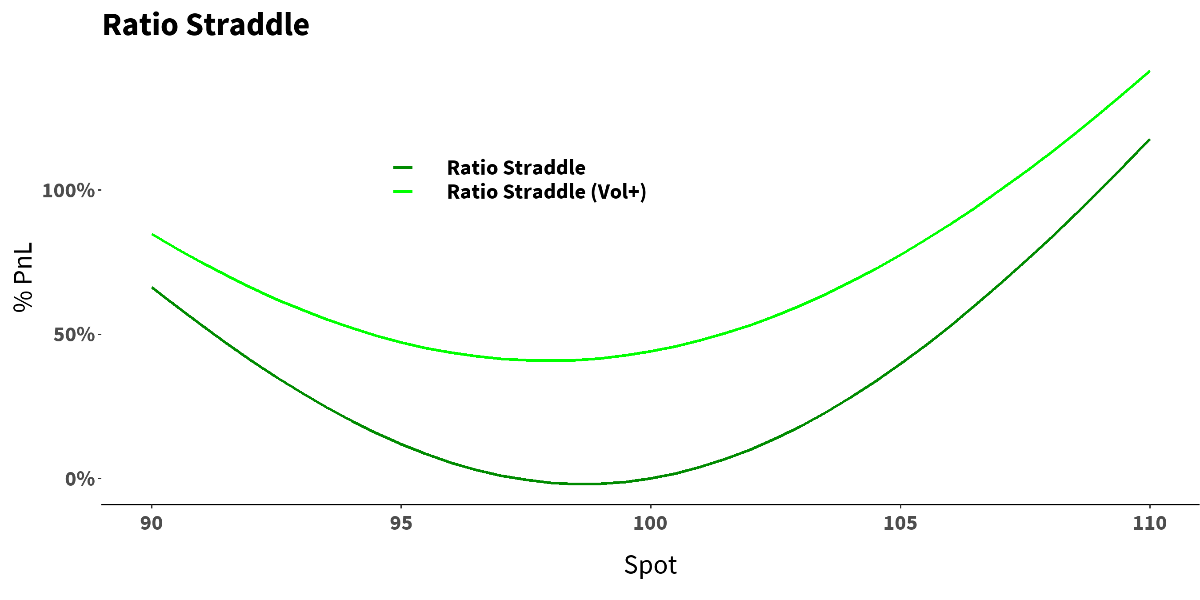
Looking at these scenarios together, we illustrate that we would of course give up some initial profit on the downside if we had a positive delta tilt at that moment in time. But one must pick their poison! As every strategy of every type needs to take risk somewhere, rather than shorting the very thing that we eagerly want to be long, we prefer to remain wholly long volatility at all times, and across all possible paths.
References
In the News
Hedge Fund Alert featured Logica’s Tail Risk strategy launch in its recent issue. See below for the link to the article:
Logica Capital – Hedge Fund Alert
Logica Strategy Details
Note: We have comprehensive statistics and metrics available for our strategies, but only include a select few to highlight what we believe is our most valuable contribution to any larger portfolio.
If you would like to learn more about our strategies, please reach out to:
Steven Greenblatt
424-652-9520
Follow Wayne on Twitter @WayneHimelsein
Logica Absolute Return
2015-2019 stats & grid, reconstitution of live sub-strategies normalized to 16% annualized volatility
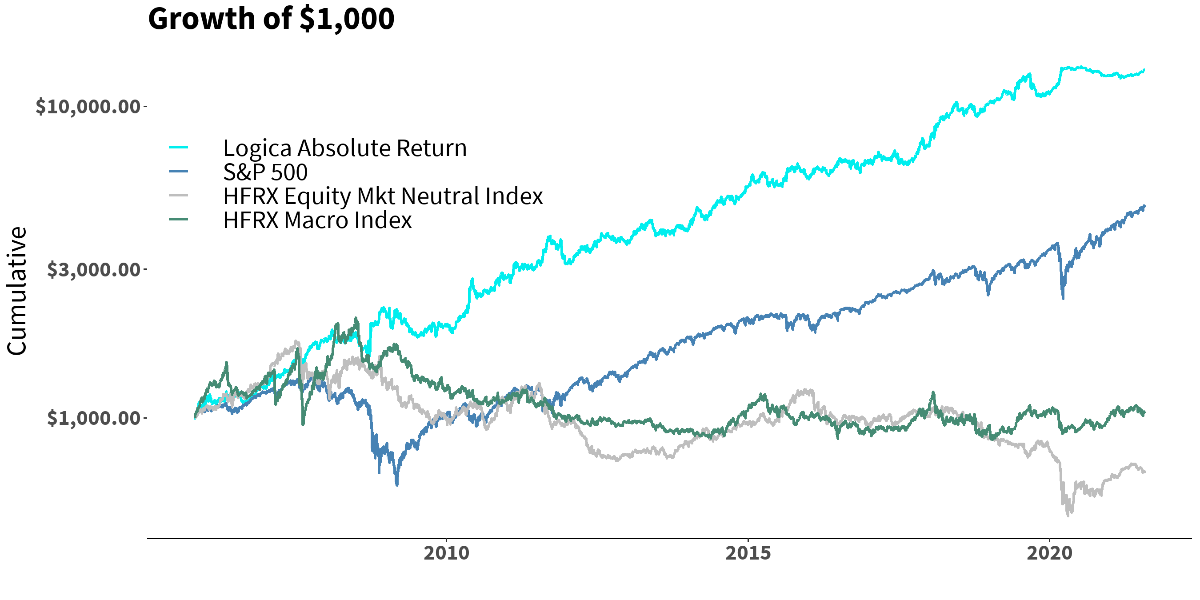
2005 to present growth of $1000 chart, simulation
Jan 2020 live
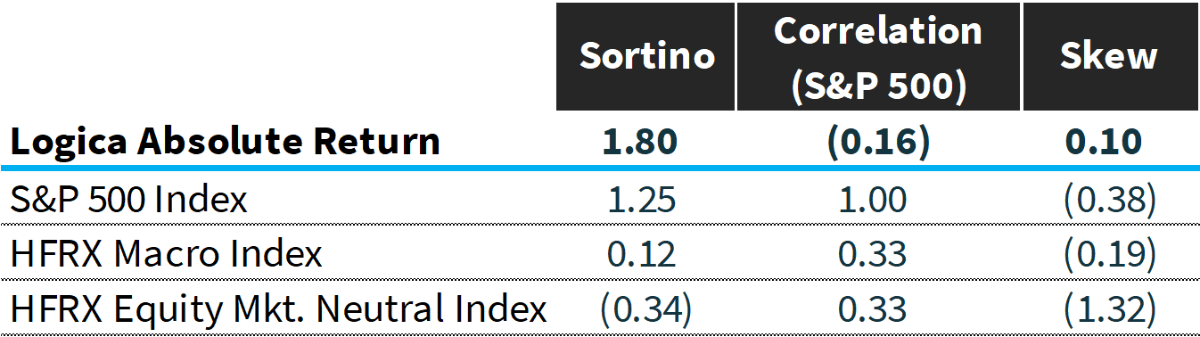
*HFRX Indices have been scaled up to 15% annualized volatility to be comparable to LAR and S&P 500.
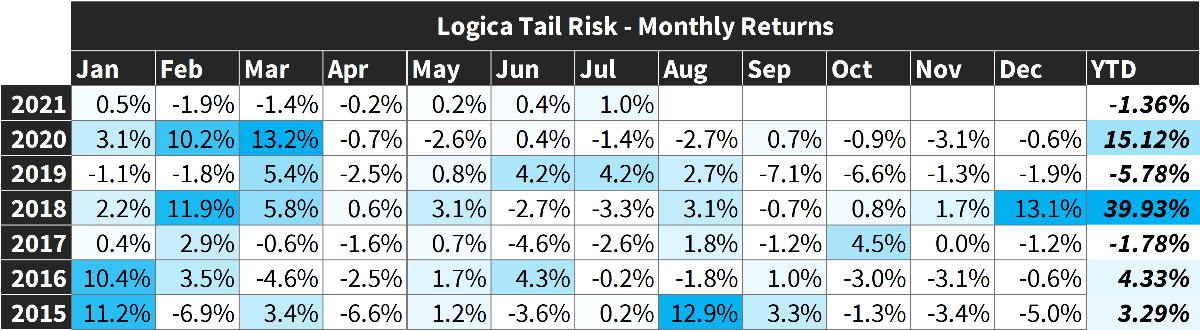
Logica Tail Risk
2015-2019 stats & grid, reconstitution of live sub-strategies normalized to 16% annualized volatility
2005 to present growth of $1000 chart, simulation
Jan 2020 live
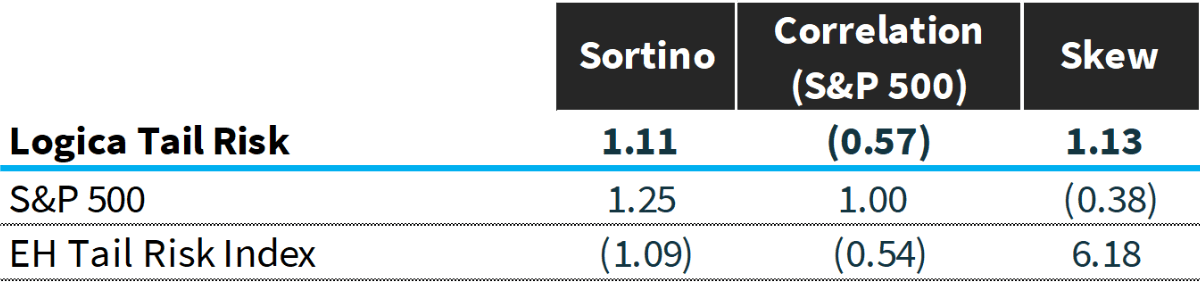
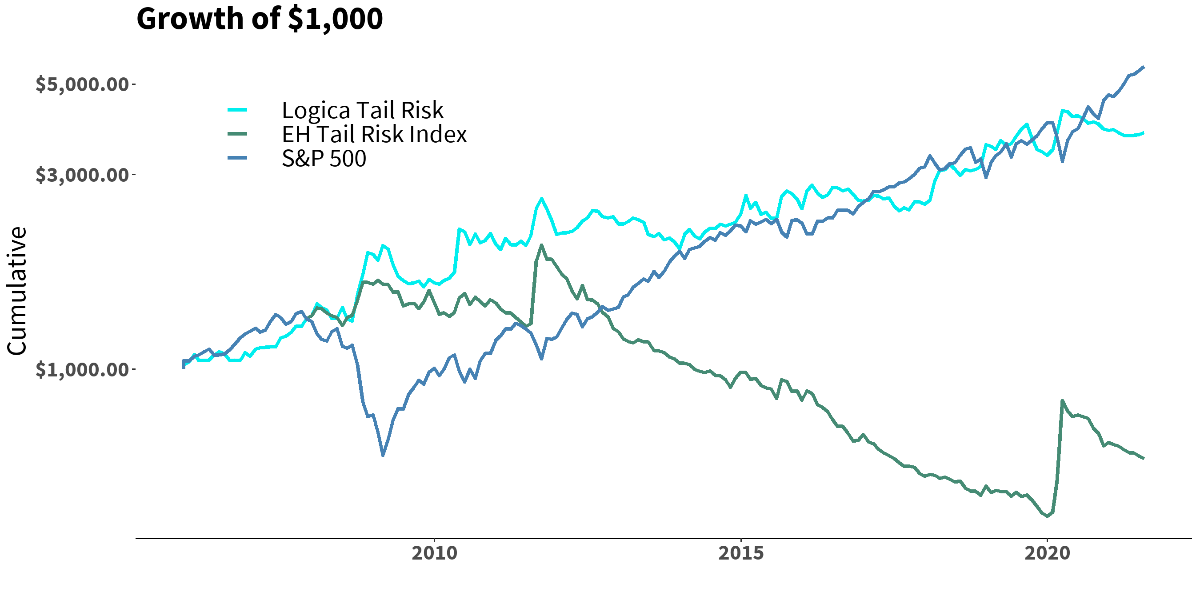
*EHTR Index has been scaled up to 17% annualized volatility to be comparable to LTR.


