
“Life and investing are long ballgames.” – Julian Robertson
On March 24th, India implemented a countrywide lockdown that continues to be in force as of this writing. The scale of the lockdown in unprecedented with the country’s 1.3 billion people ordered to stay within the confines of their homes. As of this writing, there is significant uncertainty around Wuhan coronavirus’s (COVID-19) primary variables that are required for modeling the impact of the pandemic. While COVID-19’s direct consequences in terms of health impact have significant uncertainty associated with them, the second and third order consequences related to lockdowns are even harder to model and fathom.
Q1 2020 hedge fund letters, conferences and more
What we can say with reasonably high confidence though, is that the pandemic will have lasting impacts. For many businesses, it will necessitate significant shifts in their business models. The uncertainty of potential outcomes triggered a wave of liquidations that saw most market segments down by nearly 40% on a year to date basis. Figure 1 shows the performance of the NIFTY 50 index, the NIFTY Midcap index, and the NIFTY Smallcap index during Q1 2020. As is seen, each one of the segments registered deep declines with an average decline of 40% across the three segments as compared to the prices recorded on the 7th of February.
Figure 1: Indian Equity Market Performance during Q1 2020
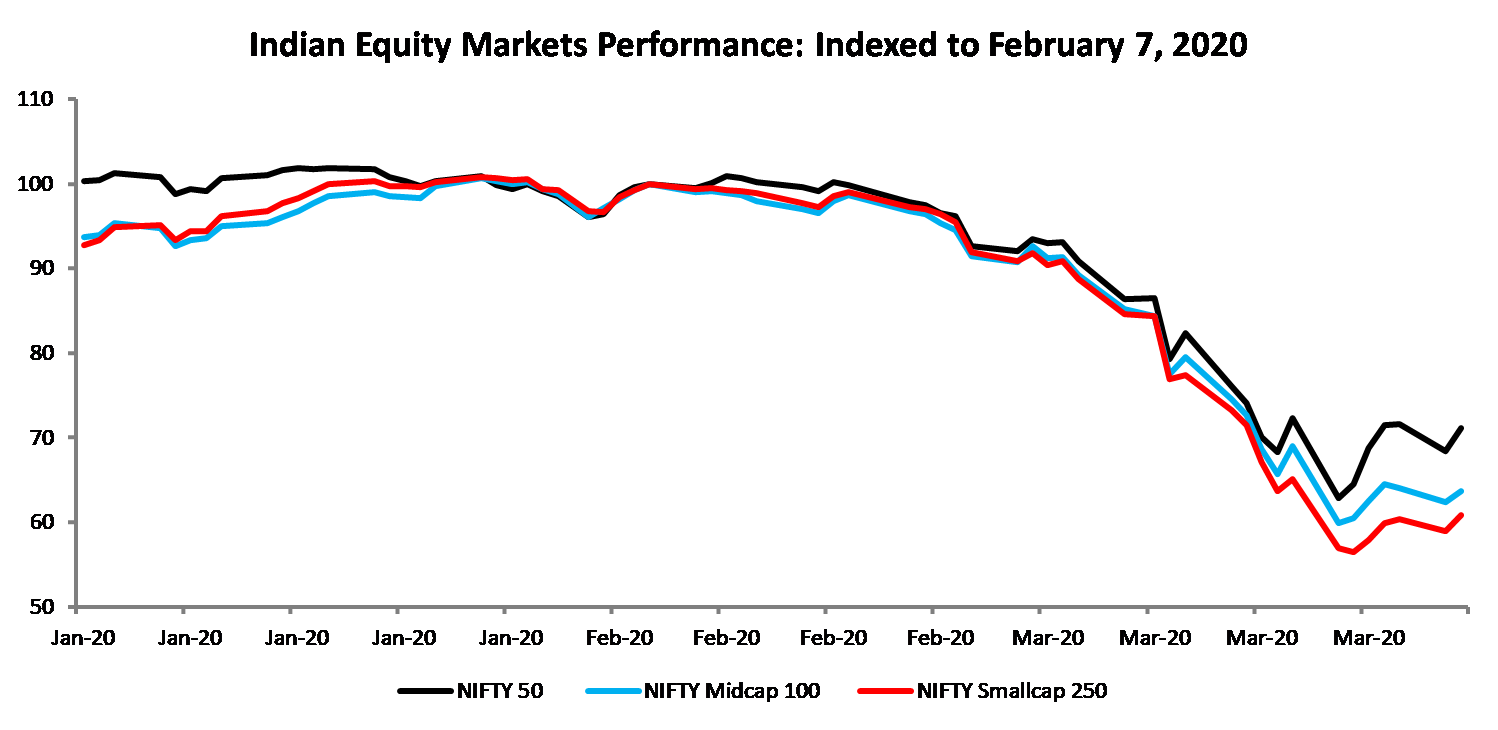
Source: Data from investing.com
Performance Of The Indian Equity Markets
Figure 2 shows the performance of primary sectors of the Indian equity markets as represented by various NIFTY sector indices. While the initial wave of the selling resulted in fairly similar price changes across sectors, towards the end, significant differences emerged. The Auto, Banks, and Realty sectors performed the worst with average declines of 45% while the Pharma, IT, and FMCG sectors held up well registering average declines of 27%.
Figure 2: Performance of Primary Sectors of Indian Equity Markets
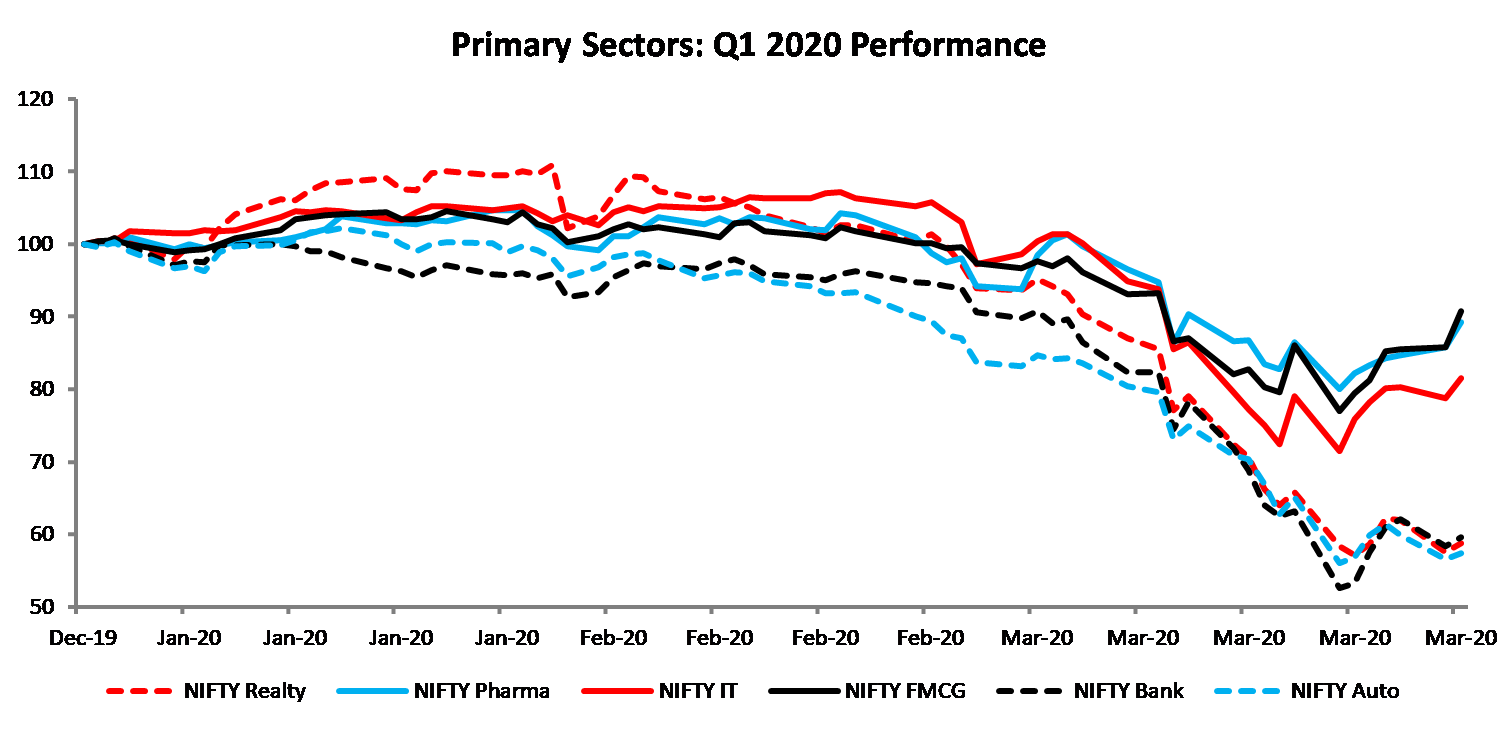
Source: Data from investing.com
As is generally the case, periods of crises are associated with the depreciation of rupee against the dollar. This time was no different either. At its lows, the Indian rupee depreciated by 6.5% against the US dollar. Figure 2 shows the performance of Indian Rupee against the US Dollar.
Figure 3: Performance of the Indian Rupee against the US Dollar
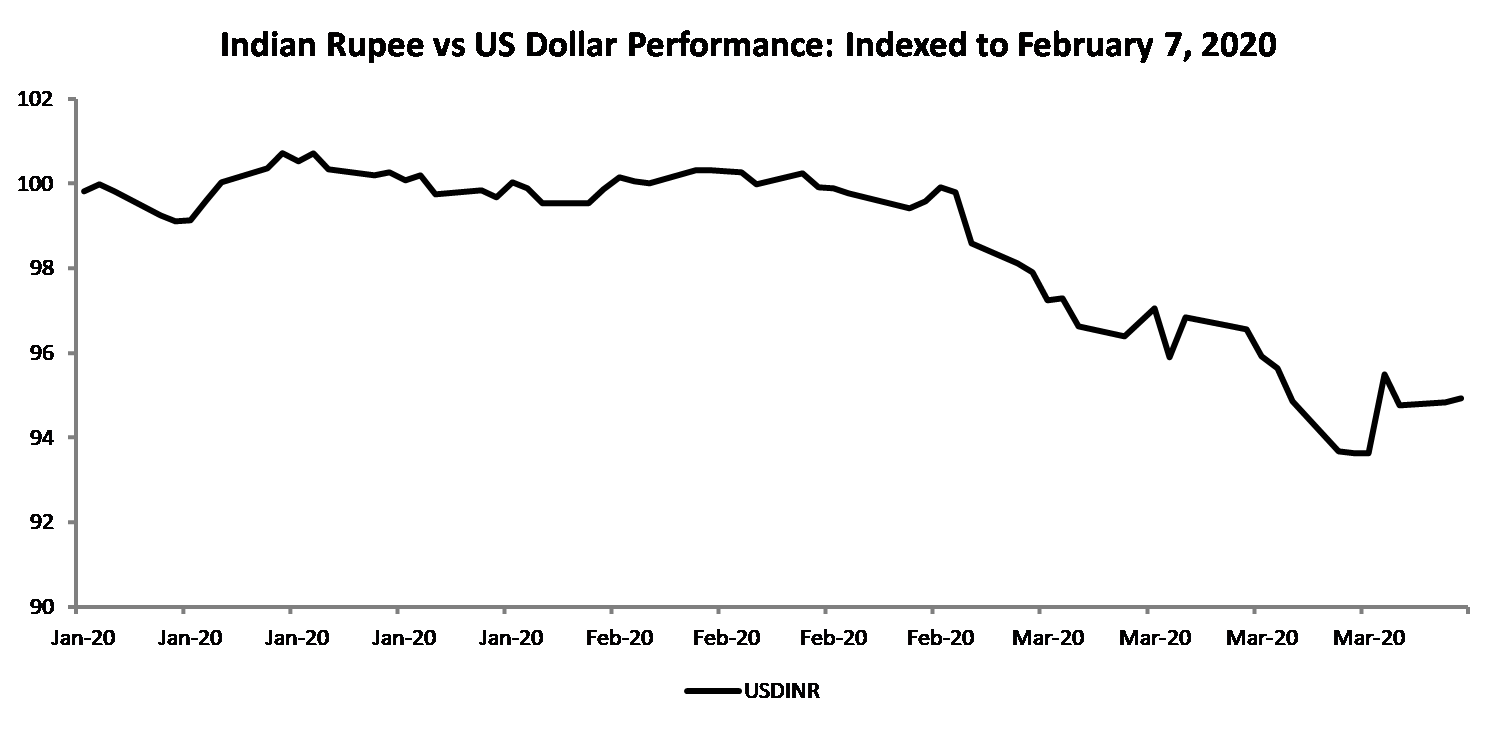
Source: data from investing.com
Higher Risk, Lower Returns
In our Q2 2019 letter, we highlighted NBFCs as one area which had become the interest of speculation between late 2016 and early 2018. We offered a comparison of the performance of a basket of NBFCs to that of the equity basket of the Fund. In that letter, we contended that the excess performance of NBFC basket was in the process of being erased.
Figure 4 provides an updated chart. As is seen, all the outperformance of the NBFC basket was indeed erased and then some. As we stated in that letter, “The higher risk of a basket of securities does not guarantee higher returns. It only offers a chance of higher returns.” The issue with such speculative baskets is that they destroy capital right when you need it the most; during periods of crises.
Figure 4: Performance of Equal-Weighted NBFCs Index and IMF’s Equity Portfolio
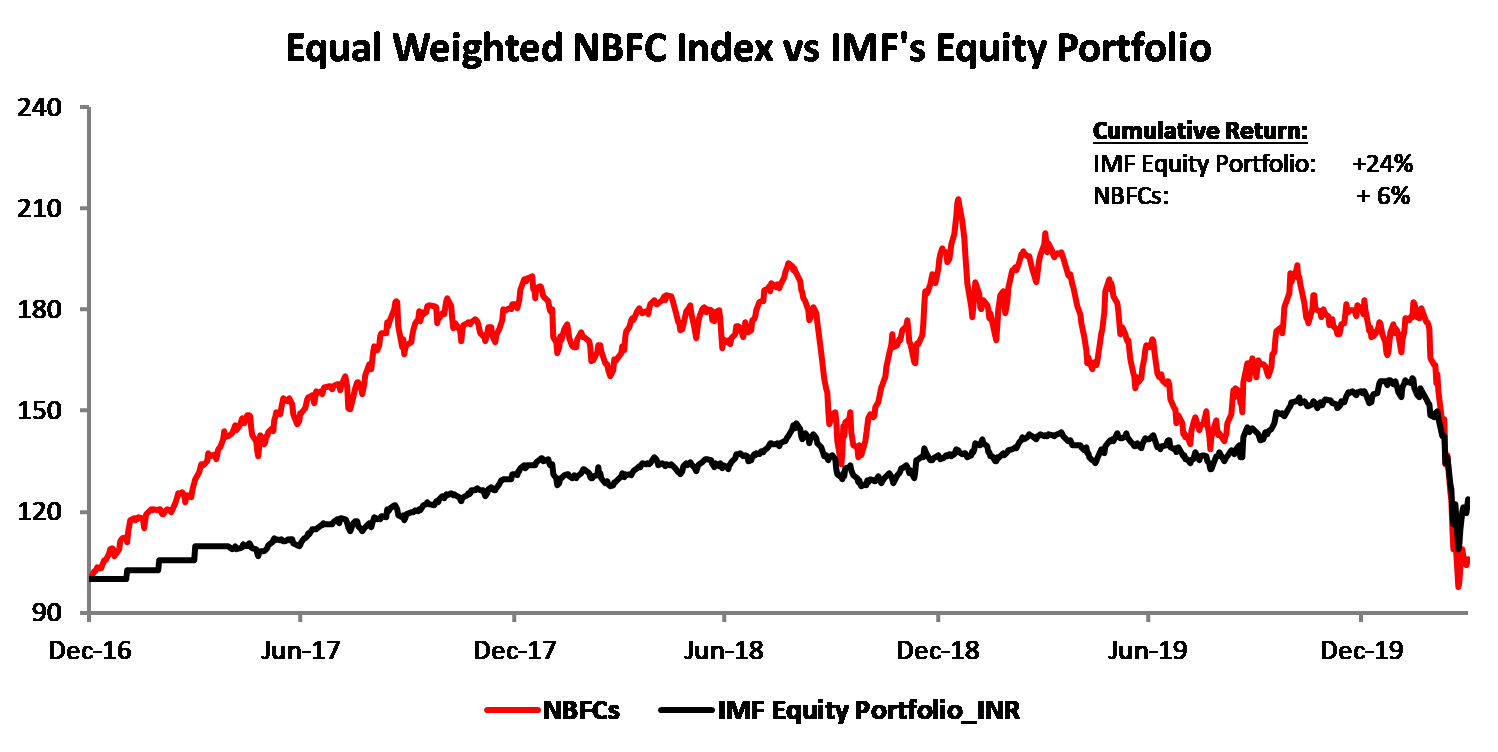
Source: Sapphire’s calculations, data from Factset
To offer further perspective on this characteristic, we set up a strategy by pulling up a list of the largest five hundred companies by market capitalization as of October 1st every year starting in 2016. We then removed all banking, financial, and utility companies from our analysis. Finally, we selected the top quartile of companies based on their leverage levels[1] to represent the most financially leveraged businesses. This process was then repeated every year.
To ensure that we were using data that was indeed available in the public domain, we built the index as of October 1st which allows for a six-month lag period as most Indian companies have a March year-end. We chose to 2016 as the starting year as it was right before the big rally of 2017.
As is seen, as the 2017 rally took over, the most financially leveraged basket of companies generated significantly superior performance as compared to the Fund’s equity portfolio. However, as is seen in Figure 5, that outperformance has since more than reversed.
Figure 5: Performance of Most Leveraged Companies and IMF’s Equity Portfolio
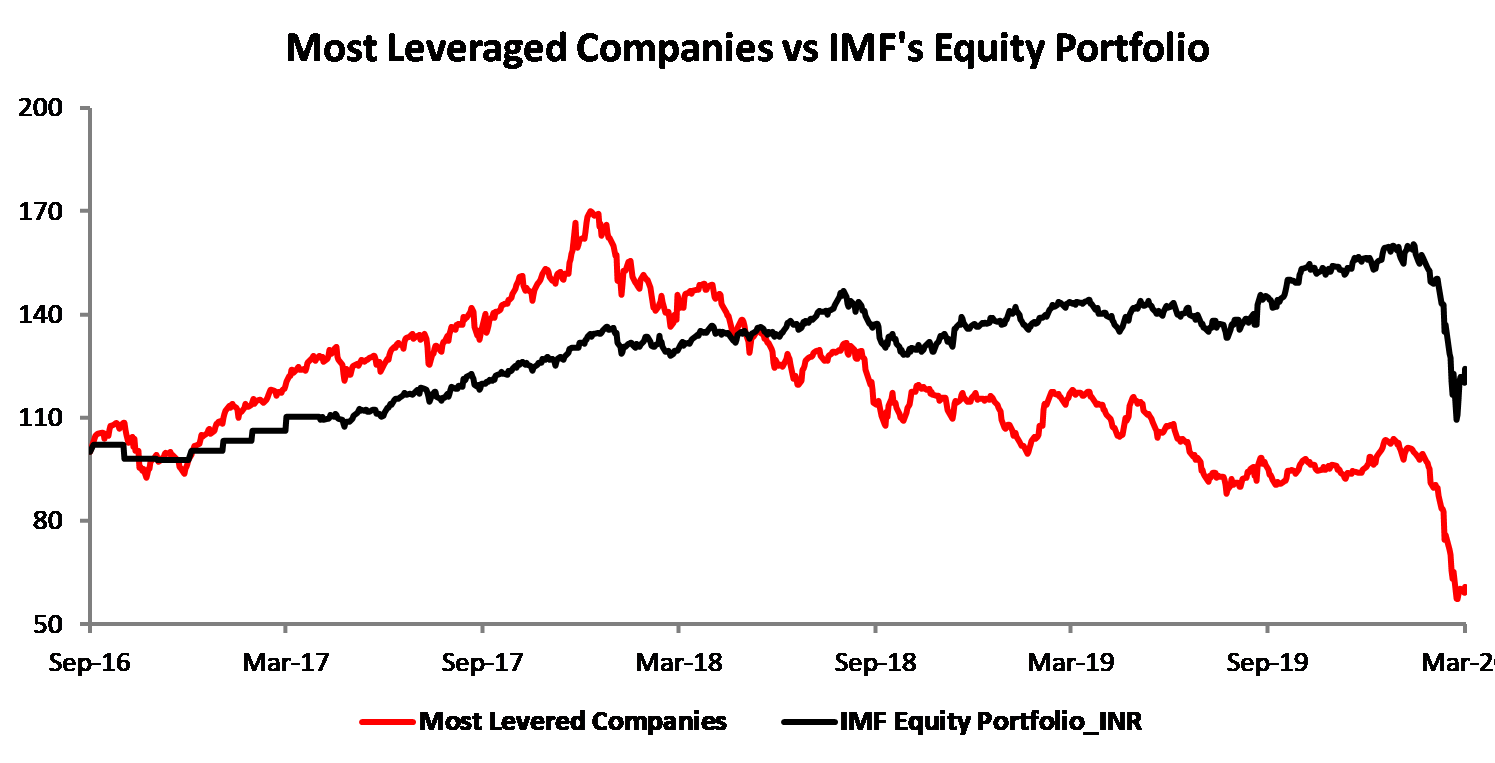
Source: Sapphire’s calculations, data from Factset
Quality: Building Steady Portfolios
At India Moats Fund, the core of what we do is to own a basket of businesses that in our opinion possess durable competitive advantages. While there are more than five thousand companies listed on Indian bourses, there are just a handful of companies that truly have durable competitive advantages. We then remove businesses that are beset with corporate governance or quality of earnings issues. We find that there are just about fifty businesses in Indian equity markets that satisfy all our requirements.
Our stringent investment requirements have ensured that we have avoided most landmines that have affected investment portfolios. We think it is important to keep in mind that investing is akin to marathon and not a sprint. To provide for easy comparison, in Figure 6, we have shown the performance of our investment portfolio in Indian Rupees along with that of the NIFTY 50 index and the NIFTY Midcap 100 index. As is seen, we have generated superior returns during the overall period while enduring much lower declines compared to the broader markets.
Figure 6: Performance of IMF’s Equity Portfolio vs NIFTY and NIFTY Midcap 100 Index
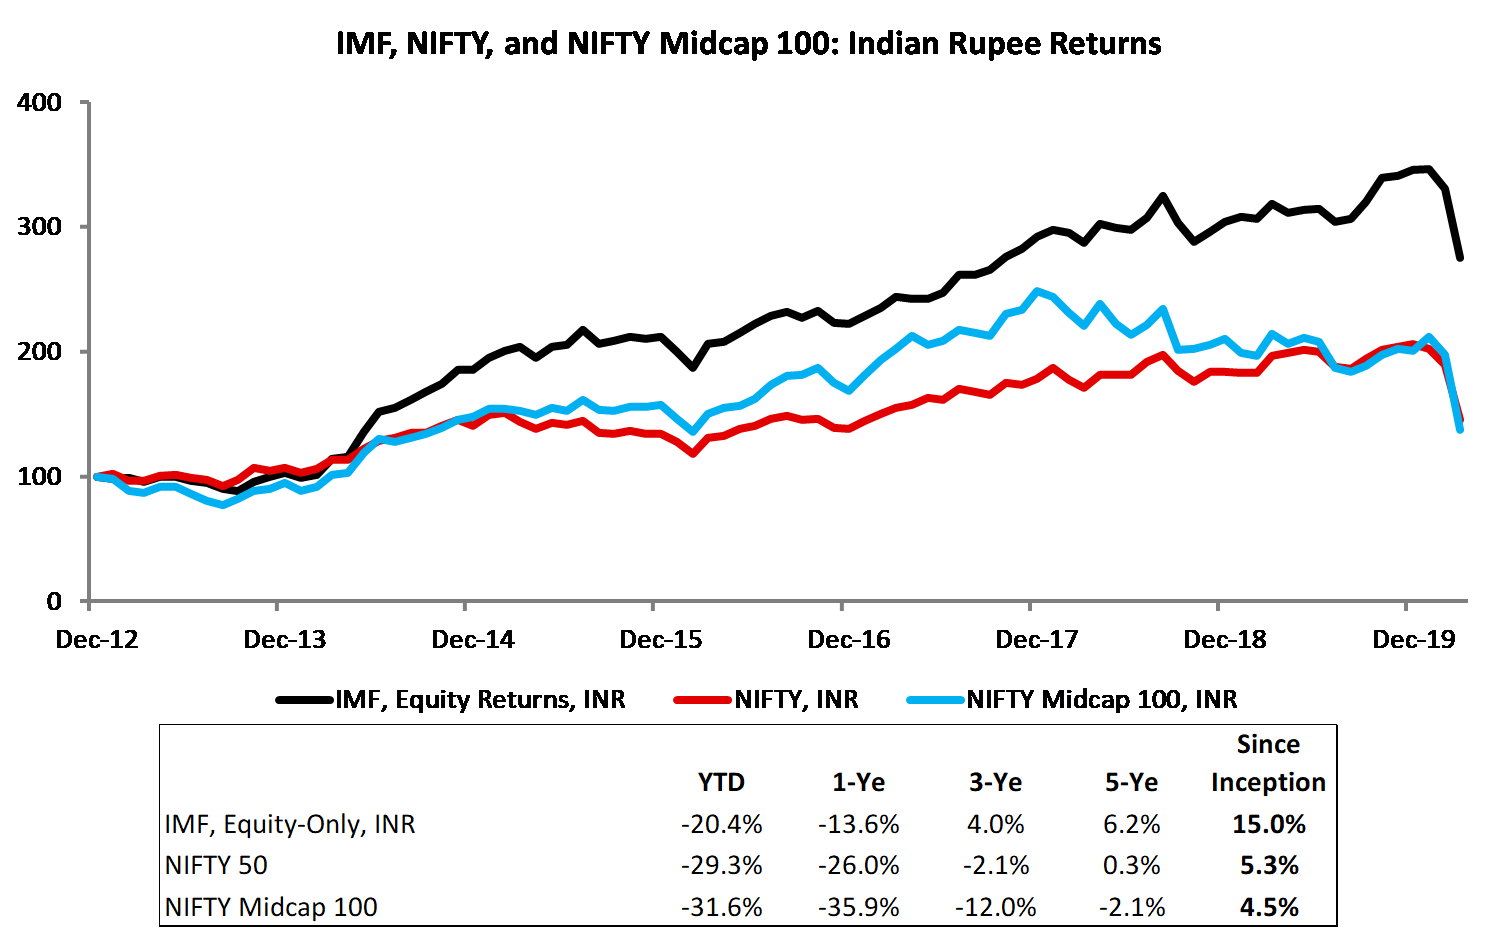
Source: Sapphire’s calculations, Index data from investing.com
Expected Returns: Significantly Improved Opportunity Set
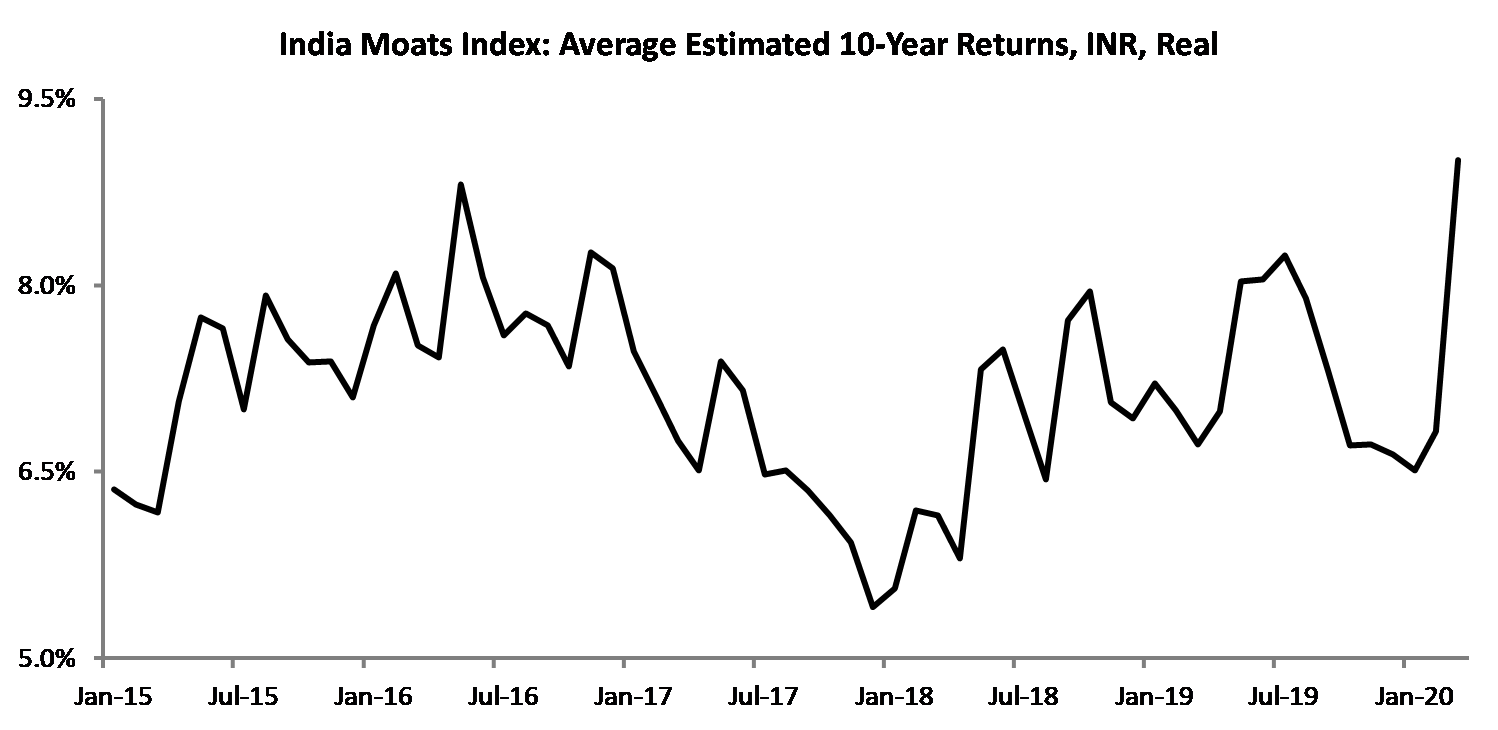
Figure 7 shows the average estimated 10-year returns[2] for companies comprised in the India Moats Index (IMI[3]). As is seen, our current estimate of the 10-year return is the highest of the past five years.
Figure 7: Average Estimated 10-Year Return for India Moats Index
Summary
The Wuhan coronavirus pandemic has given rise to significant uncertainties for the economic and business environment. However, as we have depicted in our previous letters as well as in this one, the higher risk baskets when held for long enough periods, generate extremely poor outcomes for their owners. The important lesson here is that most stocks, at best, represent trading opportunities akin to one-night stands. Only a handful represent businesses that generate superior investment returns over extended periods. Importantly, the current prices are starting to allow for superior investment returns and warrant increasing investment allocations.
Stay safe. We wish the best to your investing.
About the Author
Baijnath Ramraika, CFA, is a cofounder and the CEO & CIO of Multi-Act Equiglobe (MAEG) Limited and is the Executive Director at Sapphire Capital. As a portfolio manager, he manages the Global Moats Fund and the India Moats Fund. Contact him at [email protected]. Baijnath’s thoughts and ideas can be read at his blog at www.symantaka.com
Prashant K. Trivedi, CFA, is a cofounder of MAEG and the founder and chairman of Multi-Act Trade and Investments Pvt. Ltd.
MAEG is an investment manager and manages the Global Moats Fund, an investment fund that invests in a global portfolio of high-quality businesses with sustainable competitive advantages. Sapphire manages the India Moats Fund, an investment fund that invests in a portfolio of high-quality Indian businesses with sustainable competitive advantages.
Multi-Act is a financial services provider operating an investment advisory business and an independent equity research services business based in Mumbai, India.
[1] While traditionally Wall Street uses Debt/EBITDA ratios as the metric, we prefer to use Debt/Operating Cash Flows as cash is not subject to accounting gimmickry; an important issue when dealing into Indian equities. [2] As the basket of companies includes just about fifty companies, outliers have a meaningful impact on the averages. Accordingly, we have winsorized the data by removing the top 10% and the bottom 10% of readings. [3] IMI is a proprietary index of Sapphire that is comprised of businesses that in our opinion possess durable competitive advantages and are devoid of corporate governance and quality of earnings issues.


