It was another busy week of SEC filings and the update for 1st quarter 2021 financial statements is nearing completion. The Broad Market Index was down 1.39% last week and 56% of stocks out-performed the index.
Q1 2021 hedge fund letters, conferences and more
Growth is broadly improving with sales growth up at 64% of companies accounting for 78% of market capital. Index average sales growth is 10% up from 6% last period and the first advance in two years.
Profit margins are also broadly improving while the averages are impaired by the severe virus-related weakness that persists in the most depressed industries like airlines, gaming and lodging industries and the oil related industries. In these industries profit margins are cascading downward, cash flow is widely negative and cash from debts and equity issuance last year is burning up.
As inflation looms, the consumer driven cyclical recovery gathers strength as the housing and auto industries record high and rising sales growth, higher gross profit margins and lower costs. This is lifting sales at industrial companies, putting upwards pressure on commodity prices and making sector allocation decisions even more critical.
Typical Cyclical Corporate Recovery
A housing & auto lead cyclical recovery instigated by low interest rates and easy credit has been a feature of every US economic cycle since WW2. This cyclical corporate pattern is very familiar. It will play out over the next two years as a big acceleration in sales of big-ticket consumer goods drives up demand and prices of commodities beginning an inflation advance. The big one, the mother of all commodities, and potentially the most disruptive is oil.
US Oil Policy Revisited
Oil producers and related service companies are in a severe depression. It was only a decade ago when energy self-sufficiency was US policy. Financing with federal tax subsidies and a wave of new technology created a huge advance in debt-financed capital expenditures. It also created an oil production boom, a global glut and ultimately a huge oil-price decline that only reached its bottom a year ago.
Even now, capital expenditures continue to advance relative to sales. CAPX cannot be reduced fast enough to keep up with falling sales. Even though this is a most severe downturn, the oil industry has seen many of these similar cycles. The worst will be over when there is widespread bankruptcy and only surviving companies pick over the assets of the failed ones. That is underway now and the earliest indicator of a sustained advance in oil prices is lower capital expenditures which halts supply growth and tightens supply/demand. We already saw the beginning of that last year.
Prices Are UP
In recent months a huge rally in shares of industrial and commodity stocks has lifted most stocks to premium prices. The population of depressed stocks is currently unusually small. This happens when the smaller proportion of depressed stocks are big companies with accounting for the large proportion of the index capital weight.
Make sure your portfolio companies have rising growth attributes. Rising interest rates will depress the value of assets. Only rising growth can overcome the depressing effect on asset prices of higher interest rates.
With that said, average company growth is likely to be impaired by higher inflation and valuation of the average stock will be reduced by higher interest rates. Overall index average growth is still falling as lower gross margins and higher SG&A expenses depress cashflow growth even with sales-growth broadly up.
The major market advance of this year (stocks are up 35% since the election relative to long bonds – the biggest jump ever) has provided an excellent opportunity to improve the growth attributes of your portfolio.
Look for companies like PerkinElmer, Inc. with an Otos Portfolio MoneyTree having a long healthy trunk (higher sales growth), lush green globe (improving profitability) and a stable golden pot (higher profit margins and good/improving financial condition).
Perkinelmer Inc. $143.560 Buy This Rich Company Getting Better
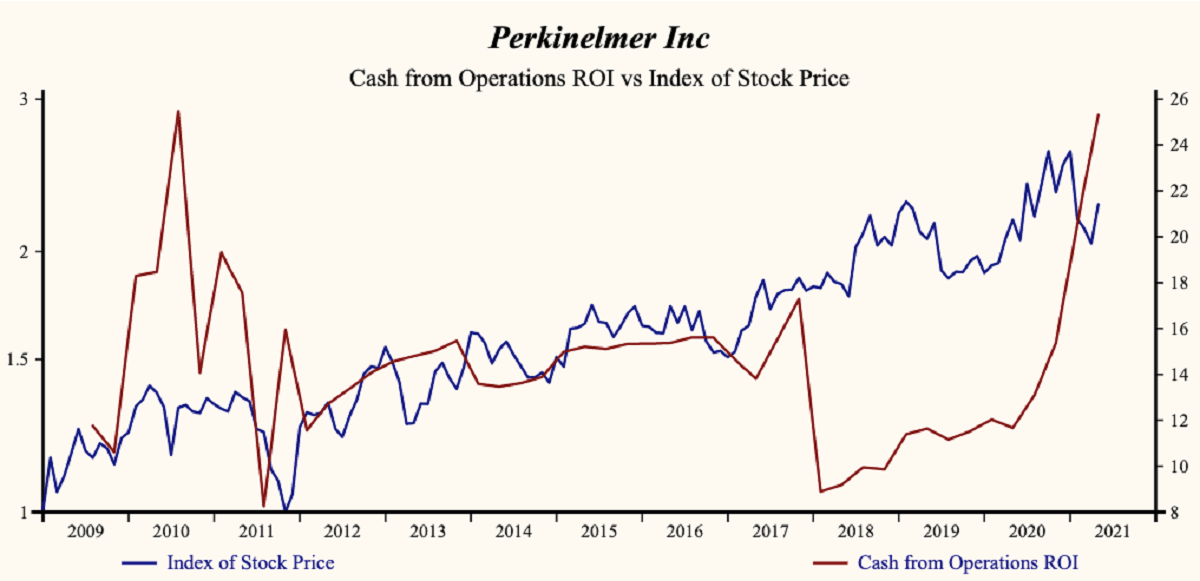
PerkinElmer, Inc. (NYSE:PKI) has been a profitable company with persistently high cash return on total capital of 13.6% on average over the past 21 years. Over the long term the shares of Perkinelmer Inc have advanced by 79% relative to the broad market index.
The shares have been very highly correlated with trends in Growth Factors. A dominant factor in the Growth group is Free Cashflow Margin which has been 92% correlated with the share price with a one quarter lead.
Superior Quality Growth Trend
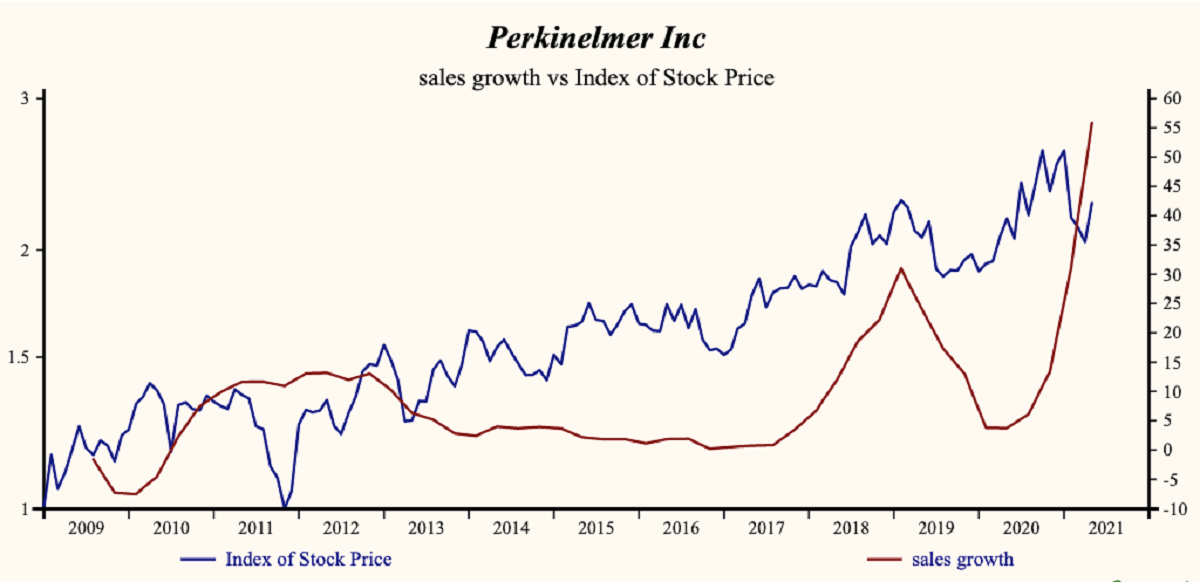
Currently, sales growth is 55.9% which is very high and higher than last quarter. Receivable turnover has remained steady reflecting a strong quality of sales.
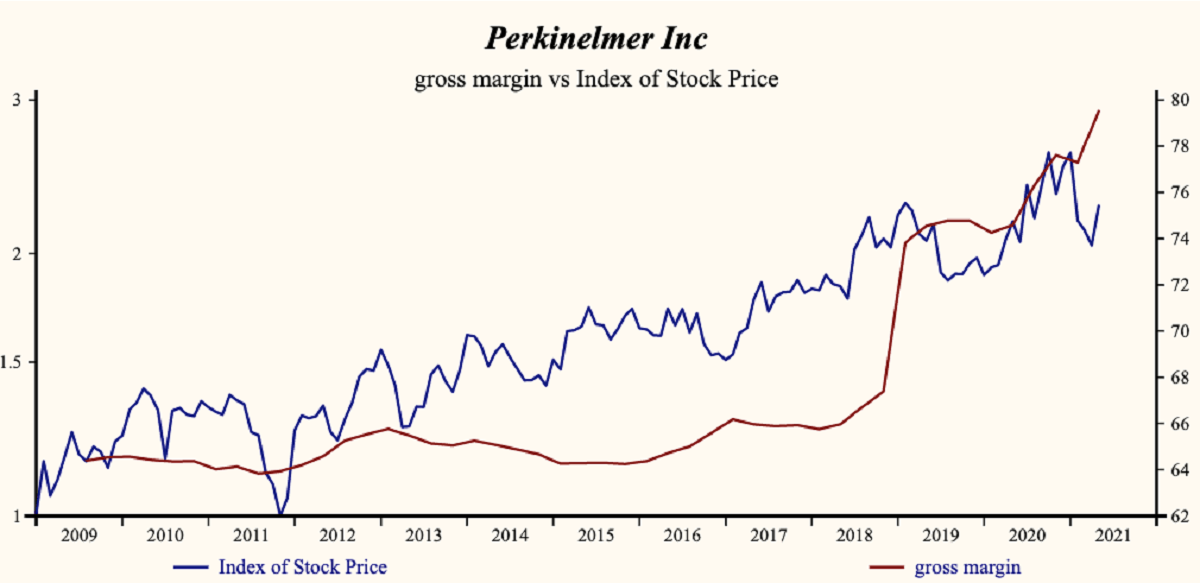
The company is recording a high and rising gross profit margin. Inventory turnover continues to fall which indicates that products are not sitting on the shelf.
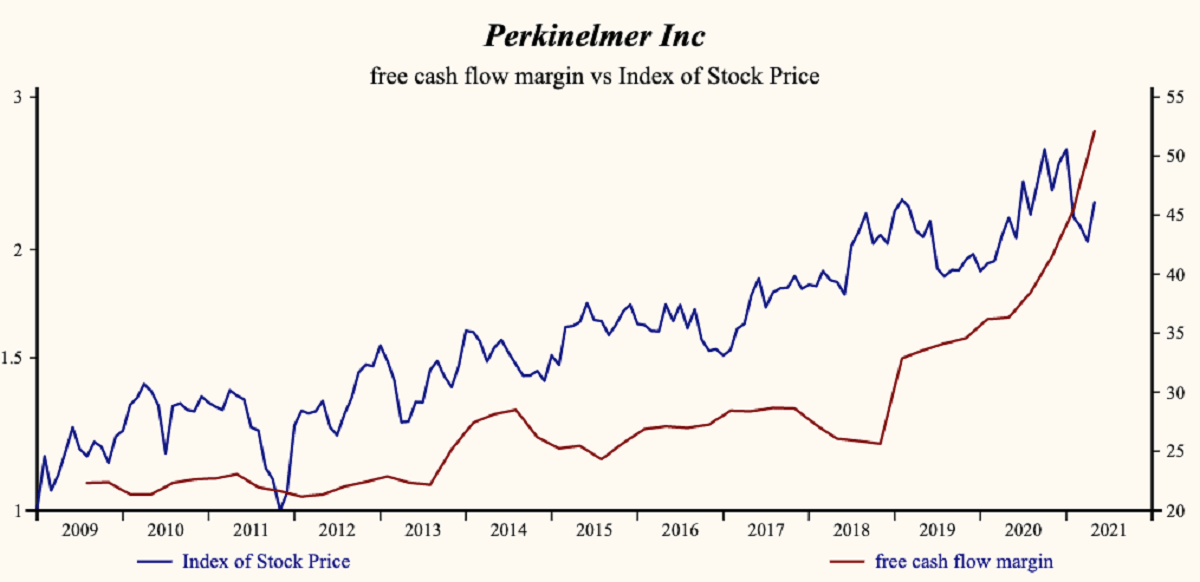
Sales, General & Administrative (SG&A) expenses are low in the record of the company and falling. SG&A expenses are falling at a more rapid rate than the gross margin producing a rising profit margin or (EBITDA margin). Free cash flow growth has been increasing sharply since early 2018 and is now at a record high.
More recently, the shares of Perkinelmer Inc have advanced by 20% since the August, 2019 low. The shares are trading at lower-end of the volatility range in a 21-month rising relative share price trend.
The current depressed share price provides a good opportunity to buy the shares of this evidently accelerating company.