Gold sank profoundly on Jun. 17, taking its crew along. While it has the strength to go up for one more breath, other PM assets may not be that tough.
Q1 2021 hedge fund letters, conferences and more
The Gold Miners
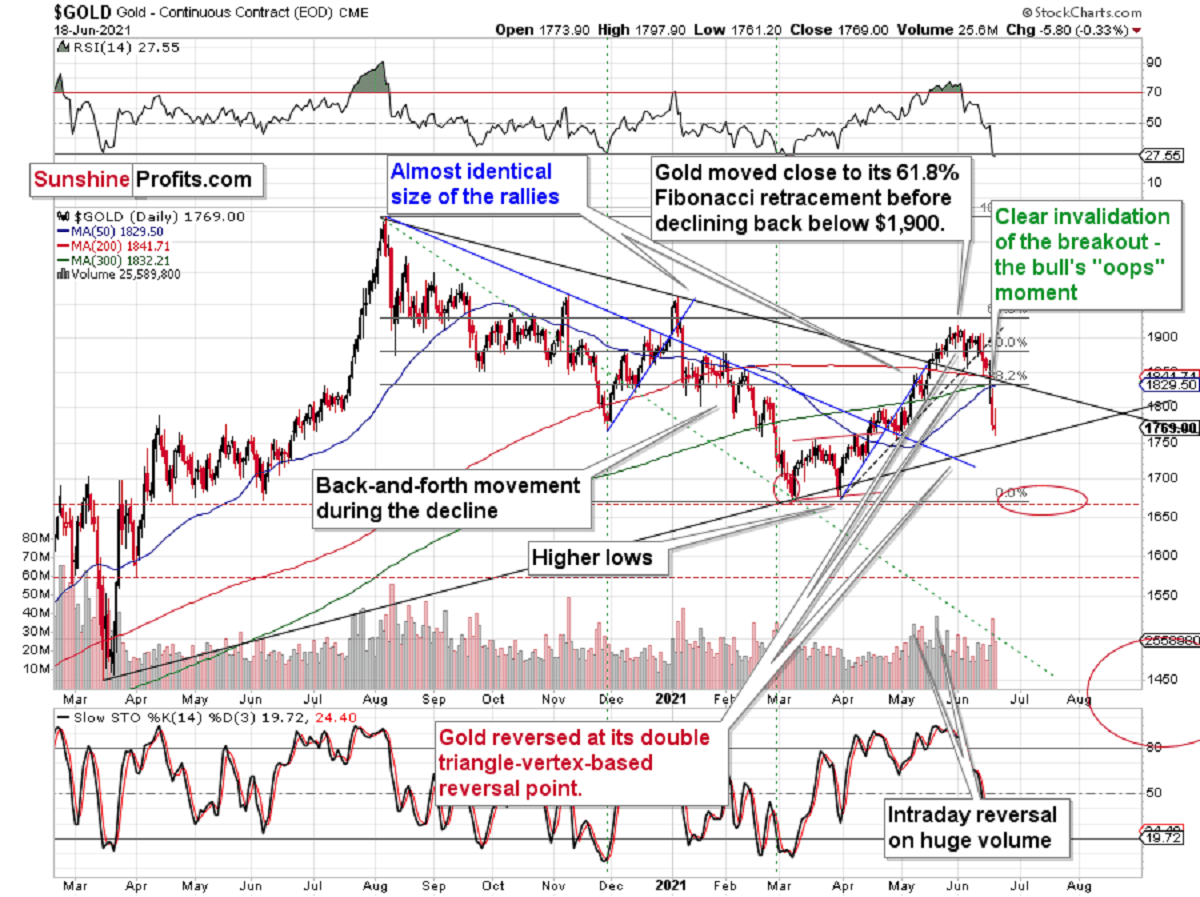
While investors believed that superficial strength indicated clear skies ahead, I warned on Jun. 14 that storm clouds were likely to rain on gold, silver and mining stocks’ parade.
I wrote:
Not only has gold’s RSI fallen precipitously, but the yellow metal’s stochastic oscillator is also at levels that preceded significant historical drawdowns. As a result, while a $100+ decline is likely to materialize in the short term , an even larger decline will likely occur over the medium term. And with the 2008 and 2012-2013 analogues becoming even more valid by the day, gold’s ominous path forward will likely catch many market participants by surprise.
And with the technical realities finally drowning the yellow metal, it was a tough pill to swallow for those that didn’t heed the warning.
Please see below:
As part of the problem, the vast majority of individual investors and – sadly – quite many analysts focus on the trees while forgetting about the forest. However, once one zooms out and looks at the situation from a broad perspective, it’s clear that: “What has been will be again, what has been done will be done again; there is nothing new under the sun.” (-Ecclesiastes 1:9)
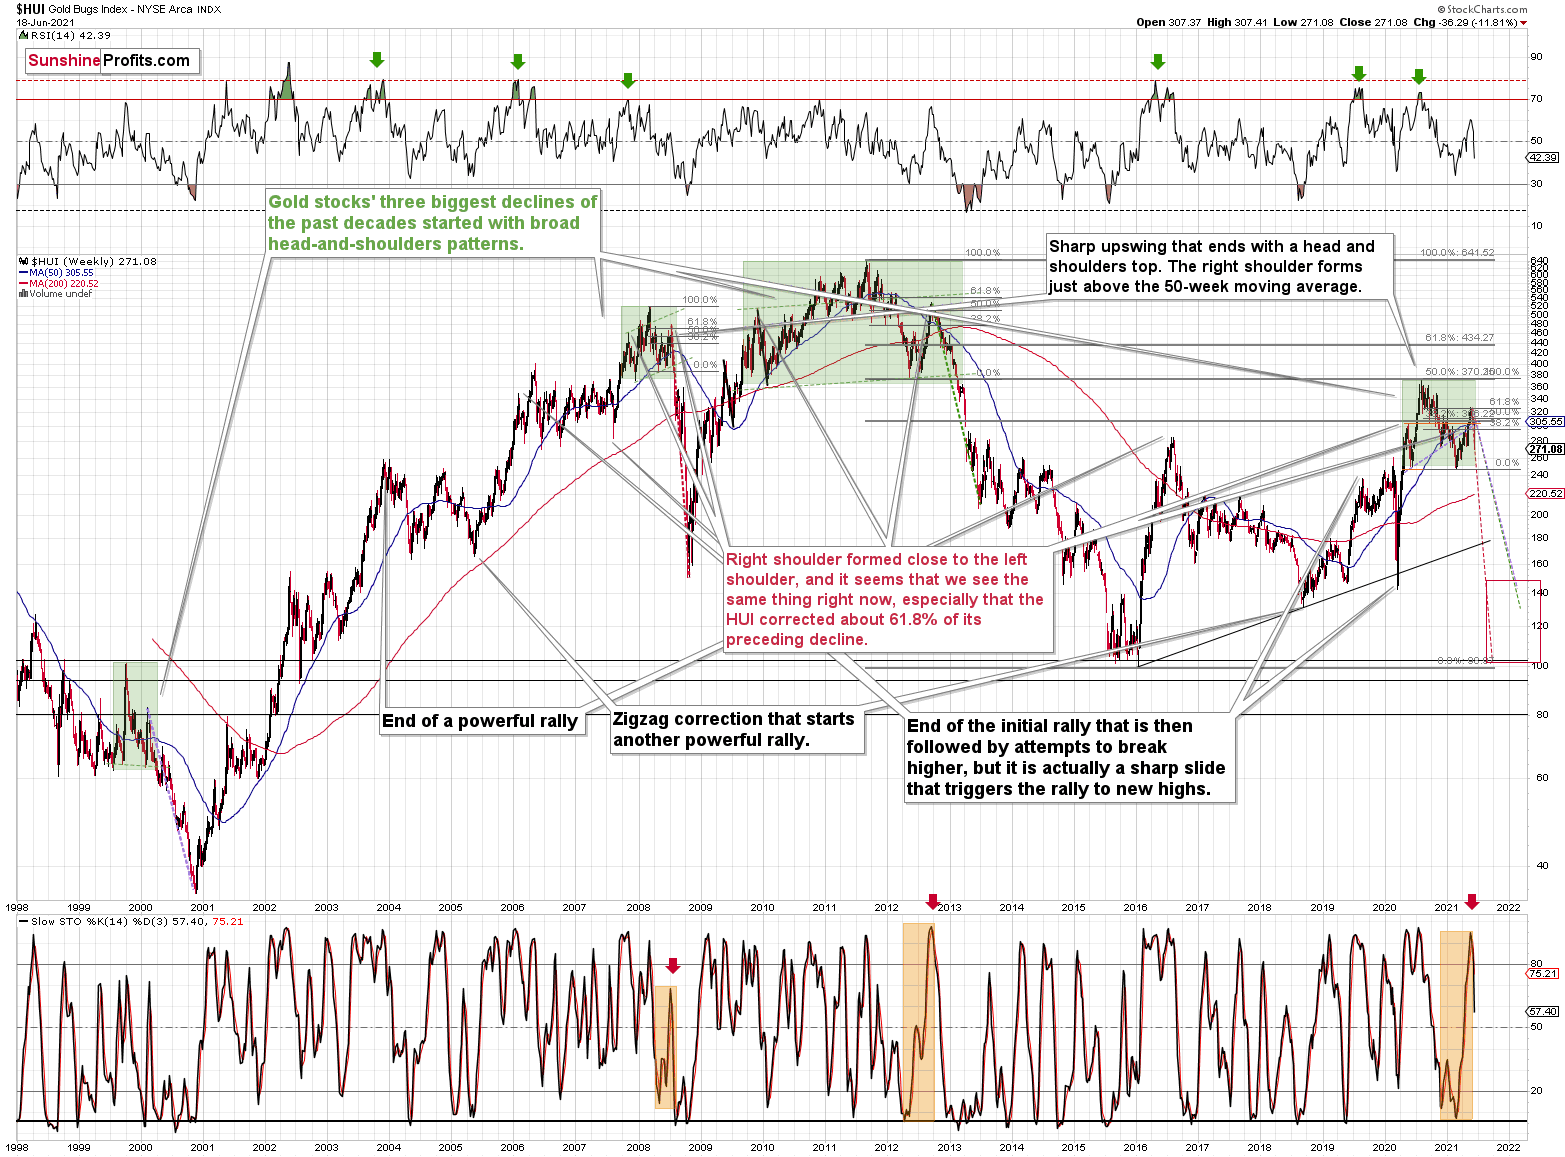
Therefore, while investors often focus all of their attention on the yellow metal, I warned on Jun. 14 that the HUI Index’s ominous behavior signaled significant downside for gold, silver and mining stocks.
I wrote:
With the HUI Index acting as the PMs’ canary in the coal mine, the bearish implications are as clear as day when eyeing the long-term chart. In the past three weeks, two key events unfolded:
- The stochastic oscillator delivered a clear sell signal.
- The self-similarity patterns became increasingly valid.
And with last week’s price action adding further confirmation, investors’ optimism is showing severe cracks in its foundation.
HUI Index Plunges
On top of that, even though the HUI Index plunged by more than 10% last week , the carnage may not be over. Case in point: the HUI Index is in the midst of forming the right shoulder of its bearish head & shoulders pattern, and if completed, could result in a profound decline over the medium term. For context, with gold approaching its late-April bottom and its rising medium-term support line, the yellow metal could bounce at roughly $1,750. In the process, the gold miners may follow suit. However, the bearish implications remain intact over the medium term, and a significant slide is likely to follow.
Please see below:
To explain, if you held firm in 2008 and 2013 and maintained your short positions, you almost certainly realized substantial profits. And while there are instances when it’s wise to exit one’s short positions and re-enter at more attractive prices, the smooth declines of gold, silver, and mining stocks mean that the risk-reward of doing so is tilted toward the downside. Or to put it more bluntly, the prospect of missing out on the forthcoming slide makes exiting the short positions a risky investment decision. For context, we believe that holding the short position is the most prudent course of action. However, if gold, silver and mining stocks become extremely oversold, we may consider covering on a short-term basis.
If that wasn’t enough, I warned previously that the recent plunge was weeks in the making:
I wrote the following about the week start started on May 24 :
What happened three weeks ago was that gold rallied by almost $30 ($28.60) and at the same time, the HUI – a flagship proxy for gold stocks… Declined by 1.37. In other words, gold stocks completely ignored gold’s gains. That shows exceptional weakness on the weekly basis and is a very bearish sign for the following weeks.
To that point, the HUI Index is still following two medium-term historical analogies. To explain, back in 2008, right before a huge slide, in late September and early October gold was still moving to new intraday highs, but the HUI Index was ignoring that, and then it declined despite gold’s rally. However, it was also the case that the general stock market declined then. If stocks hadn’t declined back then so profoundly, gold stocks’ underperformance relative to gold would likely be present but more moderate.
Moreover, in 2012, the HUI Index topped on Sep. 21, and that was just the initial high in gold. At that time the S&P 500 was moving back and forth with lower highs – so a bit more bearish than the current back-and-forth movement in this stock index. And what was the eventual climax? Well, gold moved to new highs and formed the final top (Oct. 5). It was when the S&P 500 almost (!) moved to new highs, and despite both, the HUI Index didn’t move to new highs. Thus, the similarity to how the final counter-trend rally ended in 2012 (and to a smaller extent in 2008) ended is uncanny .
On top of that, the stochastic oscillator (which flashed a clear sell signal ) is singing a similar tune. Not only do these signals often precede massive price declines on their own, but the analogies of 2008 and 2012 serve as confirmation that the huge decline has only just begun and that forecasting lower gold prices is currently justified.
Thus, if history rhymes, as it tends to, the HUI Index will likely decline profoundly and find medium-term support in the 100-to-150 range. For context, high-end 2020 support implies a move back to 150, while low-end 2015 support implies a move back to 100. And yes, it could really happen, even though it seems unthinkable.
The HUI Index retraced a bit more than 61.8% of its downswing in 2008 and in between 50% and 61.8% of its downswing in 2012 before eventually rolling over. Now, in both (2008 and 2012) cases, the final top – the right shoulder – formed close to the price where the left shoulder topped. And in early 2020, the left shoulder topped at 303.02.
That’s why I previously wrote that “it wouldn’t be surprising to see a move to about 300 in the HUI Index”. And that’s exactly what we saw (a move above 320 is still close to 300 from the long-term point of view). To clarify, one head-and-shoulders pattern – with a rising neckline – was already completed, and one head-and-shoulders pattern – with a horizontal neckline – is being completed, but we’ll have the confirmation once miners break to new yearly lows.
The Biggest Declines In The Mining Stocks
Furthermore , three of the biggest declines in the mining stocks (I’m using the HUI Index as a proxy here), all started with broad, multi-month head-and-shoulders patterns. And in all three cases, the size of the declines exceeded the size of the head of the pattern.
As a result, we’re confronted with two bearish scenarios:
- If things develop as they did in 2000 and 2012-2013, gold stocks are likely to bottom close to their early 2020 high.
- If things develop like in 2008 (which might be the case, given the extremely high participation of the investment public in the stock market and other markets), gold stocks could re-test (or break slightly below) their 2016 low.
Keep in mind though: scenario #2 most likely requires equities to participate. In 2008 and 2020, the sharp drawdowns in the HUI Index coincided with significant drawdowns of the S&P 500 . However, with the Fed turning hawkish and investors extremely allergic to higher interest rates, the likelihood of a three-peat remains relatively high.
Let’s zoom in.
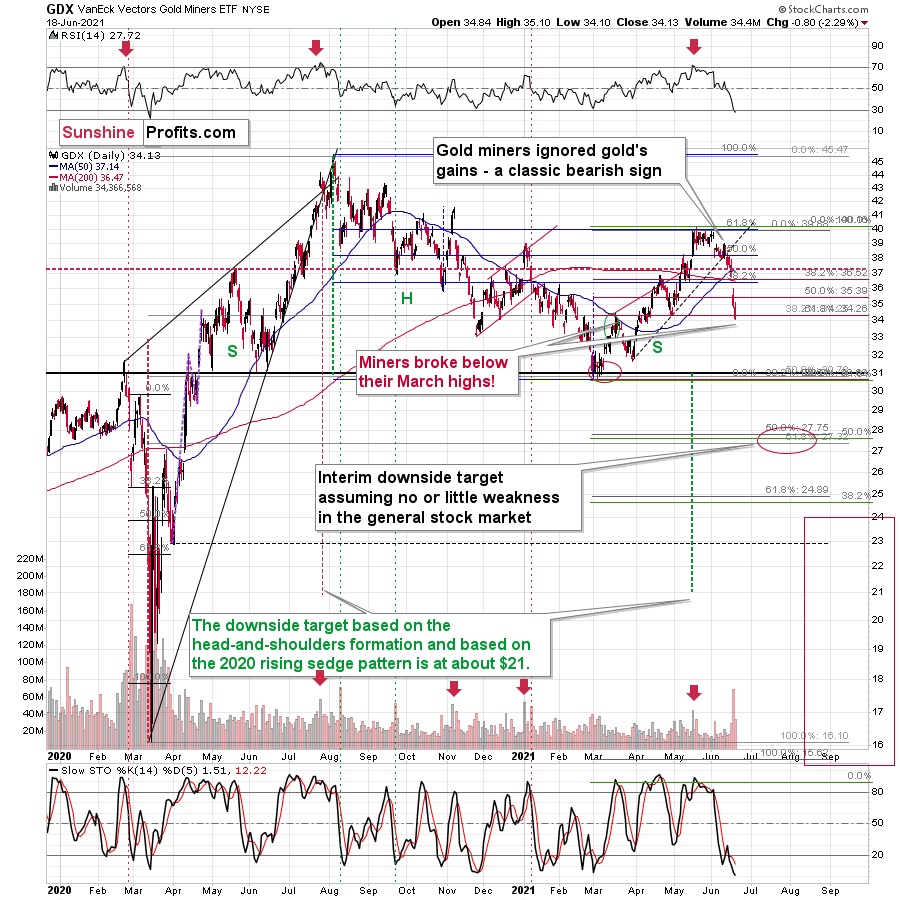
To explain, the senior miners’ weekly decline occurred relatively uninterrupted, with little buying pressure witnessed on Jun. 18. Moreover, not only did the GDX ETF close below its April lows and its March highs, but it also dipped below the 61.8% Fibonacci retracement level. Thus, while the senior miners’ RSI (Relative Strength Index) signals a buying opportunity (by falling below 30), the technical damage (breakdown below the 61.8% Fibonacci retracement) justifies the bearish outlook even in the short run. Of course, I remain on the lookout for this breakdown’s invalidation as it would be a sign of potential strength.
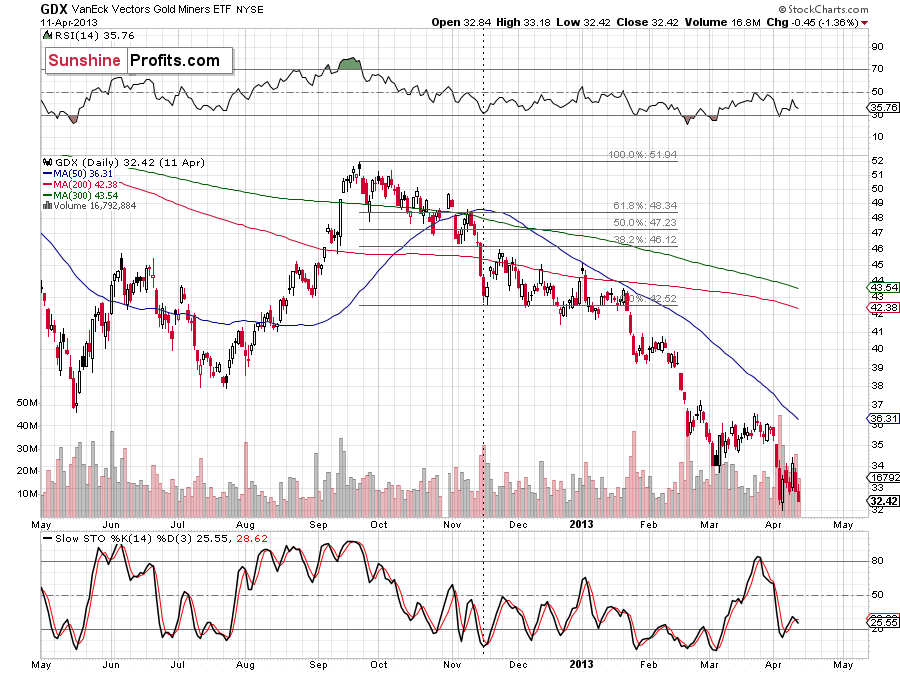
Finally, let’s consider the size of the possible corrective upswing based on the analogy to 2012. Back then, the GDX ETF’s corrective upswing didn’t recapture 61.8% or even 38.2% of its previous decline, and the bullish correction was rather “muted” relative to gold. Thus, the notable detail here is that the GDX ETF started its November 2012 correction with the RSI close to 30, but also when it moved slightly below its previous (August) lows, and the final short-term bottom took place after the second (!) day when it declined on big volume.
So, if history is going to continue to rhyme (which seems likely), even if gold corrects quite visibly, gold stocks’ corrective upswing might not be that significant. If we see “screaming short-term buy signals” or something like that, we might close or even briefly switch to the long side, but for now, the trend remains down.
In conclusion, gold, silver and mining stocks’ plight was a humbling experience for many investors. And while the recent slide highlights the importance of investing without emotion, we remain confident that the precious metals will soar once again. However, because secular bull markets don’t occur in a straight line, based on the similarity to how similar situations developed in the past, a final profound decline will likely occur before the metals resume their resurgence. As a result, even though gold, silver, and mining stocks are poised to shine in the long run, I still think that short positions in the precious metals sector – especially in the junior miners – currently remain attractive from a risk-reward perspective.
Thank you for reading our free analysis today. Please note that the above is just a small fraction of today’s all-encompassing Gold & Silver Trading Alert. The latter includes multiple premium details such as the targets for gold and mining stocks that could be reached in the next few weeks. If you’d like to read those premium details, we have good news for you. As soon as you sign up for our free gold newsletter, you’ll get a free 7-day no-obligation trial access to our premium Gold & Silver Trading Alerts. It’s really free – sign up today.
Przemyslaw Radomski, CFA
Founder, Editor-in-chief
Sunshine Profits: Effective Investment through Diligence & Care
All essays, research and information found above represent analyses and opinions of Przemyslaw Radomski, CFA and Sunshine Profits’ associates only. As such, it may prove wrong and be subject to change without notice. Opinions and analyses are based on data available to authors of respective essays at the time of writing. Although the information provided above is based on careful research and sources that are deemed to be accurate, Przemyslaw Radomski, CFA and his associates do not guarantee the accuracy or thoroughness of the data or information reported. The opinions published above are neither an offer nor a recommendation to purchase or sell any securities. Mr. Radomski is not a Registered Securities Advisor. By reading Przemyslaw Radomski’s, CFA reports you fully agree that he will not be held responsible or liable for any decisions you make regarding any information provided in these reports. Investing, trading and speculation in any financial markets may involve high risk of loss. Przemyslaw Radomski, CFA, Sunshine Profits’ employees and affiliates as well as members of their families may have a short or long position in any securities, including those mentioned in any of the reports or essays, and may make additional purchases and/or sales of those securities without notice.


