
S&P Global Market Intelligence has published a key Metal and Mining research report on greenhouse gas emissions in gold mines.
Q2 2021 hedge fund letters, conferences and more
S&P Global Market Intelligence reviewed 2020 sustainability reports from more than 90 leading gold mines globally to conduct a year-over-year comparison of greenhouse gas emissions. In 2020, gold output was down 5% globally compared with 2019, largely due to lockdowns imposed to curb the COVID-19 pandemic. The combined output from primary gold mines that accounted for around 35% of global supply in 2020 fell just over 1% from 2019 production. Throughput from these mines also fell around 1%, from 847 million tonnes of ore processed in 2019 to 840 Mt in 2020. Meanwhile, emissions from these operations increased less than 1%, from 27.7 million tonnes of CO2 equivalent, or tCO2e, in 2019 to 27.6 MtCO2e in 2020.
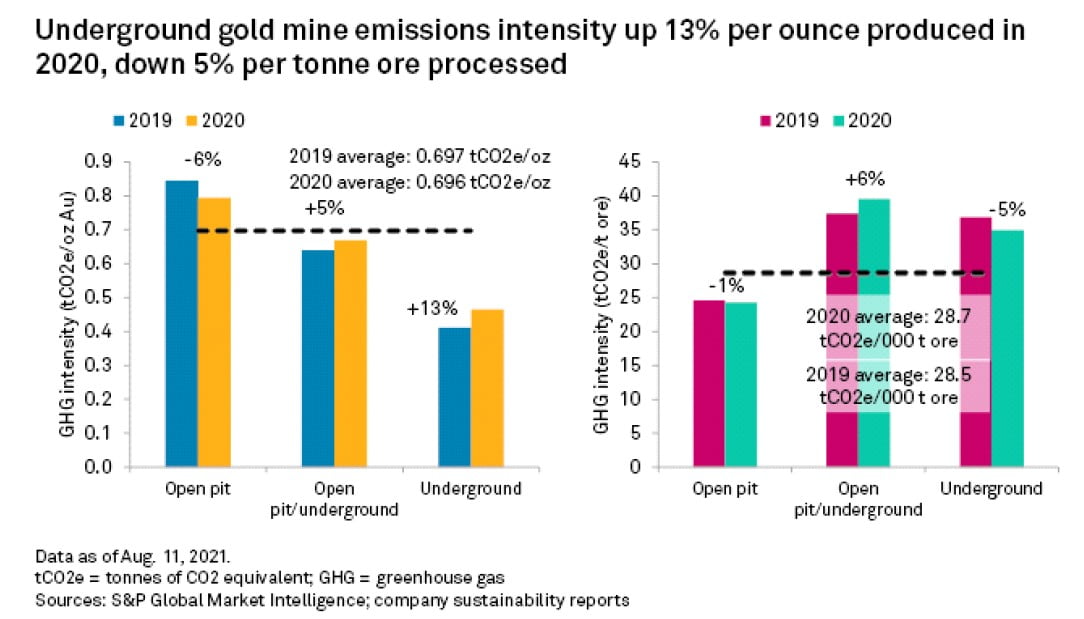
Emissions intensity averaged 0.697 tCO2e per ounce of gold produced, a negligible decrease year over year. On a per tonne of throughput basis, emissions intensity increased incrementally, up less than 1% to 28.7 tCO2e per thousand tonnes of ore processed.
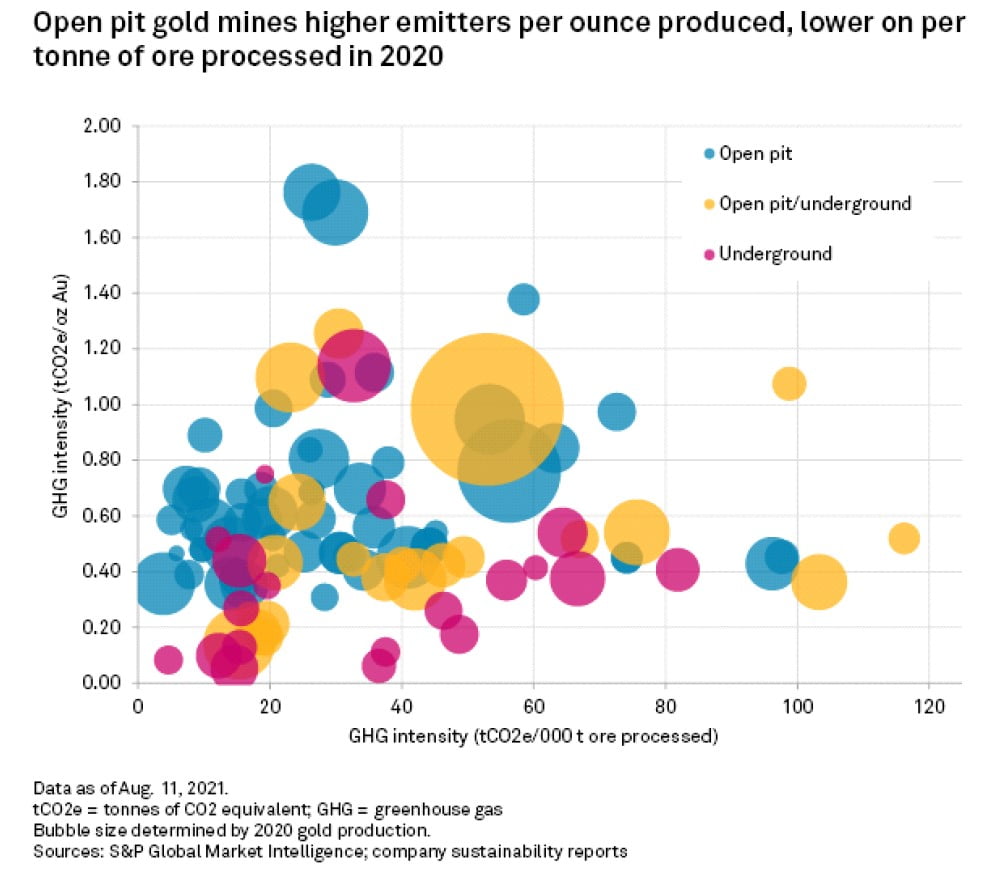
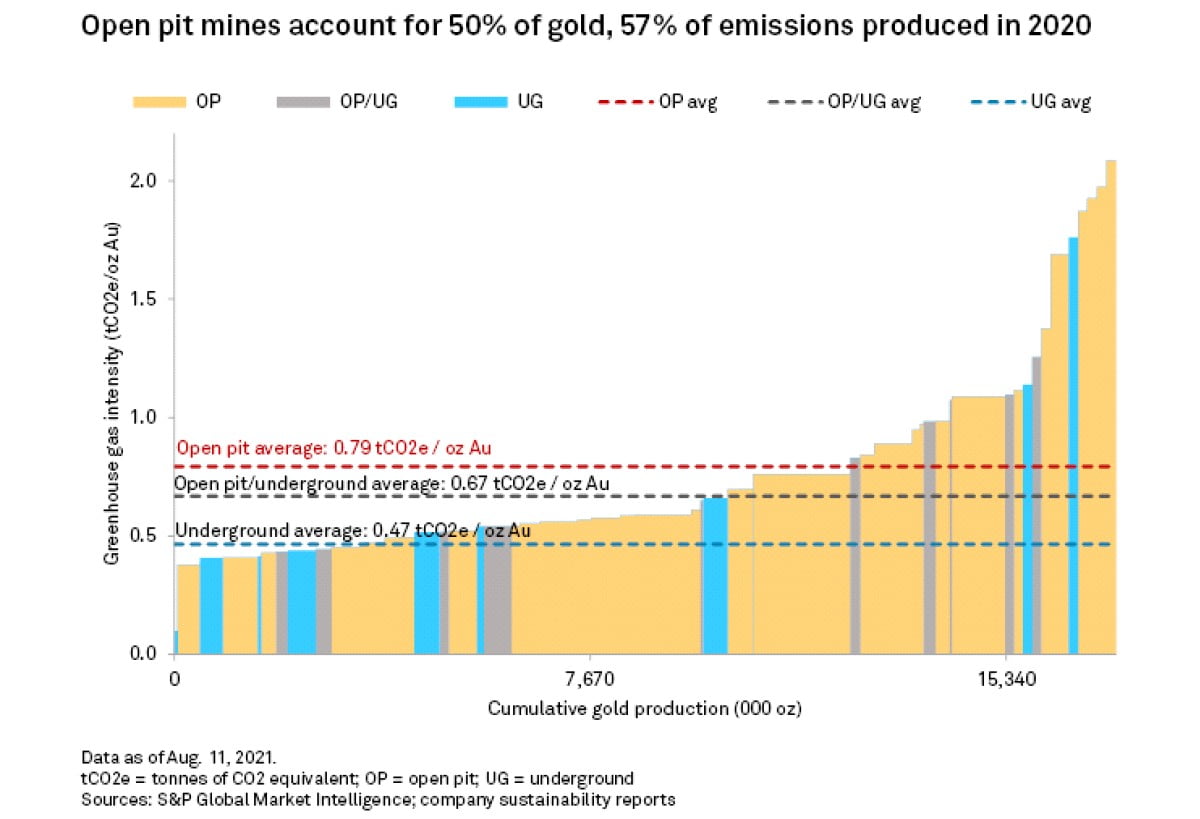
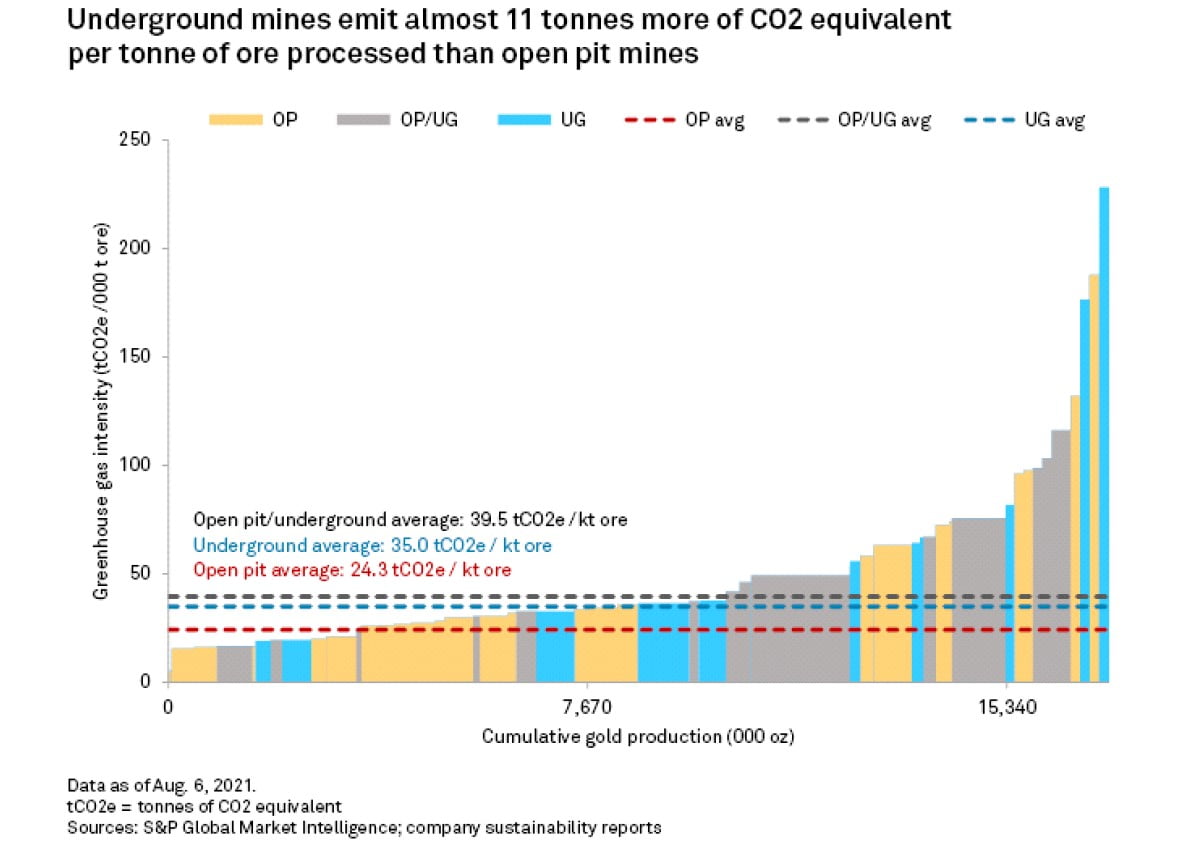
Analysis of 2019 data from 96 gold mines highlighted clear differences in the emissions intensity across mine types, with open pit mines exhibiting a higher intensity on a per ounce of gold produced but a lower intensity on a per tonne of ore processed basis.
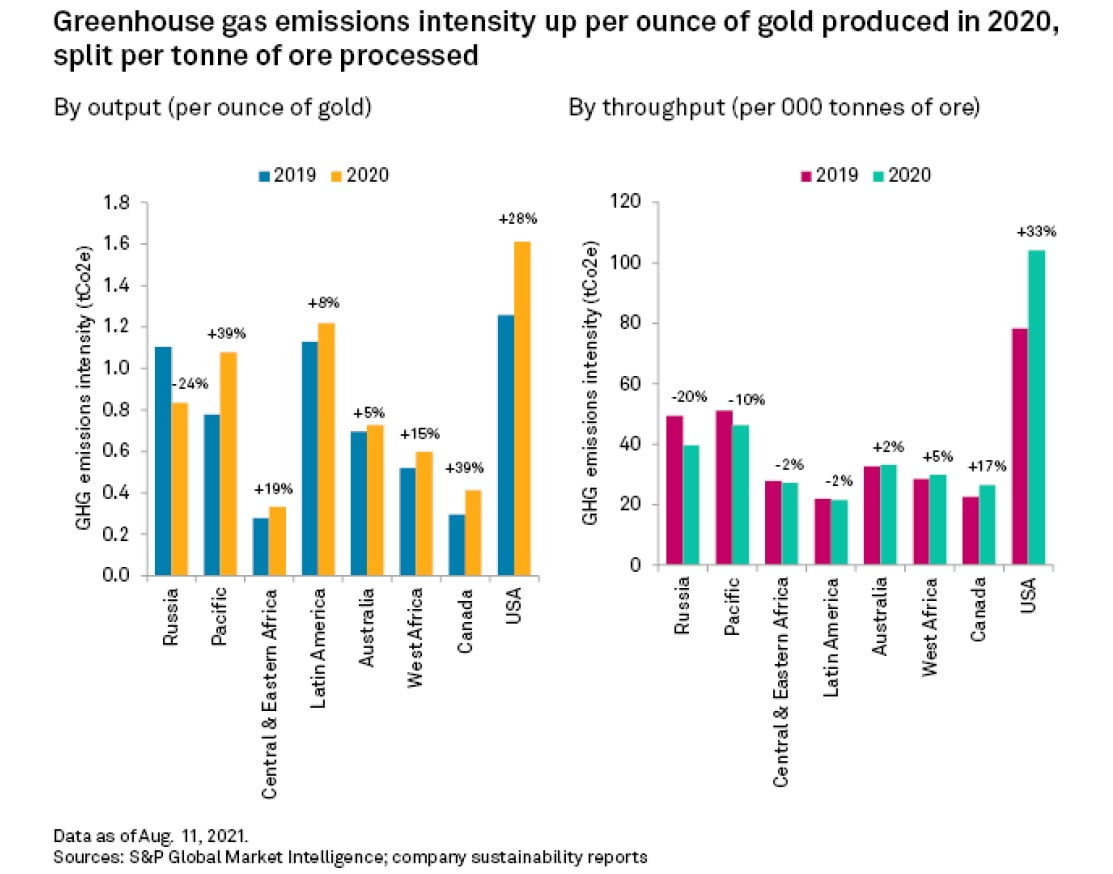
Increases in emissions intensity were not uniform across mine types and jurisdictions. On a per ounce basis, emissions at open pit mines decreased 6% year over year, but increased 13% and 5% at underground and combined operations respectively. On a per tonne basis, the open pit mine emissions decline was more understated at 1%, while underground operation emissions decreased 5%.
Grade Key Factor In Shifting Per Ounce Emissions Intensity
Though there exists a degree of nuance within the data regarding the reasons behind the increases in emissions intensity, the most important factor is the ore grade.
Grades at open pit mines were higher year over year, which contributed to the decrease in emissions intensity per ounce of gold produced. Throughput and total emissions were both down at open pit mines, by 2% and 5% respectively; however, with emissions declining faster than throughput year over year, the intensity per tonne of ore processed declined 1%. At underground mines, there was a significant decline in the grade of ore processed, from an average of 3.25 grams of gold per tonne in 2019 to 2.64 g/t in 2020. Emissions increased by a modest 2% at those mines, but with less gold produced per tonne of ore processed, emissions intensity on a per ounce basis increased far more.
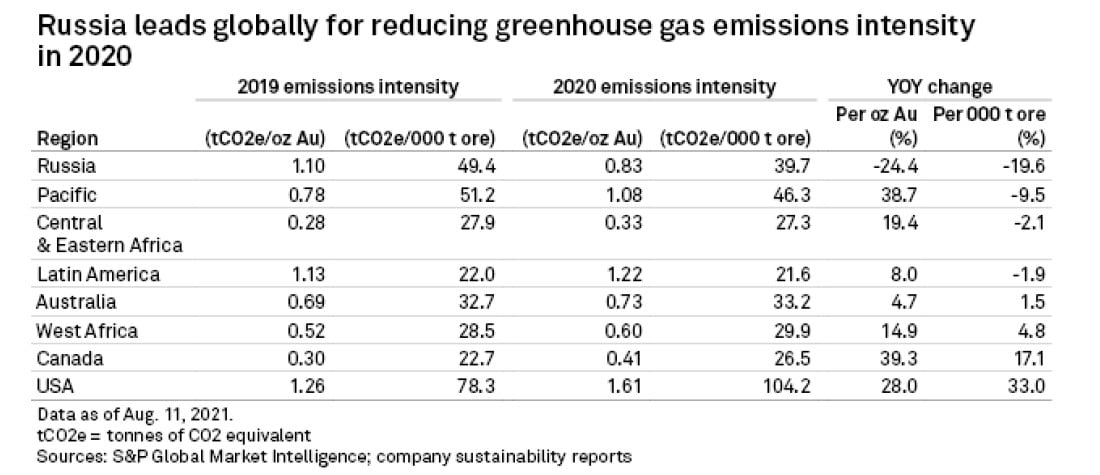
In Canada, where nearly 50% of production came from underground mines in 2020, a period of lockdown in April contributed as much as 23% to a drop in throughput at Newmont Corp.’s Eleonore mine in Quebec, which is the largest underground mine in Canada by 2020 output. Consistent with the decline in throughput, emissions from the mine fell 22% year over year. Declining ore grade, however, was the bigger driver in Canada. At Eleonore, the grade at the mill was 10% lower year over year, which, combined with the lockdown, contributed to a 46% decline in gold output in 2020. This ultimately led to a 44% increase in Eleonore’s emissions intensity per ounce, despite a relatively flat 1% increase in emissions intensity per tonne of ore processed.
There was, however, more behind Canada’s overall 39% and 17% respective increases in per ounce and per tonne emissions intensities. For example, at Meadowbank, Nunavut’s largest gold mine, the addition of the Amaruq satellite contributed to increases across the board: throughput rose 13%, grades improved almost 6% and gold production increased 23%. Consistent with the increase in throughput and including trucking of additional ore 57 kilometers from the Amaruq deposit to the Meadowbank mill, emissions were up 15%. With output increasing by a greater margin than emissions, Meadowbank’s per ounce emissions intensity decreased 7% while its per tonne intensity was up marginally at less than 2%.
Decline In Russian Emissions Intensity Lacks Clarity
A global leader in emissions intensity change was Russia. On a per ounce basis, Russia’s average emissions intensity was down 24% year over year. Certainly, a 9% increase in grade was instrumental in lowering the intensity. With the region’s per tonne emissions intensity also inching downward year over year, however, grade was clearly not the only driver. The largest gold miner in the country, PJSC Polyus, led the decline in intensity. Actual emissions fell between 18% and 58% at four of Polyus’s operations, including a 23% drop at its largest, the Olimpiada and Blagodatnoye mines, which report combined emissions. Polyus has been implementing local initiatives to reduce emissions across its operations; however, due to the company’s revised methodology behind the calculation of Scope 1 emissions, it is still unknown whether actual emissions from Olimpiada and Blagodatnoye declined year over year.
With gold output slightly more than half that of top miner Polyus in 2020, Russia’s second-largest producer, Polymetal International PLC, reported an emissions increase of nearly 44% year over year, largely reflecting a scaling-up of operations, namely at the Kyzyl and Varvara mines in Kazakhstan. Throughput was up 22% and the average grade was also up. With the increase in emissions outpacing the increase in gold output and ore processed, the company’s emissions intensities were up on both a per ounce and a per tonne basis, by 37% and 18% respectively in 2020.
Endeavour Mining PLC’s Agbaou mine saw a 58% increase in emissions intensity in 2020, which contributed to a regional increase of around 5% in West Africa. Grade was down 21%, while additional material was mined from satellite pits located farther from the processing facilities, adding to higher fuel consumption. Endeavour divested Agbaou to Dubai-based Allied Gold Corp in January 2021.
Barrick Gold Corp.’s Kibali mine, one of Africa’s largest gold mines, saw emissions decline 18% year over year in 2020. The company commissioned a 9-MW battery support system for Kibali’s power grid in 2020, which stabilized power at the mine and reduced emissions. Additionally, Kibali is increasing its reliance on hydroelectric power at the mine — projects that serve the dual purpose of lowering emissions while also reducing power costs.
Low Ore Grades, Fossil Fuels Keep US Emissions Intensity High
Barrick’s Nevada Operations joint venture with Newmont is by far the greatest emitter in the United States. The joint venture had 2020 emissions of 3.6 MtCO2e — a 25% increase year over year — due to a rise in Scope 2 emissions from electricity purchased rather than produced on site. As part of their commitments to reducing emissions, Barrick and Newmont are currently converting the mine’s coal-fired TS Power Plant to generate power from natural gas. Once complete, the transition should eliminate around 650,000 tCO2e, or 24% of the site’s 2020 Scope 1 emissions.
Kinross Gold Corp.’s Fort Knox mine in Alaska further increased the U.S. average. While Kinross’s data is released later than others so that 2019 data is used for this analysis, emissions from the mine are already on the high side of the spectrum, with a combined 418,000 tCO2e in Scope 1 and Scope 2 emissions in 2019, a 4% decline over 2018. With a 2019 grade of 0.31 g/t Au, however, the mine has one of the lowest grades of those included in the study — far below the U.S. average of 1.20 g/t Au — resulting in a high amount of waste to be moved.
On Average, Emissions Intensity Little Changed Year Over Year, But Change Is Expected
Despite fluctuations at many operations, emissions intensities globally remained relatively stable on average in 2020, just below 33 tCO2e per thousand tonnes of ore processed. On a per ounce of gold produced basis, falling grades and a period of lockdown in 2020 increased emissions intensities across some operations, but year-to-year fluctuations in actual output are common, particularly due to grade changes.
The push to reduce carbon emissions from gold mining remains at an early stage. Given the scale of their operations, the largest producers have the largest capacity to upgrade their operations to reduce their environmental impact. Most of the top producers are currently upgrading facilities to reduce their dependence on fossil fuels in the transition to renewable energy sources, or at the least to transition to cleaner fuels such as by shifting from coal-fired plants to natural gas.
The top five gold producers — Newmont, Barrick Gold, AngloGold Ashanti Ltd., Polyus and Kinross — accounted for 53% of the emissions evaluated in this study and 56% of the gold production. Each has committed to reducing emissions by 20%-30% in accordance with the 2016 Paris Climate Accord. If those top five producers reduce their emissions by an average of 25% by 2030, and assuming they process a similar amount of ore as they did in 2020, emissions will decrease from 27 tCO2e in 2020 to 20 tCO2e in 2030 per thousand tonnes of ore processed.
This article was published by S&P Global Market Intelligence and not by S&P Global Ratings, which is a separately managed division of S&P Global.
Article By Christopher Galbraith, S&P Global Market Intelligence


