After gold ran out of steam, the market was flooded by a wave of invalidated breakouts. Can anything keep the precious metals from nosediving?
Remember when gold tried to rally above $2,000? It was just a week ago. Now, it’s likely about to drop below $1,900, silver and mining stocks are sliding too. While the white metal has been weak for a while now, mining stocks finally woke up to the reality and appear to be catching up with gold’s and stocks’ declines.
Q1 2022 hedge fund letters, conferences and more
Boy, they sure have some catching up to do! Even though last week’s ~10% decline might appear terrific, let’s keep in mind that this is most likely just the beginning of a huge slide, probably quite similar to what we saw in 2012, 2013, and in 2008.
Let’s start today’s analysis with a quick look at changes in the long-term HUI Index chart – the flagship proxy for gold stocks.
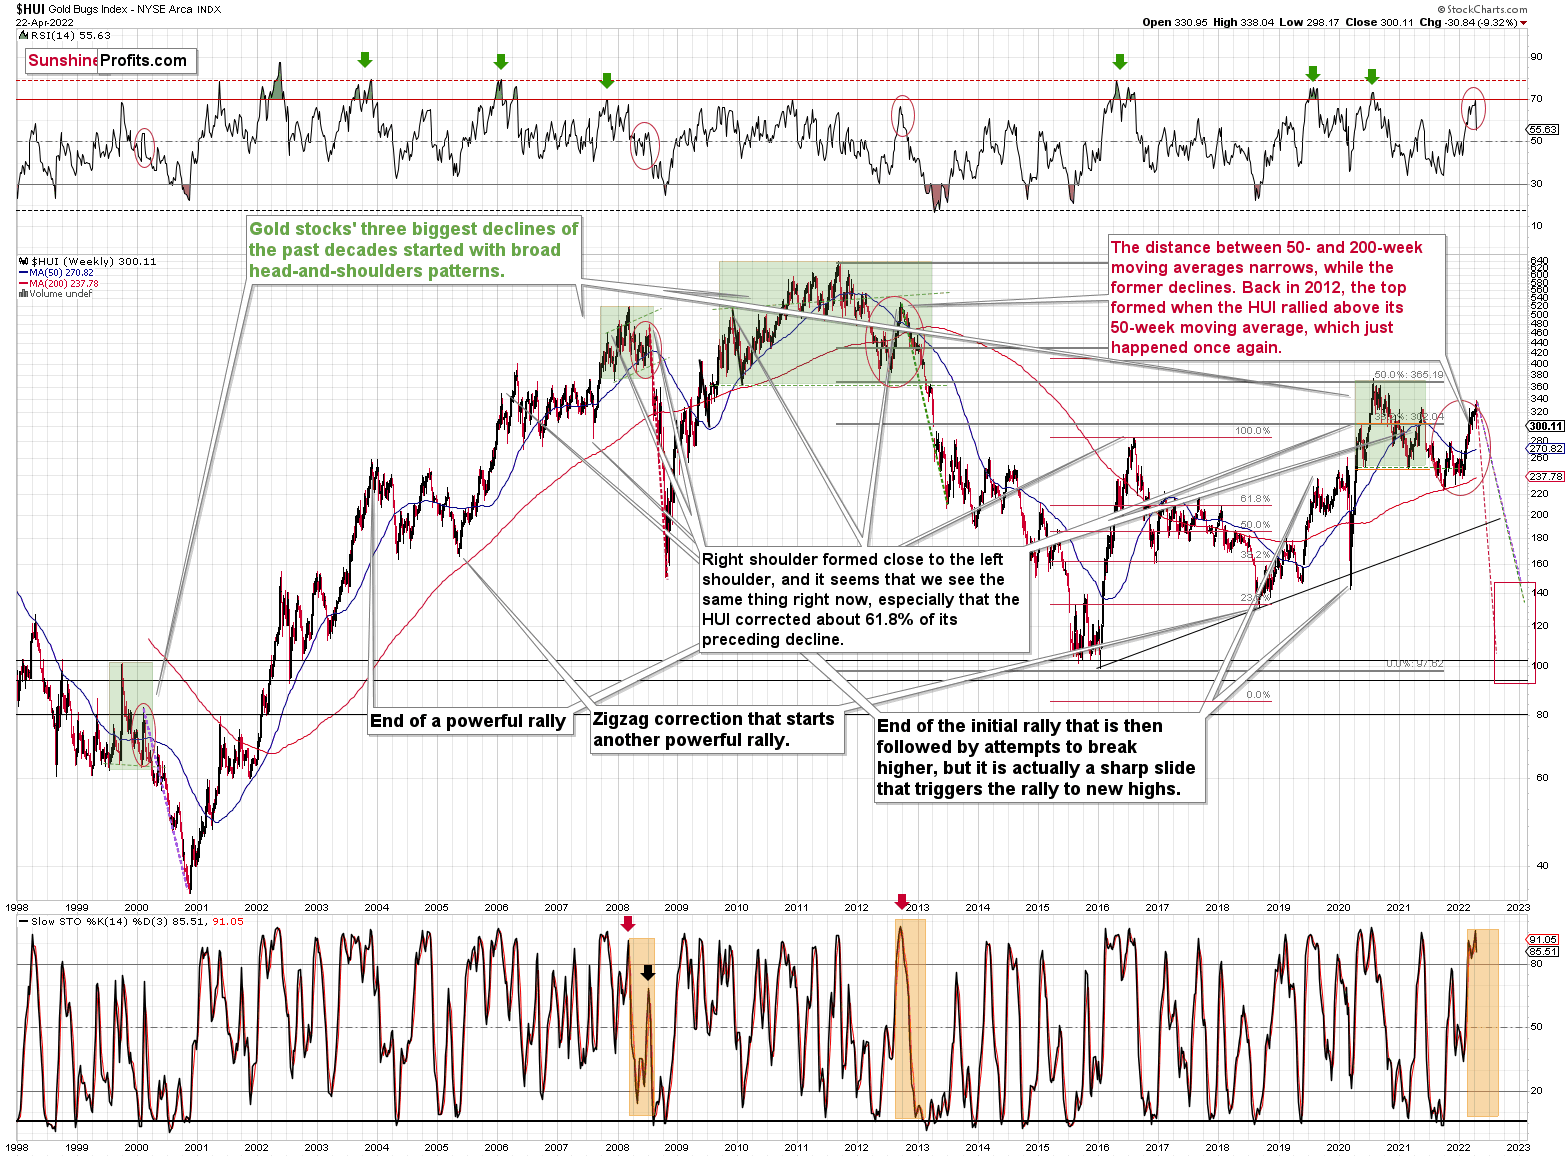
We saw a powerful weekly reversal, a decline in the RSI indicator from about 70, which confirmed the previous sell signal, and a fresh medium-term sell signal from the stochastic indicator.
In particular, the weekly reversal and the sell signal from stochastic are important, as they closely link last week with what we saw right after the final top in 2008 and 2012.
History is likely about to rhyme, and the implications are extremely bearish for mining stocks for the next few months.
Let’s zoom in.
While senior gold stocks declined by a bit less than 10%, junior miners fell by a bit more than 10% last week.
However, that’s the least important fact about this sector.
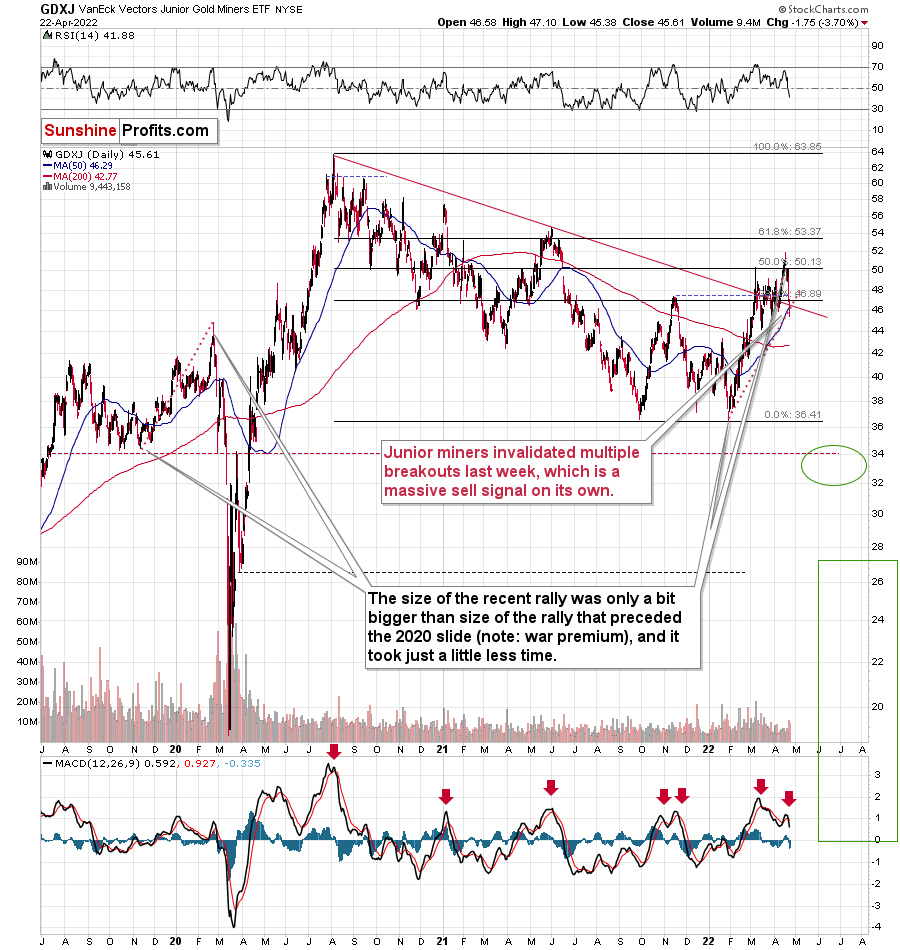
The key thing is that practically all the seemingly bullish breakouts that we saw recently were just invalidated.
The breakout above the declining red resistance line was invalidated.
The breakout above the late-2021 high was invalidated.
The breakout above the 50% Fibonacci retracement level based on the 2020-2022 decline had been (earlier) invalidated.
The breakout above the upper border of the previous triangle pattern was invalidated.
The breakout above the lower border of the previous triangle pattern was invalidated.
That’s a sell signal on top of a sell signal, on top of a sell signal, on top of a sell signal, on top of a sell signal.
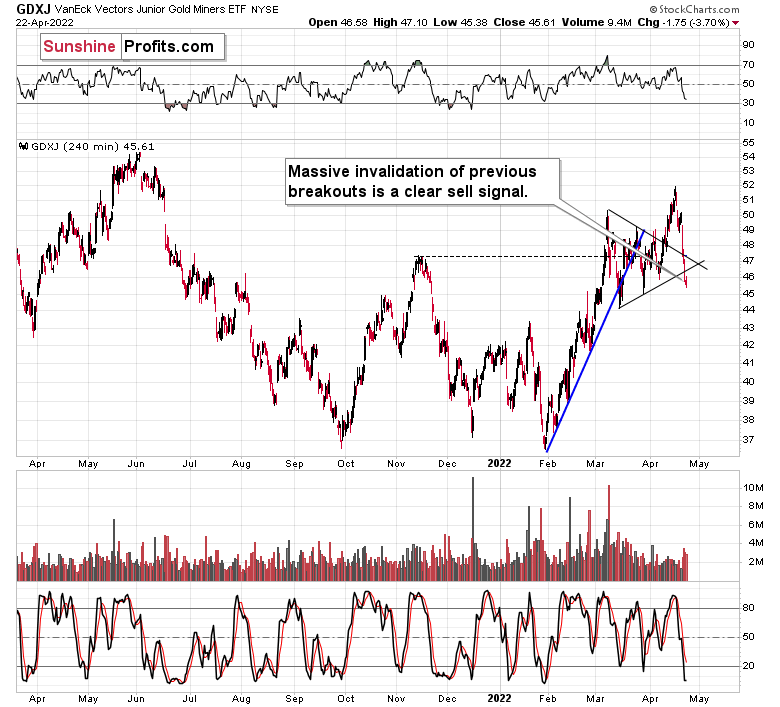
We saw sell signals from the GDXJ-based MACD indicator too.
Speaking of the triangle on the above chart, its vertex is at the end of April, so we might see some kind of turnaround then – perhaps a volatile comeback, which is then followed by another – even bigger – slide.
This would fit the gold chart too.
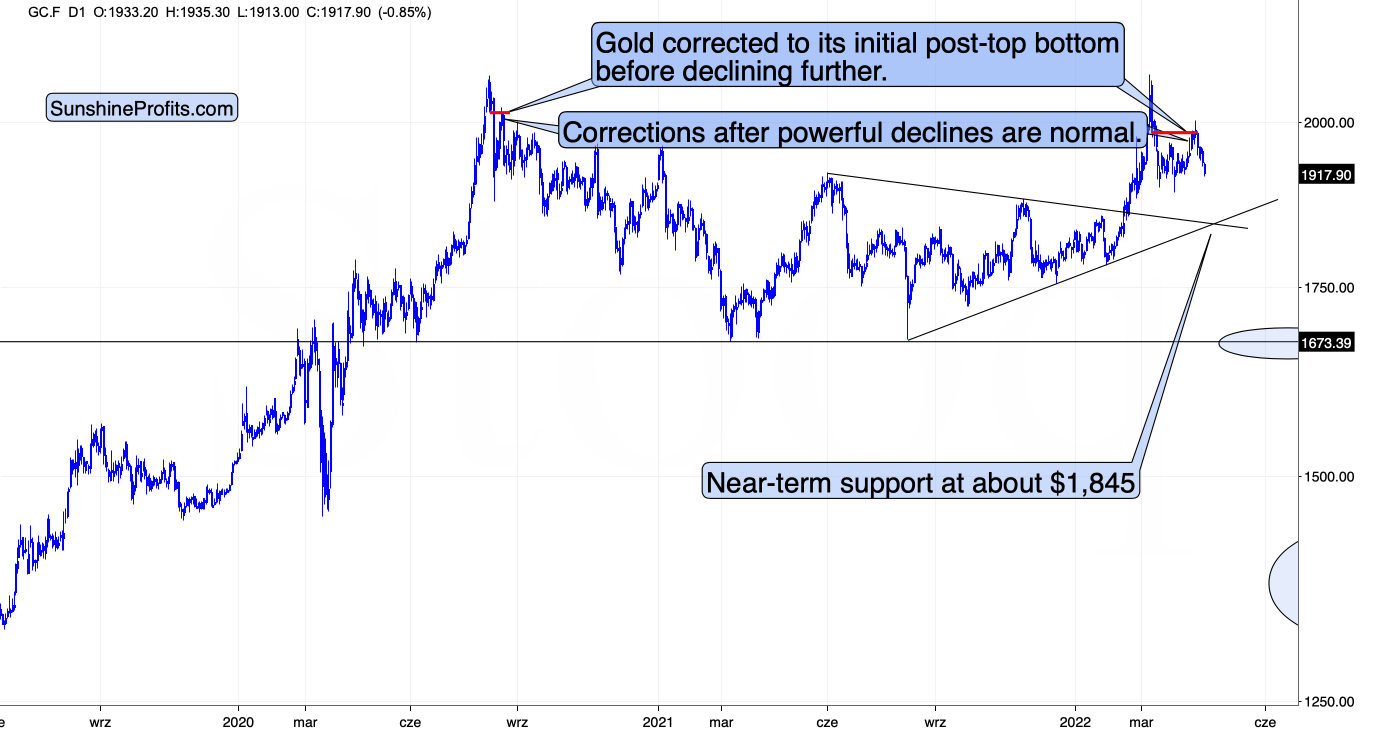
Gold has a triangle-vertex-based reversal point nearby, so they both confirm each other.
In the case of gold, please note how it followed its self-similarity to the post-2020 top trading patterns. The yellow metal moved slightly above its initial post-top bottom, and then it immediately turned south.
The support lines cross at about $1,845, so that’s where we might see the next short-term rebound, but let’s keep in mind that it’s not likely to be anything more than that – a corrective rebound that is then followed by another move lower.
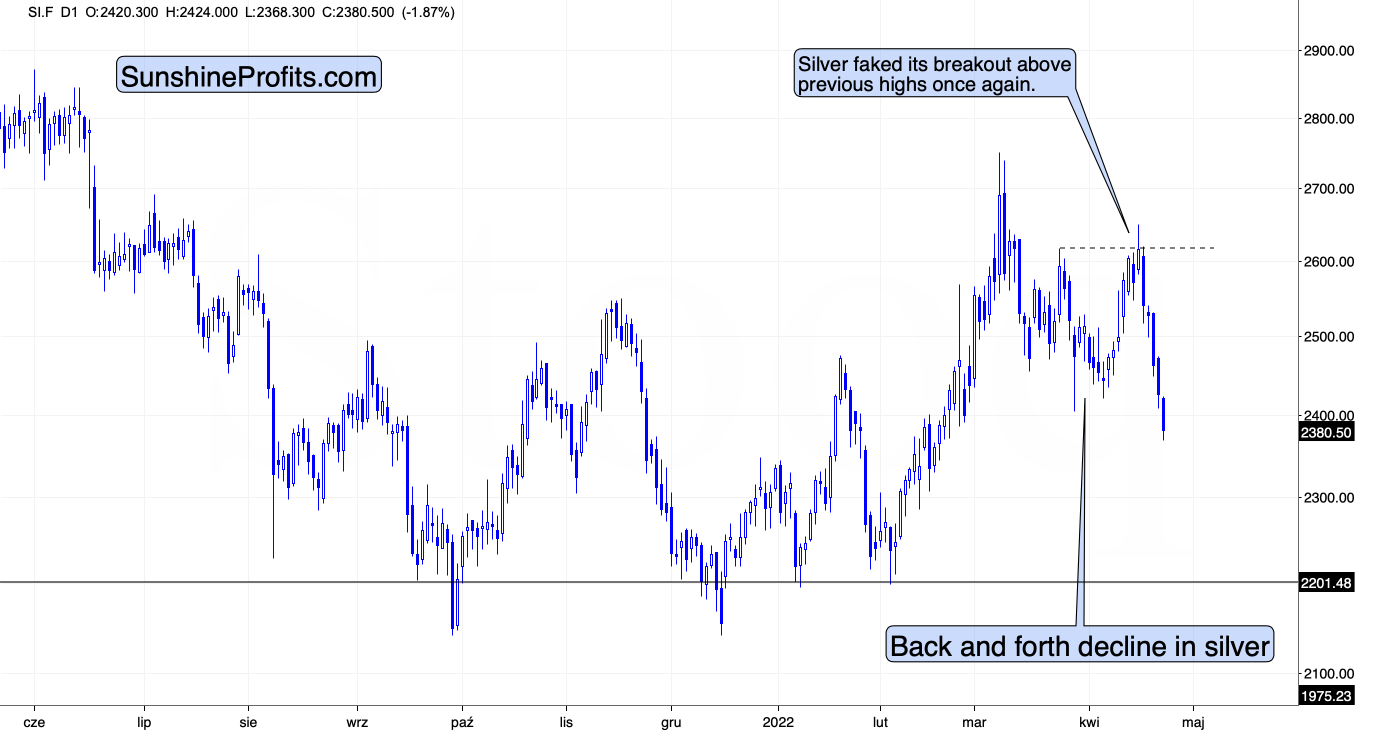
Silver declined profoundly recently, and just like miners, it invalidated multiple previous breakouts. Most interestingly, though, it now clearly invalidates the breakout above its January 2022 high.
The next strong support is based on the previous lows, close to the $22 level. That’s where silver might correct before moving much lower.
Why are mining stocks and silver declining so much nowadays?
It is quite likely due to their connection with the general stock market.
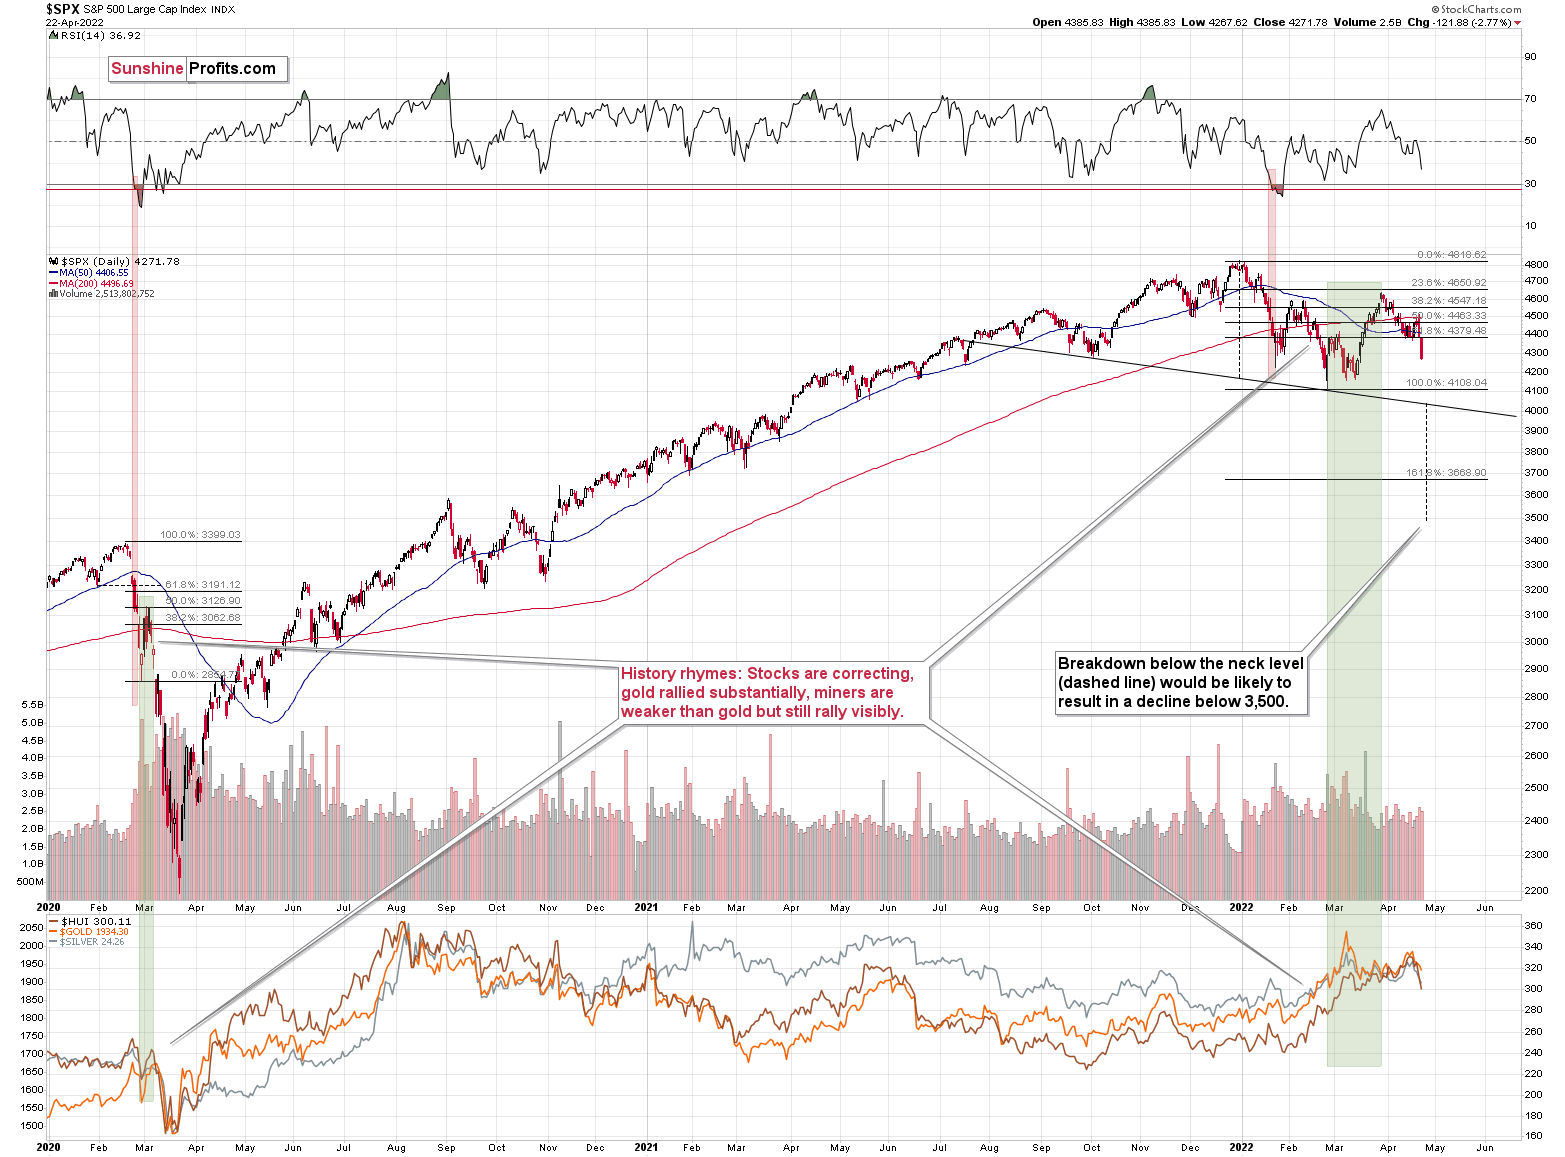
I’ve been writing about the stock market’s incoming demise for quite some time, and that’s what we’re finally seeing. Both silver and miners (especially junior miners) are responding accordingly.
Provided that stocks continue to decline, silver and miners are likely to fall even more than gold.
Let’s keep in mind what happened in the previous cases when stocks declined profoundly – in early 2020 and in 2008. Miners and silver declined in a truly epic manner, and yes, the same is likely to take place in the following months, as markets wake up to the reality, which is that the USD Index and real interest rates are going up.
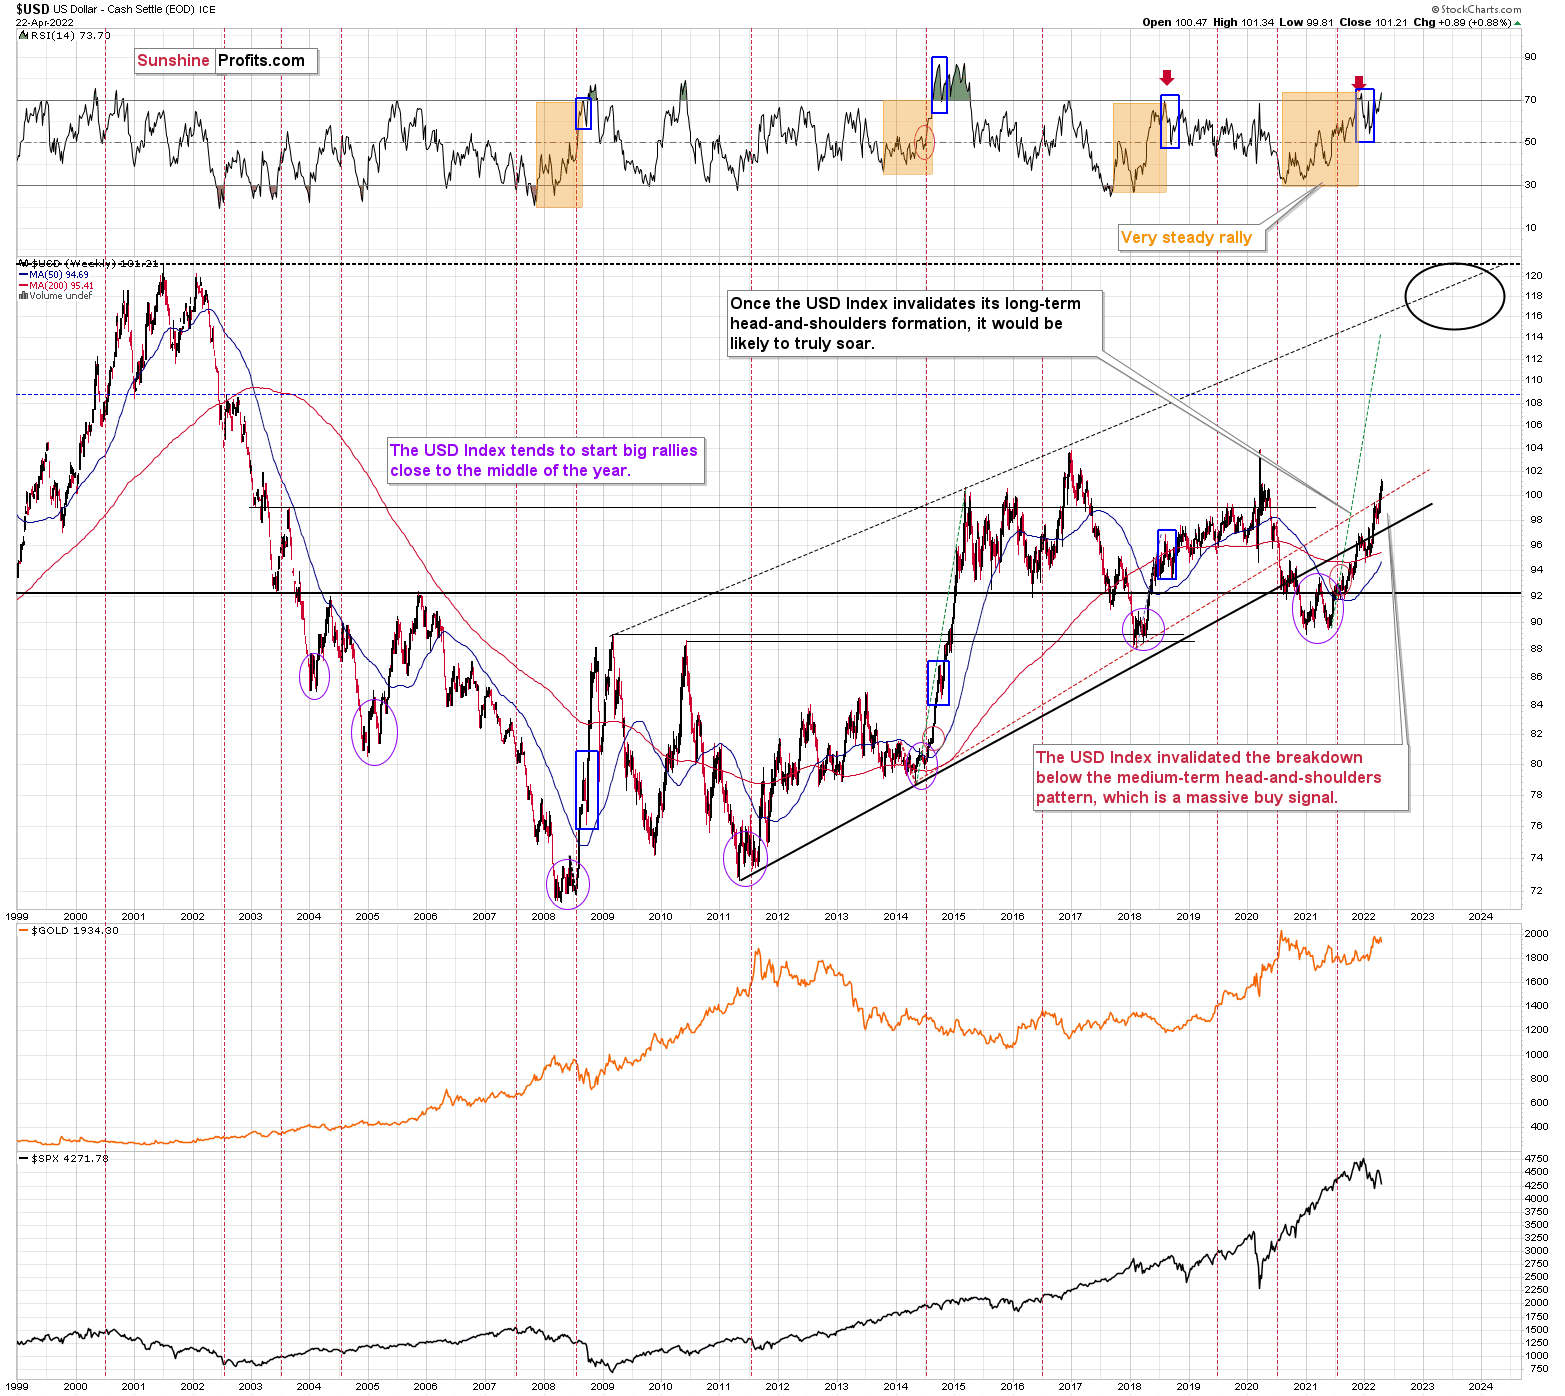
Speaking of the USD Index, after invalidating the breakout below the multi-year head-and-shoulders pattern, the USDX is poised to soar, just like I’ve been expecting it to do for more than a year ago.
The RSI is above 70, but since the USDX is in a medium-term rally and is already after a visible correction, it can rally further. Please note that we saw the same thing in 2008 and in 2014. I marked the corrections with blue rectangles.
The next strong resistance is at the previous highs – close to the 104 level.
It doesn’t mean that the USD Index’s rally is likely to end there. It’s not – but the USDX could take a breather when it reaches 104. Then, after many investors think that the top has been reached as the USDX corrects, the big rally is likely to continue.
All in all, the technical picture for mining stocks is extremely bearish for the following months, even though we might see a short-term correction close to the end of April.
Thank you for reading our free analysis today. Please note that the above is just a small fraction of today’s all-encompassing Gold & Silver Trading Alert. The latter includes multiple premium details such as the targets for gold and mining stocks that could be reached in the next few weeks. If you’d like to read those premium details, we have good news for you. As soon as you sign up for our free gold newsletter, you’ll get a free 7-day no-obligation trial access to our premium Gold & Silver Trading Alerts. It’s really free – sign up today.
Przemyslaw Radomski, CFA
Founder, Editor-in-chief
Sunshine Profits: Effective Investment through Diligence & Care
All essays, research and information found above represent analyses and opinions of Przemyslaw Radomski, CFA and Sunshine Profits’ associates only. As such, it may prove wrong and be subject to change without notice. Opinions and analyses are based on data available to authors of respective essays at the time of writing. Although the information provided above is based on careful research and sources that are deemed to be accurate, Przemyslaw Radomski, CFA and his associates do not guarantee the accuracy or thoroughness of the data or information reported. The opinions published above are neither an offer nor a recommendation to purchase or sell any securities. Mr. Radomski is not a Registered Securities Advisor. By reading Przemyslaw Radomski’s, CFA reports you fully agree that he will not be held responsible or liable for any decisions you make regarding any information provided in these reports. Investing, trading and speculation in any financial markets may involve high risk of loss. Przemyslaw Radomski, CFA, Sunshine Profits’ employees and affiliates as well as members of their families may have a short or long position in any securities, including those mentioned in any of the reports or essays, and may make additional purchases and/or sales of those securities without notice.


