
The Consumer Price Index (CPI) provides a steady indication of how inflation is affecting the economy. This big picture number is useful for policymakers and professionals in the financial sector, but most people experience inflation at the cash register or checkout screen.
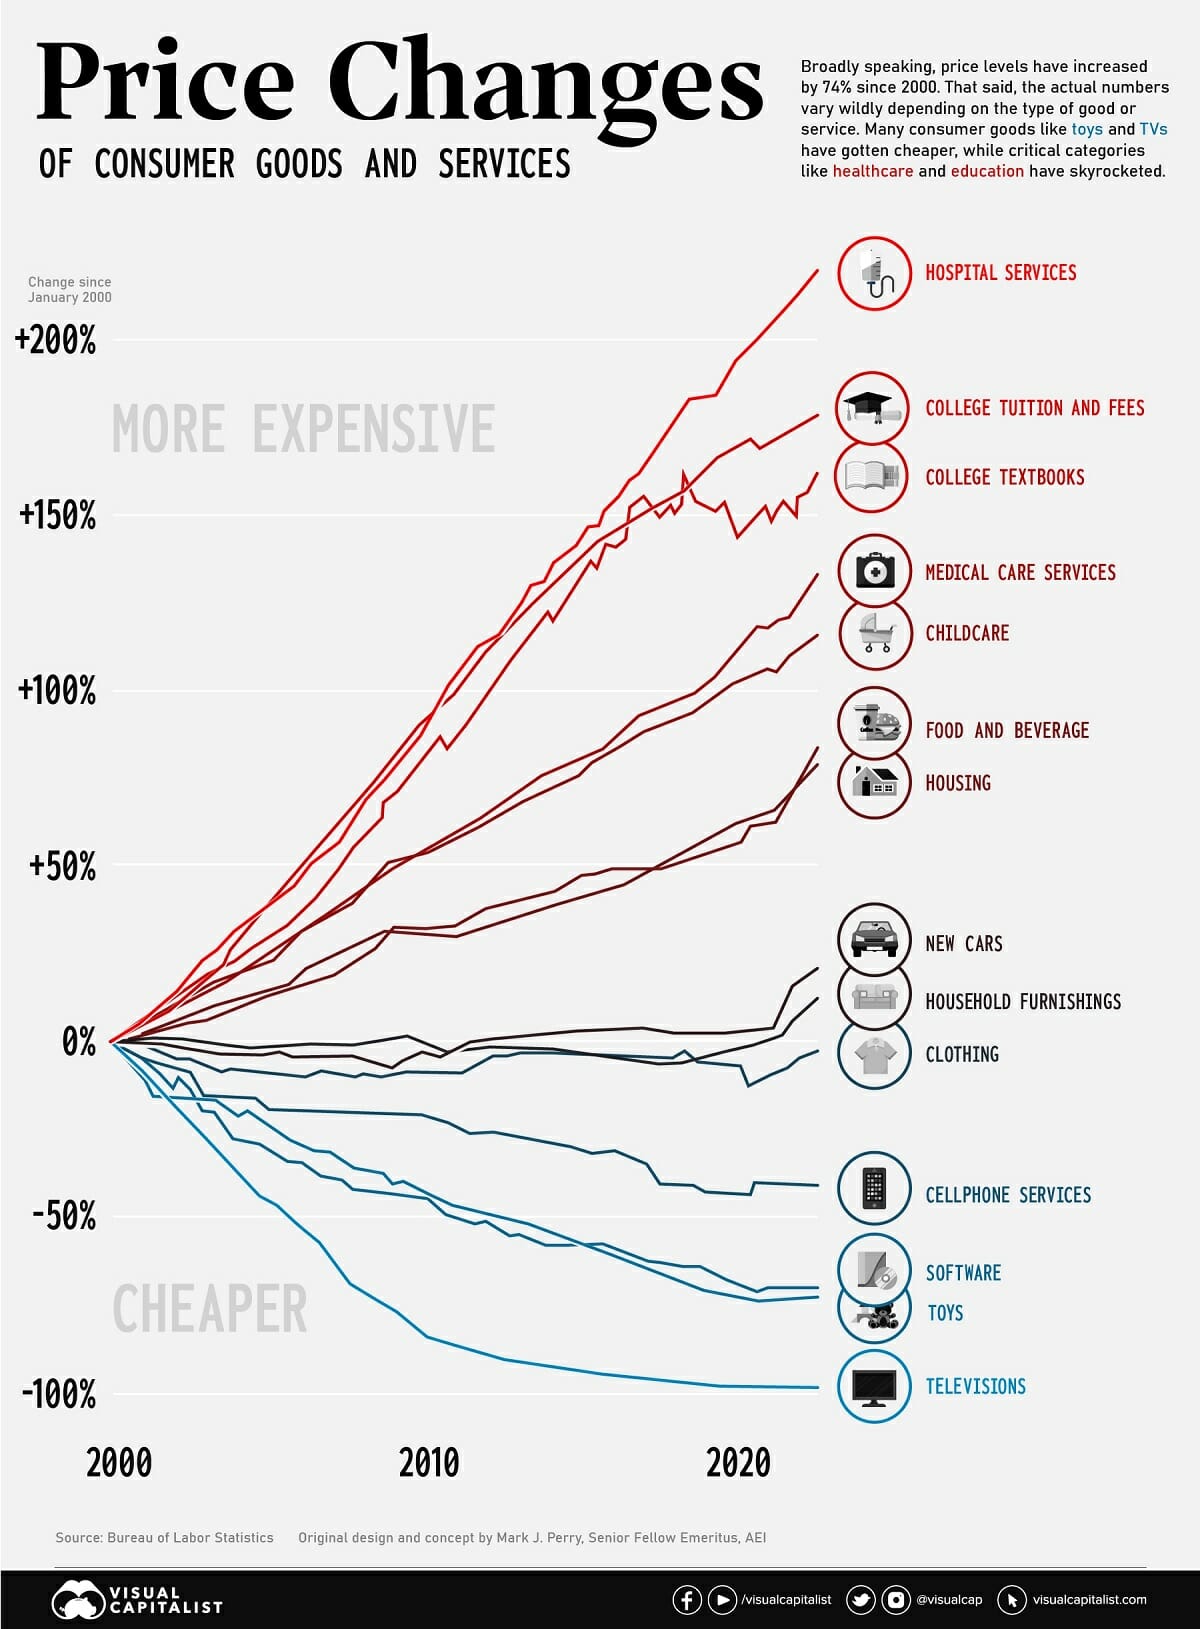
Since the start of the 21st century, U.S. consumers have seen a divergence of price movements across various categories. Nowhere is this better illustrated than on this chart concept thought up by AEI’s Mark J. Perry. It’s sometimes referred to as the “chart of the century” because it provides such a clear and impactful jump-off point to discuss a number of economic forces.
Q4 2022 hedge fund letters, conferences and more
The punchline is that many consumer goods—particularly those that were easily outsourced—saw price drops, while key “non-tradable” categories saw massive increases. We’ll look at both situations in more detail below.
Race To The Top: Inflation In Healthcare And Education
Since the beginning of this century, two types of essential categories have been marching steadily upward in price: healthcare and education.
America has a well documented “medical inflation” issue. There are a number of reasons why costs in the healthcare sector keep rising, including rising labor costs, an aging population, better technology, and medical tourism. The pricing of pharmaceutical products and hospital services are also a major contributor to increases. As Barry Ritholtz has diplomatically stated, “market forces don’t work very well in this industry”.
Rising medical costs have serious consequences for the U.S. population. Recent data indicates that half of Americans now carry medical debt, with the majority owing $1,000 or more.
Also near the top of the chart are education-related categories. In the ’60s and ’70s, tuition roughly tracked with inflation, but that began to change in the mid-1980s. Since then, tuition costs have marched ever upward. Since 2000, tuition prices have increased by 178% and college textbooks have jumped 162%.
As usual, low income students are disproportionally impacted by rising tuition. Pell Grants now cover a much smaller portion of tuition than they used to, and the majority of states have cut funding to higher education in recent years.
Globalization: A Tale Of Televisions And Toys
Even though essentials like education and heathcare have rocketed up, it’s not all bad news. Consumers have seen the price of some goods and services drop dramatically.
Flat screen televisions used to be a big ticket item. At the turn of the century, a flat screen TV would cost around 17% of the median income of the time ($42,148). In the early aughts though, prices began to fall quickly. Today, a new TV will cost less than 1% of the U.S. median income ($54,132).
Similarly, cellular services and software have gotten cheaper over the past two decades as well. Toys are another prime example. Not only are most toys manufactured overseas, the value proposition has changed as children have new digital options to entertain themselves with.
Over a long-term perspective, items like clothing and household furnishings have remained relatively flat in price, even after the most recent bout of inflation.
Article by Visual Capitalist


