
Bonhoeffer Capital Management commentary for the third quarter ended September 2021, providing a case study for Millicom International Cellular SA (NASDAQ:TIGO).
Q3 2021 hedge fund letters, conferences and more
Dear Partner,
The Bonhoeffer Fund returned -2.8% net of fees in the third quarter of 2021. In the same time period, the MSCI World ex-US, a broad-based index returned -0.7% and the DFA International Small Cap Value Fund, our closest benchmark, returned -2.5%. Year to date, the Bonhoeffer Fund has returned 22.9% net of fees. As of September 30, 2021, our securities have an average earnings/free cash flow yield of 14.3% and an average EV/EBITDA of 4.7. The DFA International Small Cap Value Fund had an average earnings yield of 11.1%. These multiples are lower than last quarter primarily due to increasing earnings and declining share prices. The difference between the portfolio’s market valuation and my estimate of intrinsic value is greater than 100%. I remain confident that the gap will close over time and the portfolio quality will continue to increase as we increase allocations to faster-growing firms.
Bonhoeffer Fund Portfolio Overview
Our investment universe has been extended beyond value-oriented special situations to include growthoriented firms using a value framework, including companies that generate growth through consolidation. There have been modest changes within the portfolio in the last quarter in line with our low historical turnover rates. We have sold Cambria Automotive which is in the process of being acquired and used the proceeds to increase our holdings in Asbury Automotive, Countryside Properties, and Millicom.
As of September 30, 2021, our largest country exposures include: South Korea, United States, United Kingdom, Italy, South Africa, and Philippines. The largest industry exposures include: distribution, telecom/media, real estate/infrastructure, and consumer products.
We added to some smaller positions within the portfolio and are investigating additional consolidation plays with modest valuations in industries that have nice returns on invested capital such as fiber rollouts, convenience stores, and IT services.
Compound Mispricings (37% of Portfolio; Quarterly Average Performance -8%)
Our Korean preferred stocks, the nonvoting share of Telecom Italia, Wilh. Wilhelmsen, and some HoldCos all feature characteristics of compound mispricings. The thesis for the closing of the voting, nonvoting, and holding company valuation gap includes evidence of better governance and liquidity. We are also looking for corporate actions such as spinoffs, sales, or holding company transactions and overall growth.
Throughout the year, Net1 UEPS has been accumulating cash from the sale of its non-core assets including a Korean transaction processing network and its stake in a crypto bank. This cash, in addition to issuing some debt, was used to purchase Connect, a merchant transaction processor catering to small and medium businesses. This acquisition will complement its consumer fintech EasyPay transaction and ATM network and expand Net1 UEPS’s total addressable market to include small and midsized businesses and lead to profitability.
The Korean preferred discounts in our portfolio are still large (25% to 73%). The trends of better governance and liquidity have reduced the discount in names like Samsung Electronics, and more preferred names trade at a premium to common shares. We continue to like the prospects for LG Corp preferred post LX Holdings spinoff from both a business and discount perspective. The current discount to NAV is 74% for the LG Corp preferred. In addition, this discount is based upon a base value of LG Corp with reasonable implied EV/EBITDA multiples of LG Corp subsidiaries of 4.7x for LG Electronics, 13.6x for LG Chemical (including LG’s EV battery division), and 16.7x for LG Household & Health Care.
Public LBOs (37% of Portfolio; Quarterly Average Performance -1%)
Our broadcast TV franchises, leasing, building products distributors, and roll-on/roll-off (RORO) shipping fall into this category. One trend I’ve noted in these firms is growth creation through acquisitions which provide synergies and operational leverage associated with vertical and horizontal consolidation and the subsequent repurchasing of shares with debt. The increased cash flow is used to pay the debt and the process is repeated.
Millicom, this quarter’s case study, is a public LBO that has financed many of its investment opportunities with debt. The recently announced buyout of its Guatemalan JV partner illustrates this. The debt, when used in situations like this, has been paid down over time as Millicom generates a lot of free cash flow and can increase returns like leveraged rollups, as described below.
Distribution Theme (41% of Portfolio; Quarterly Performance +3%)
Our holdings in car and branded capital equipment dealerships, convenience stores, building product distributors, and capital equipment leasing firms all fall into the distribution theme. One of the main KPIs for dealerships and shopping is velocity or inventory turns. We own some of the highest-velocity dealerships in markets around the world. There have been challenges in some markets hit by COVID, like South Africa and Latin America; but there should be recovery now that vaccines have been approved and distributed.
GS Retail, the second largest convenience store operator in Korea (with 14,600 convenience stores and 320 grocery stores), is the security we received for the buyout of GS Home Shopping. We have applied our growth methodology described in the last quarterly report. The following is a summary:
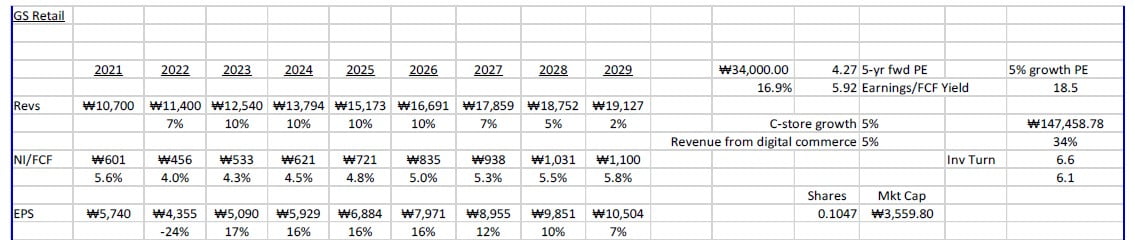
The convenience store business is growing and consolidating worldwide. As a result of the acquisition, management is planning on using the younger customer data from GS Retail, the older customer data from GS Home Shopping, and the GS distribution network (42 logistics centers supporting convenience, grocery, and home shopping customers) to provide older and younger customers their products instore (convenience store) or next-day home delivery across Korea. Management expects 10% growth overall, composed of underlying convenience store growth of 4-5% and 5% from cross selling and digital commerce from the merger. Given the fixed costs in the convenience store network and distribution infrastructure, management expects cost synergies to generate net income margins of 5.0%. If these revenue and growth rates are realized, then a P/E closer to comparable convenience stores BGF Retail (Korea), Seven & I, and Alimentation Couche-Tard of 15-20x is not unreasonable. This range has significant upside from current P/E multiple of 5.9x and five-year forward P/E of 4.3x.
Telecom/Transaction Processing Theme (36% of Portfolio; Quarterly Performance -2%)
The increasing use of transaction processing in our firms’ markets and the rollout of 5G will provide growth opportunities. Given that most of these firms are holding companies and have multiple components of value (including real estate), the timeline for realization may be longer than for other firms.
Telecom Italia continues to work with the Italian government and Fiber Corp to merge their telecommunications infrastructures together. Vivendi has called an emergency board meeting to ensure Telecom Italia will retain control of the combined telecommunication infrastructure after the merger. We view this action as a positive despite the decline in Telecom Italia’s share price. The updated sum-ofthe- parts analysis (as detailed in previous letters) implies an upside of 80–100%. In my opinion, much of the recent decline is due to concerns that Telecom Italia will give up control of the combined telecommunications infrastructure.
Consumer Product Theme (10% of Portfolio; Quarterly Performance -7%)
Our consumer product, tire, and beverage firms comprise this category. The defensive nature of these firms has led to lower-than-average performance due to the stronger performance from more recoverycorrelated names. One theme we have been examining is the increase in sales of adult products (tobacco, alcohol, and lottery) in convenience stores as other stores are removing these products from their product offerings. GS Retail is taking advantage of this trend in Korea.
Real Estate/Construction Theme (23% of Portfolio; Quarterly Performance -3%)
In my opinion, the pricing of our real estate holdings has been impacted by both a recession and the communist takeover in Hong Kong. The current cement and construction holdings (in US/Europe via BFS and Countryside and in Korea via Asia Cement) should do well as the world recovers from COVID shutdowns and governments start infrastructure programs.
Asia Standard also declined during the quarter due to the concern over the decline in its Chinese real estate developer bond holdings. Asia Standard holds a large number of Chinese real estate developer bonds, including those of Evergrande and Kaisa. The Evergrande bonds have declined to about 20% of face value as of September 30 (they were at 40% of face value on July 31, 2021, the last market-to-market valuation date for Asia Standard’s bond portfolio) while the Kaisa bonds have declined to 85% of face value. I ran a stress test assuming a 25% decline in the bond portfolio from July 31, 2021. This is 2x the 13% decline in the portfolio from Evergrande and Kaisa bond prices between July 31, 2021, to September 30, 2021. The resulting NAV/share is $8.09 versus the $10.09 NAV as of July 31, 2021. The September 30 stock price of $0.85 is at a 91% discount to the stressed NAV and 92% to the July 31, 2021, NAV.
Consolidation Frameworks
In our Q1 letter, we described how we are examining growth opportunities associated with consolidation in fragmented industries. Growth from consolidation can be a resilient form of growth as it is dependent upon the availability of target firms and associated cost and revenue synergies versus overall market growth. When consolidation growth is combined with modest industry growth, some exciting growth can be realized. If the firms also exhibit operational leverage from economies of scale/scope, then the combined effect can be significant growth in earnings or free cash flows. The advantage of this type of growth is that it is realized over time and not recognized by the market in advance. This can be seen in the price charts of many of these firms moving from the lower left to the upper right over time as the growth is realized.
Fragmented markets can have long runways associated with consolidation and economies of scale and scope which can lead to cash flow growth in excess of the market growth for many years. We try to identify these markets and firms that can ride the consolation wave over a long timeframe. Some of these firms have valuations reflecting some of the future growth and some have little to no premium reflecting future growth from consolidation.
Currently, the internet (an innovation) is providing more consolidation via additional fragmentation of retail demand from offline, online, and omni-channel selling channels. An example is traditional auto dealers using an omni-channel sales approach and Carvana who is exclusively online. Bonhoeffer is looking for businesses that are adopting the innovation (internet distribution) which will enhance growth going forward but where it is not recognized by the market yet, as evidenced by the current stock price.
Some analysts have developed useful frameworks to evaluate consolidation or serial acquirer situations. Scott Capital has developed a useful framework1 for categorizing consolidators, shown below:
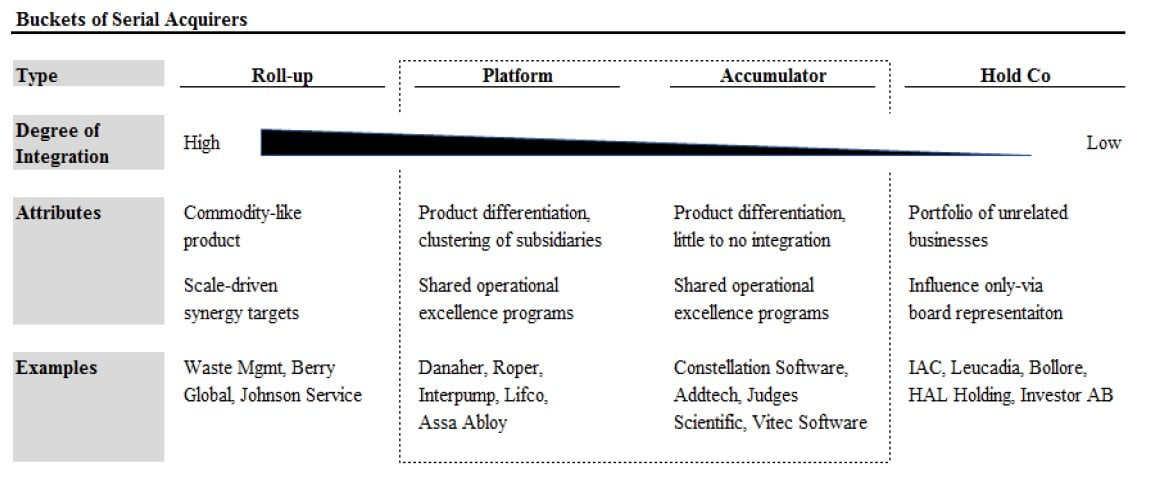
Scott has categorized these types of firms depending upon the level of target integration. Most of the firms we have been examining recently have been rollups (firms in the same industry) with scale-driven synergies and operational leverage. We also hold one platform (Wilh. Wilhelmsen) and one holding company (LG Corp).
Another way to look at these firms is cross-sectionally based on total addressable market (TAM) size and integration of operations, as described by Canuck Analysts Substack2 below:
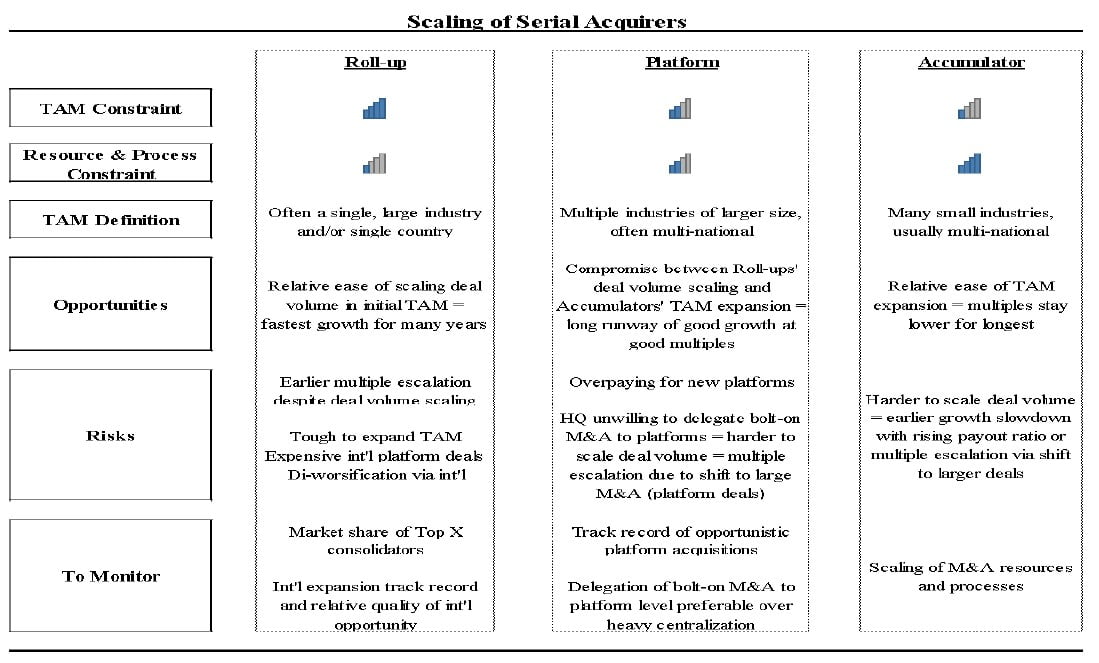
Using this framework for our current areas of interest (rollups), I have been monitoring acquisition multiples in the car dealers (Asbury Automotive), local TV and radio firms (Gray Television), building supply distribution (Builders First Source), Latin American telecommunications (Millicom), cement firms (Asia Cement), equipment leasing firms (Ashtead), and network processing (Net 1 UEPS). In each of these segments, multiples have been modest. None of these firms have done international “diworsifying” deals to date and some have recently divested unrelated firms (Net 1 UEPS, Daelim Industrial and LG Corp). In each of these markets, the market share of the top firms is less than 10% except for GS Retail, where itself and FRB have a dominant share of 31% each, and Millicom, where it has a leading or number two position in eight of its nine markets where it competes. The small market shares provide a large runway for consolidation in its existing industry for years to come. Also, none have made international expansion into new markets outside their existing footprints.
A return benchmark developed by the Canuck Analysts Substack3 is shown below:
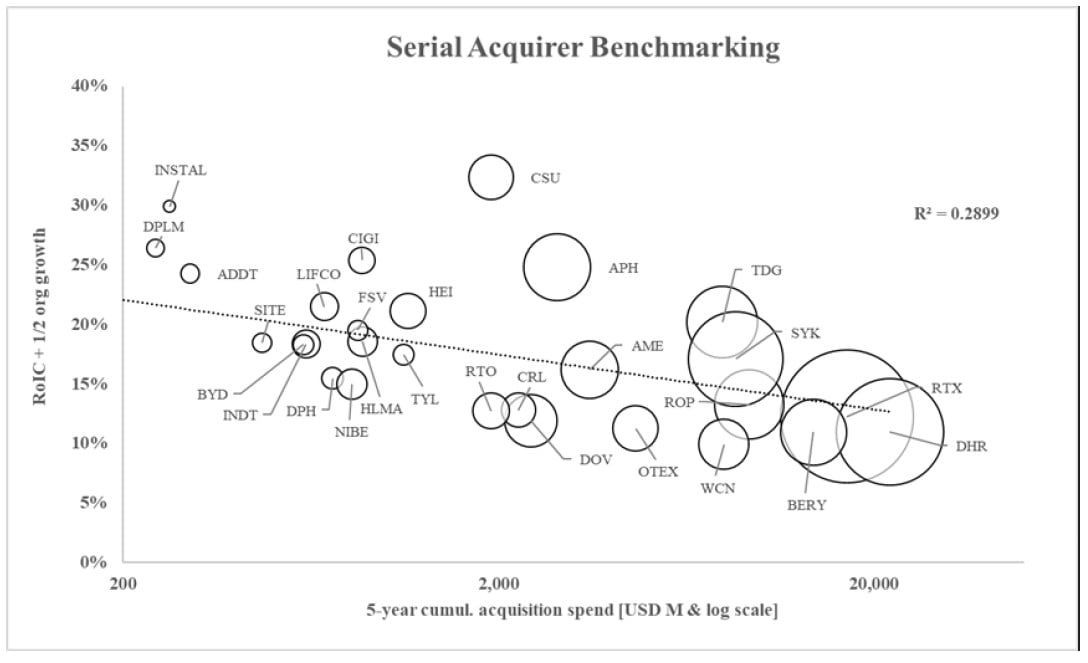
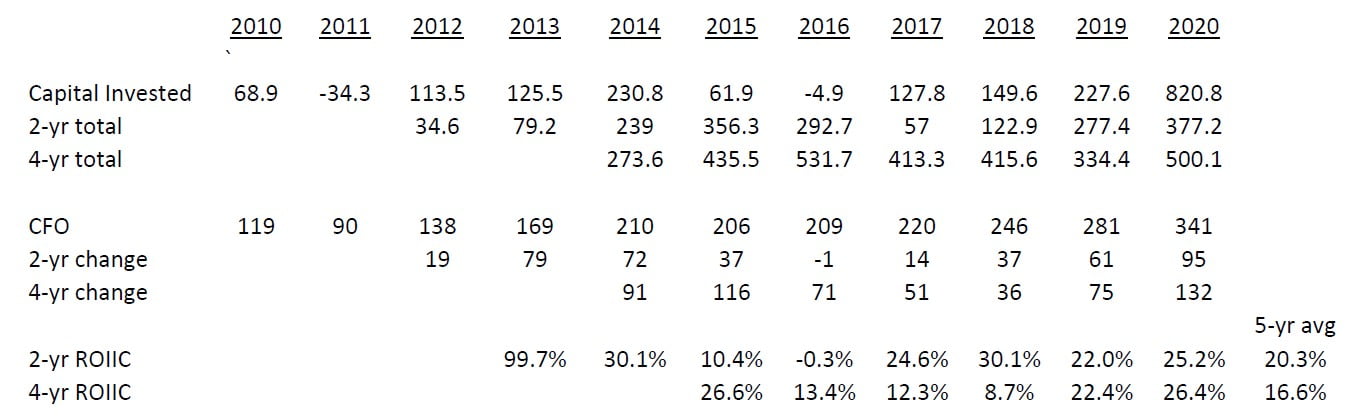
This framework, used in combination with calculating return on incremental capital, can illustrate where the invested capital returns can be modest. As an example, we will look at Asbury Automotive. Asbury’s returns on invested capital averaged 13%, and the return on equity averages 31% over the past 10 years plus an organic growth rate of 2 to 3% per year based upon US auto sales and maintenance service costs. This results in an ROIC plus ½ of annual organic growth of about 15%. The size of Asbury’s acquisitions has been about $1.4 billion over the past five years. Below is Asbury’s return on incremental invested capital over the past 10 years which has averaged in the upper teens during that period.
For other serial acquirers like Ashtead, the organic growth rate is 6% and its ROICs over the past 10 years is 14% resulting in an ROIC plus ½ of annual organic growth of about 17%. The size of Ashtead’s acquisitions has been about $2.0 billion over the past five years.
Conclusion
As always, if you would like to discuss any of the philosophies or investments in deeper detail, then please do not hesitate to reach out. Until next quarter, thank you for your confidence in our work and have a safe and warm year-end holiday season.
Warm Regards,
Keith D. Smith, CFA
Case Study: Millicom International Cellular SA (TIGO)
Millicom International Cellular SA (NASDAQ:TIGO) provides mobile and broadband telecommunications services to consumers and businesses in Central America (Guatemala, Honduras, El Salvador, Nicaragua, Costa Rica, and Panama) and South America (Columbia, Bolivia, and Paraguay). TIGO provides legacy voice, wireless and data services, and fiber-based services to firms and individuals. Currently, TIGO has 43.1 million wireless subscribers, including 20.3 million 4G subscribers and 4.9 million home customers, including 8.4 million revenue generating units (RGUs) and 4.1 million broadband subscribers. In addition, TIGO’s network includes 5,400 points of presence and 300,000 business customers. TIGO is the number one or two broadband and wireless provider in eight of the nine markets in which TIGO competes. Recently, TIGO announced the purchase of its joint venture (JV) partner’s share of its JV in Guatemala for $2.2 billion. This transaction will be financed by debt and a shareholder friendly common stock rights offering.
TIGO provides mobile money/banking services for five million customers in six countries. TIGO also has 10,000 towers and 13 data centers which can be sold and leased backed. TIGO is in the process of separating its towers and data centers (like Telefónica and América Móvil) and its mobile money/banking service to facilitate sales or investments by third parties. In 2017, TIGO sold 3,410 towers in Columbia, El Salvador, and Paraguay for $417 million or $122,287 per tower.
Historically, TIGO operated in both Africa and Latin America. Over the past five years, TIGO has divested its African telecommunications assets and purchased additional assets in Latin America. TIGO’s network passes over 12.2 million homes (24% penetration of total homes) and covers 80% of mobile phones. The firm is in the midst of rolling out fiber to homes to provide broadband connectivity to Latin American customers. This rollout is being funded by cash flow from operations. The firm has been described as building a Charter Communications under a wireless Verizon umbrella. This is similar to our Consolidated Communications play with the additional benefit of having a wireless network and a mobile money business. In most countries in which TIGO operates, they have joint ventures or minority interest local partners.
TIGO currently has an average high-speed internet (HSI) penetration rate (a take rate of HSI for homes passed) of about 39% across the countries it serves. This has increased by 1.4% since year-end 2020. To put this in context, most cable broadband penetrations are in the 50% plus range. In seven of the nine countries they serve, TIGO is the number one or two competitor in wireless and broadband in two-player markets (Guatemala, Honduras, El Salvador, Costa Rica, Panama, Bolivia, and Paraguay) and number three in two markets (Nicaragua and Costa Rica). The Q3 2021 mobile average revenue per RGU was $6.40 per month, and the broadband revenue per RGU was $28.10 per month. The largest shares of proportional EBITDA are from Guatemala (38%), Bolivia (11%), Paraguay (11%), Panama (10%), and Columbia (9%). In terms of regions, 70% of EBITDA is from Central America and 30% from South America.
TIGO has developed a customer-focused culture at the corporate and country level using NPS as a metric which is collected and used as a management incentive to increase customer satisfaction. In addition, the countries that TIGO serves have stable currencies versus the US dollar. Since 2000, the EBITDA weighted average currency movements have been only 0.7% per year.
Another positive trend is the movement of suppliers to US-based firms moving from China to a closer location with political and currency stability—Central America. If we look at the index of economic freedom for the Central American countries in which TIGO primarily operates, they have a moderately free ranking. For the subcategories most of interest to suppliers (tax burden and trade and business freedom), they all are ranked free or mostly free (highest ratings).
Millicom and Fiber-optic Rollout
The Latin American telecommunications services market is a local, fragmented market. Consolidation has occurred over the past 10 years amongst these local players, and the next generation of technology (fiber-optic connections) is being rolled out. Fiber-optic rollouts are generating organic growth and economies of scale with high incremental user profitability. Millicom has created economies of scale depending upon the geography of the acquired telecommunications firm. There is also the vertical integration across telecommunications services (like wireless, voice, data, cable, and hosting) in a given geography which can create additional economies of scale. With these rollouts, telecommunications companies compete with the local cable companies—and in some cases wireless providers—to provide HSI and other services to customers in their local footprints.
Historically, telecommunications and cable firms have had poor customer service, as evidenced by low net promoter scores (NPSs). Keith Rabois, a founder of PayPal, has tweeted, “Formula for startup success: Find large highly fragmented industry w low NPS; vertically integrate a solution to simplify value product.” Part of simplifying the solution is providing multiple services and good customer service. The telecommunication services market fits this description. The new fiber rollouts are analogous to organic startups and thus can also be successful in the vertical integration into these markets.
Business and Service Analysis
One way to look at telecom business is to divide it into slowly growing (wireless) and quickly growing segments (HSI). The slower-growing wireless business is mature and is growing about 2% per year. The HSI business is growing at an 8% annual rate driven by fiber rollouts in TIGO’s countries. Millicom’s overall mix of wireless and HSI revenue is 33% HSI and 67% wireless, with 67% recurring subscription revenue (HSI and post-paid wireless) but varies by country. The current revenue growth rate is 4.3% and will increase to 5%, by the end of 10 years and the HSI/wireless mix approach 50%/50%.
If we look at unit economics of the fiber rollout, it is also quite favorable. According to management, the estimated cost to pass each new customer is about $150; and the cost to connect a customer is $100. This is similar to the cost reported by Oi, a telecommunications firm rolling out a fiber-optic network in Brazil. If you have a final penetration rate of 45% using the current HSI monthly charge of $28/month, and a steady-state EBITDA margin of 45% (which management believes are both achievable at scale; the current margin is 40%), then the payback time is between six and seven years, and the unlevered IRR is 26% and a levered return of 52%. See Exhibit A for details.
Latin America Broadband Telecommunications Market
The broadband telecom business in Latin America is a fragmented market on an international basis and a concentrated market on a country-by-country basis. The market is a local market, so the smaller country markets only have a few competitors. This leads to less price competition for TIGO than in larger, more urban markets where there are more competitors. Gig speed internet and wireless are core infrastructure services that will be required in the internet service economy. Currently, broadband usage is growing at a 30-40%/year rate and is expected to increase going forward, as more bandwidthintensive applications are developed and rolled out over time.
Since most of TIGO’s competition is from cable companies and incumbent telecom firms (that have low NPSs), TIGO has an opportunity to provide improved customer service versus the cable companies. This highlights the importance of the decentralized management system, incentivized and shareholding country managers, and including NPSs in management’s incentive compensation at the corporate and country levels.
Of the other publicly traded Latin American telecommunications firms, TIGO has the largest potential to increase HSI organic revenue growth (by 8%) via a fiber rollout in its incumbent territories. This can be seen in the projections based upon the currently planned and financed fiber rollout shown in Exhibit B.
The tilt toward the faster-growing Central American countries (which should get some opportunities to replace China as exporters to the US) versus the slower-growing South American countries will also add a nice tailwind. The countries TIGO services had an average real GDP growth rate of 3.2% per year over the past five years versus the overall 0.7% GDP growth rate for all of Latin America.
Downside Protection
TIGO has been reducing debt over the past few years with a current proportional debt/EBITDA of 2.7x and a goal of 2.0x. TIGO has a bond rating of Ba2 and yields 3.5% for five- to 10-year bonds.
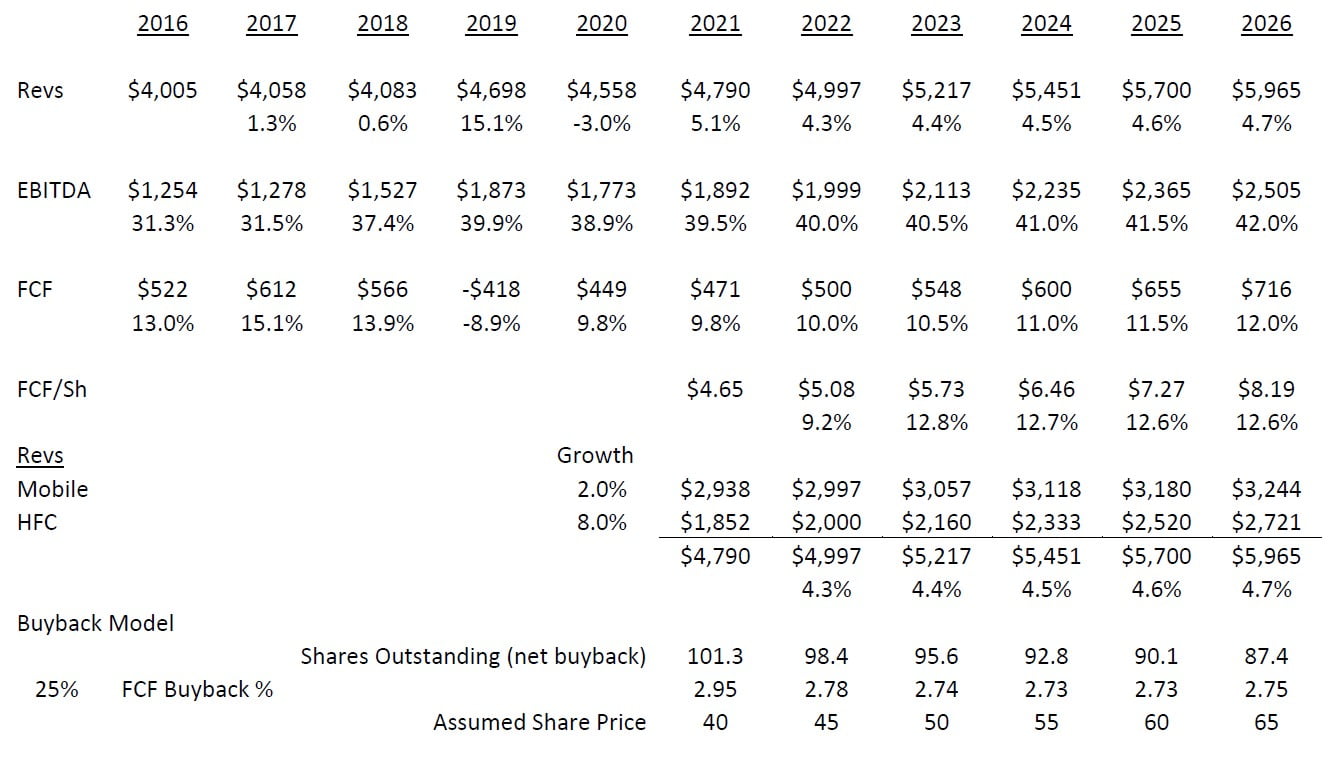
TIGO is in a defensive business—telecommunications services—which has a large amount of recurring revenue. HSI data revenues are increasing, while wireless revenues are increasing at a slower rate. See below for projections and Exhibit B for more detailed projections.
Below is the proportional historical and projected revenue, EBITDA, and FCF since 2016 when the Guatemalan and Honduran JVs were deconsolidated.
Management and Incentives
One of the risks in emerging-markets investing is management, as they may have different incentives than those to which Western investors are accustomed. In this case, you have a management team based in the US (Miami) that has been historically influenced by the firm’s domicile, Sweden. TIGO is led by a former Liberty Latin America executive, Mauricio Ramos. He brings the Liberty Media playbook (a successful leveraged rollup strategy of cable-related properties and associated shareholder friendly corporate actions) to the markets that TIGO serves. TIGO is listed in Sweden and the United States and brings the corporate governance practices, capital allocation, and shareholder renumeration approaches to its operations throughout Latin America. In many countries, TIGO has local JV partners which provide TIGO with access to the local connections.
TIGO has management incentives, including TIGO stock (with minimum levels for country managers) at both the corporate and country levels. The capital allocation is also done at both the corporate and country levels. This country-level capital allocation, incentives, and stock ownership is unusual for a Latin American company. The major categories of capital allocation for TIGO are: 1) purchasing minority interests from partners, 2) investing in the HSI broadband rollout described above, 3) selective acquisitions, 4) repurchasing shares, or 5) distributing dividends. Categories 1, 2, 3 and 4 have the most well-defined and highest returns and have been used by management in the past.
In 2020, the CEO’s management compensation was 20% base salary and 80% incentive-based bonus, of which short-term incentive (STI) is 50% equity based (TIGO shares) and 50% cash based and long-term incentive (LTI) is 100% equity based (TIGO shares). The 2020 STI compensation was based on service revenue growth, EBITDA growth, operational cash flow growth, NPS, and other operational goals. The 2020 LTI compensation is based upon service and EBITDA growth and relative total shareholder return versus peers. The 2020 equity-based shares were issued at $38.09 per share, and the 2019 shares were issued at $42.70 per share.
Overall, 700,000 shares were granted in 2020 (about 0.7% of shares outstanding per year). The management team owns 0.7% of TIGO common stock. TIGO has stock ownership guidelines of 5x the salary for the CEO, 3x for other senior managers, and 1x for country managers.
Valuation
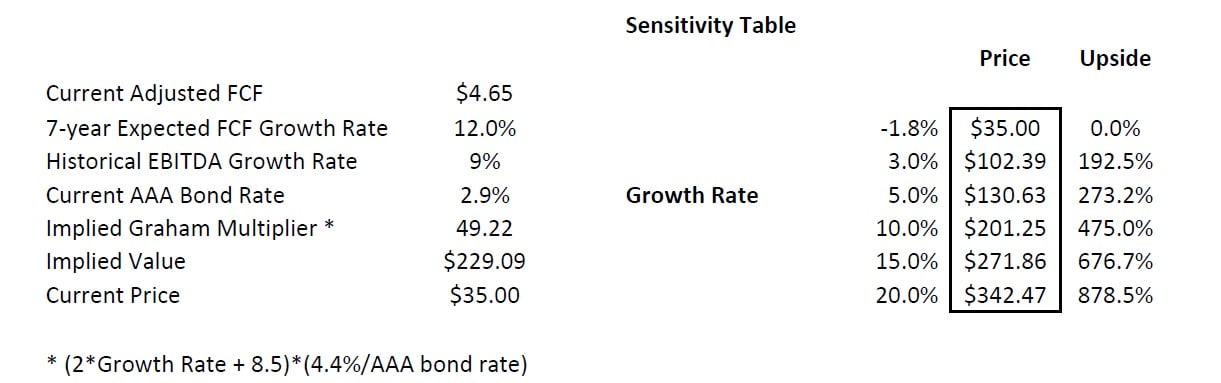
The valuation of TIGO is an interesting exercise because its expected growth rate is accelerated by the fiber rollout and share buybacks described above. The implied growth using the Graham Formula, adjusted to today’s interest rates ((8.5 + 2g)*(4.4/AAA bond rate)) and the current P/E, is -1.8%, clearly implying that the market expects TIGO’s cash flows to continue to decline. Some benchmarks for growth are the projected sales growth rates of 4.5% per year (based upon the fiber rollout), an EBITDA growth rate of 6% per year, and an adjusted free cash flow growth of 12%.
The question is whether this growth rate is sustainable over the next seven years. Given the key penetration, margin, investment, and timing assumptions in the projection model, I believe it is. TIGO is the only Latin American publicly traded telecom firm that has a rollout of this magnitude (adding 18% to revenue) scheduled over the next five to seven years. One firm that also has a Latin American footprint is Liberty Latin America (LILA). LILA has grown revenues and EBITDA at about 8% per year since 2015. The EBITDA margin is similar to TIGO, but historically the conversion to FCF from EBITDA was 50% less than TIGO—25% for TIGO and closer to 12% for LILA. The current FCF multiple of LILA is about 16x. If that multiple is applied to TIGO’s FCF, it yields a value of $74 per share, which I believe is a reasonable 12-month target.
If, over the five to seven years, a 12% FCF growth is attained, then the earnings will be $8.19. Applying a 23.8x multiple to these earnings (implying a 4% growth rate over the subsequent seven years) means a value of $195 per share is obtained.
Another way to look at valuation is on an enterprise basis. If we value TIGO on a forward EBITDA basis of 9x EBITDA (the current multiple of cable overbuilder WOW!), then the resulting value is $200 per share. If we consider both benchmarks, then a $200 price target is not unreasonable. See Exhibit B for details. This results in a five-year IRR of about 42%.
In addition to the core assets, TIGO has about 10,000 towers (with an additional 2,000 under construction), 13 data centers, and a mobile banking division. According to management, these non-core assets are being prepared for either sale-leasebacks or investments by third parties. The estimated value of the towers and data centers is about $2 billion—$1.1 billion for the towers and $900 million for the data centers. The tower valuation of $1.4 billion is based upon an estimated value per tower of $120k based upon tower transaction values (TIGO’s historic transactions averaged $122k/tower and a 2021 Telxius transaction was $110k/tower, 9,300 Latin American towers for €900 million) and Telesites’s current valuation of $252k/tower times 12,000 towers. The data center valuation of $750 million is based upon an estimated value per data center of $58k which is based upon Latin American data center transactions (Anxel data centers were purchase by Equinix for $58k/center, three data centers for $175 million, and Telefónica data centers were purchased by Asterion for $58k/data center, nine data centers for €550 million) times 13 data center. Adding together the towers and data centers, the total valuation of these assets is $2.1 billion.
The mobile banking division (TIGO Money) can be valued using a range of values based upon the value of African mobile banking firms and Latin American neobank firms. The mobile banking business had 5 million customers and 48 million transactions in 2020. If we use African mobile banking transactions (20 million Airtel customers were purchased for $2.6 billion and 46 million MTN customers were purchased for $5.0 billion), the average value per user is $121. If we use $121/customer times 5 million transactions, it implies a $600 million value for TIGO Money. If we use recent Latin American neobank transactions (40 million Nubank (Brazil) customers were purchased for a $30 billion valuation and 3.5 million Ualá (Argentina) customers were purchased for a $2.45 billion valuation), the average value per user is $750. If we use the midpoint of the African mobile banking and Latin American neobanks of $435, we get $435 times 5 million customers, and the resulting value is $2.2 billion.
This is additional value of $2.7 to $4.2 billion ($27 to $42 per share) in addition to the core business value estimated above. So, for example, if you assume a 12% FCF growth rate and the value of non-core assets, you get a total value of $255 to $270 per share.
Comparables
Given the fiber rollout and the size of TIGO, the comparable firms include US and Italian small-cap telecommunications firms. One of the larger issues in Latin American firms versus developed markets is currency risk, however; as described above, TIGO’s currency risk is similar to developed markets’ risk. The following are the comparable firms in the US and Italian telecommunications markets. The smaller Italian telecom firms have smaller floats than the US firms and are majority controlled (70%+) by the original owners.
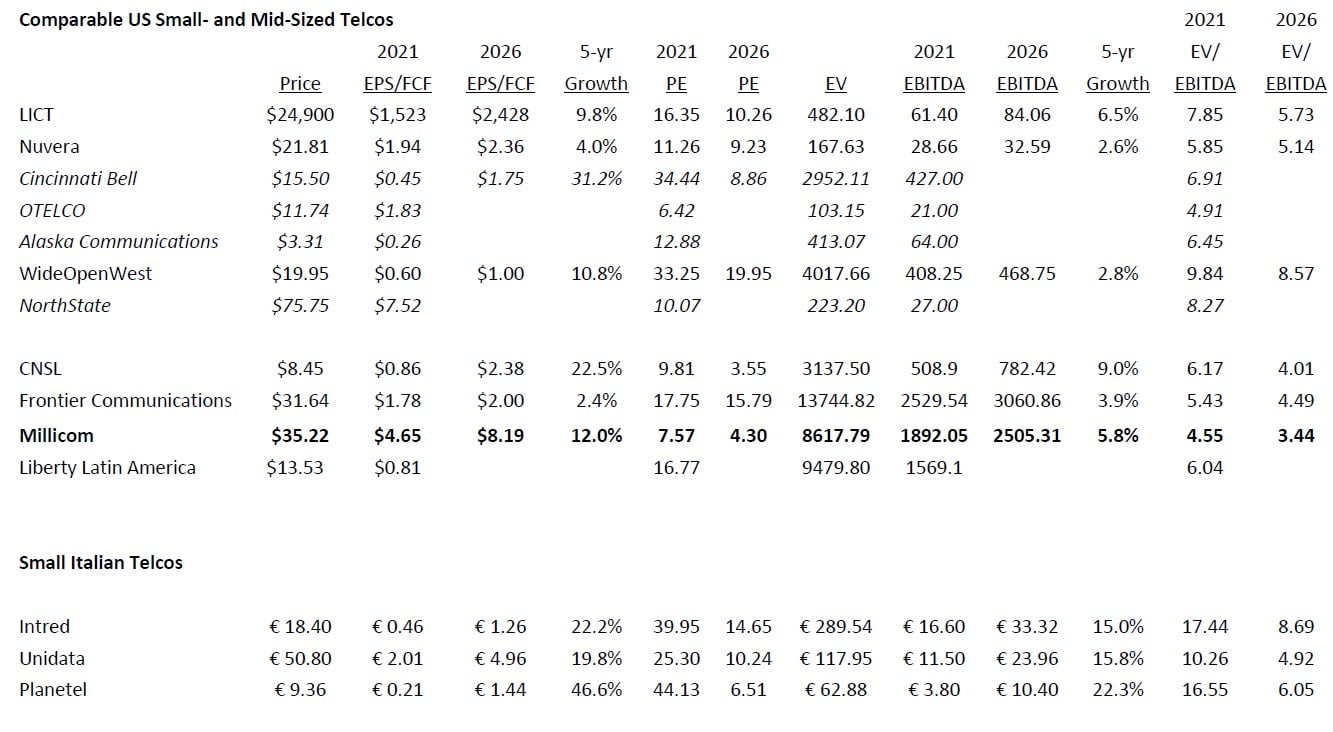
There have been some private equity acquisitions in the US rural local exchange carriers (RLEC) space, namely Cincinnati Bell and Alaska Communications. These firms have a similar dynamic associated with their respective fiber rollouts, and private equity firms have invested in these firms for similar reasons that make CNSL attractive. Cincinnati Bell has been purchased by the private equity firm Macquarie Infrastructure Partners, which outbid an original offer from Brookfield Asset Management. Alaska Communications is also in the process of being purchased by ATN International and Freedom 3 Capital. The EV/EBITDA paid by these buyers was 6.5 to 6.9x EBITDA for assets with lower margins than the current price of TIGO (4.6x EBITDA).
Benchmarking
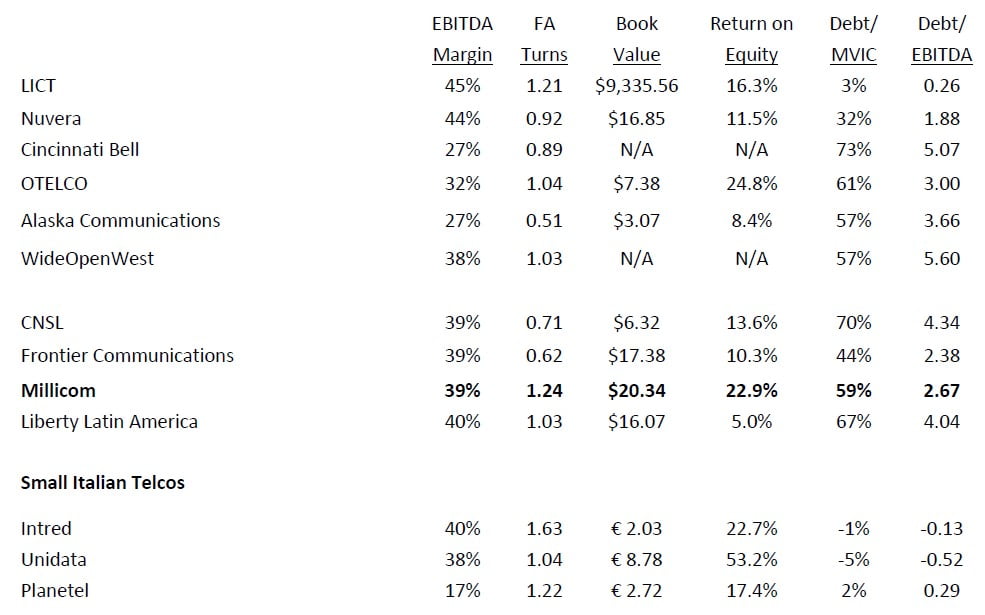
In comparison to other US and Italian firms, TIGO has above-average (but good) FCF ROE and a high EBITDA margin. With TIGO’s fiber rollout and customer take-up, the fixed asset turns and ROEs should increase. With these favorable operational metrics, TIGO has one of the lowest current and 2021 P/FCF ratios of either group.
Risks
The primary risks to achieving a target valuation of $72 per share for TIGO include:
- a lower-than-expected broadband penetration of fiber rollout communities; and
- a quicker-than-expected decline in the legacy telecom lines.
Potential Upside/Catalysts
The primary upsides/catalysts include:
- faster-than-expected penetration of uptake of broadband services;
- operational leverage due to economies of scale; and
- re-rating to reflect higher growth.
Timeline/Investment Horizon
The short-term target is $72, which is more than double today’s price. I think the investment thesis can play out over the next three to five years. By that time, TIGO’s net income and earnings should have appreciated by 75%, and the fair multiple could triple with a 4% increased growth rate. If that is the case, then TIGO will attain a 6.7x return to $235 over five years or 46% annualized. This is similar to a “Davis double,” where both underlying earnings increase along with the fair value multiple.


