
Gold’s latest feats increased investors’ appetite. The outlook for the dollar, however, remains healthy. That can only mean one thing.
Q4 2021 hedge fund letters, conferences and more
Bearish Outlook For Gold And Silver
As volatility erupts across the financial markets, gold and silver prices are being pulled in conflicting directions. For example, with the USD Index suffering a short-term decline, the outcome is fundamentally bullish for the precious metals. However, with U.S. Treasury yields rallying, the outcome is fundamentally bearish for gold and silver prices. Then, with panic selling and panic buying confronting the general stock market, the PMs are dealing with those crosscurrents.
However, with QE on its deathbed and the Fed poised to raise the Federal Funds Rate in the coming months, the common denominator is rising real interest rates. To explain, the euro’s recent popularity has impacted the USD Index. For context, the EUR/USD accounts for nearly 58% of the dollar basket’s movement. Thus, if real interest rates rise and the U.S. dollar falls, what will happen to the PMs?
Well, the reality is that rising real interest rates are bullish for the USD Index, and the euro’s recent ECB-induced rally is far from a surprise. With investors often buying the EUR/USD in anticipation of a hawkish shift from the ECB, another ‘hopeful’ upswing occurred. However, the central bank disappointed investors time and time again in 2021, and the currency pair continued to make new lows. As a result, we expect the downtrend to resume over the medium term.
Supporting our expectations, I wrote the following about financial conditions and the USD Index on Feb. 2:
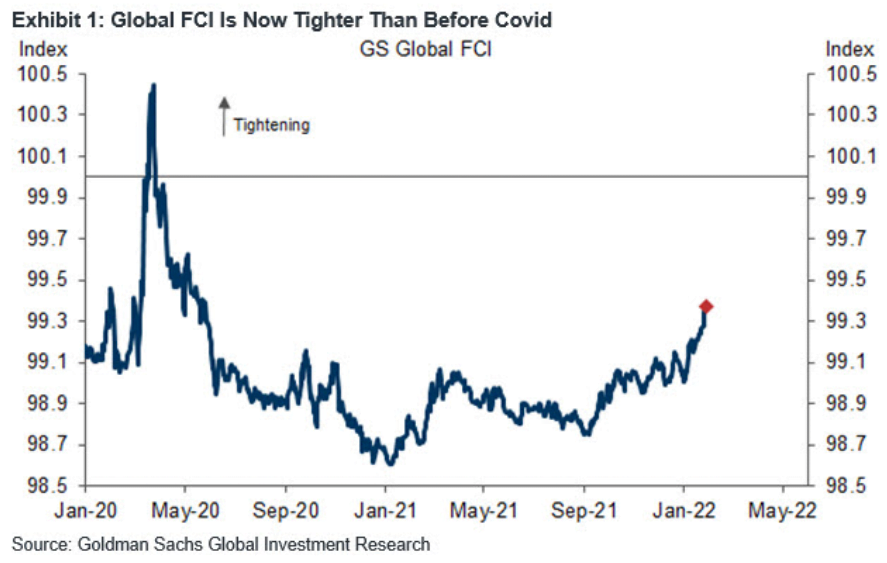
To explain, the blue line above tracks Goldman Sachs’ Financial Conditions Index (FCI). For context, the index is calculated as a “weighted average of riskless interest rates, the exchange rate, equity valuations, and credit spreads, with weights that correspond to the direct impact of each variable on GDP.” In a nutshell: when interest rates increase alongside credit spreads, it’s more expensive to borrow money and financial conditions tighten.
To that point, if you analyze the right side of the chart, you can see that the FCI has surpassed its pre-COVID-19 high (January 2020). Moreover, the FCI bottomed in January 2021 and has been seeking higher ground ever since. In the process, it’s no coincidence that the PMs have suffered mightily since January 2021. To that point, with the Fed poised to raise interest rates at its March monetary policy meeting, the FCI should continue its ascent. As a result, the PMs’ relief rallies should fall flat like in 2021.
Likewise, while the USD Index has come down from its recent high, it’s no coincidence that the dollar basket bottomed with the FCI in January 2021 and hit a new high with the FCI in January 2022. Thus, while the recent consolidation may seem troubling, the medium-term fundamentals supporting the greenback remain robust.
The Tightening Financial Conditions
Furthermore, tighter financial conditions are often a function of rising real interest rates. As mentioned, the USD Index bottomed with the FCI and surged to new highs with the FCI. As a result, the fundamentals support a stronger, not weaker USD Index. As evidence, the U.S. 10-Year real yield, the FCI, and the USD Index have traveled similar paths since January 2020.
Please see below:
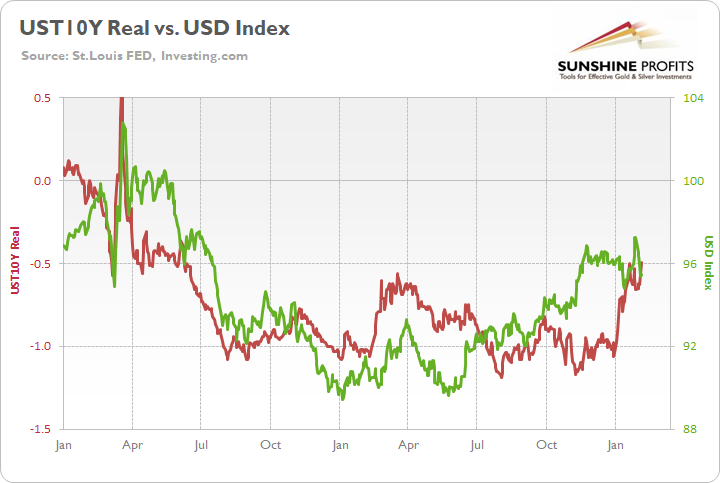
To explain, the green line above tracks the USD Index since January 2020, while the red line above tracks the U.S. 10-Year real yield. While the latter didn’t bottom in January 2021 like the USD Index and the FCI (though it was close), all three surged in late 2021 and hit new highs in 2022. Moreover, the U.S. 10-Year Treasury nominal and real yields hit new 2022 highs on Feb. 4.
In addition, if you compare the two charts, you can see that all three metrics spiked higher when the coronavirus crisis struck in March 2020. As such, the trio often follows in each other’s footsteps. Furthermore, with the Fed likely to raise interest rates at its March monetary policy meeting, this realization supports a higher U.S. 10-Year real yield, and a higher FCI. As a result, the fundamentals underpinning the USD Index remain robust, and short-term sentiment is likely to be responsible for the recent weakness.
Likewise, as the Omicron variant slows U.S. economic activity, the ‘bad news is good news’ camp has renewed hopes for a dovish Fed. However, the latest strain is unlikely to affect the Fed’s reaction function. A case in point: after ADP’s private payrolls declined by 301,000 in January (data released on Feb. 2), concern spread across Wall Street. However, after U.S. nonfarm payrolls (government data) came in at 467,000 versus 150,000 expected on Feb. 4, the U.S. labor market remains extremely healthy.
Please see below:

Source: U.S. Bureau of Labor Statistics (BLS)
Jobs Report
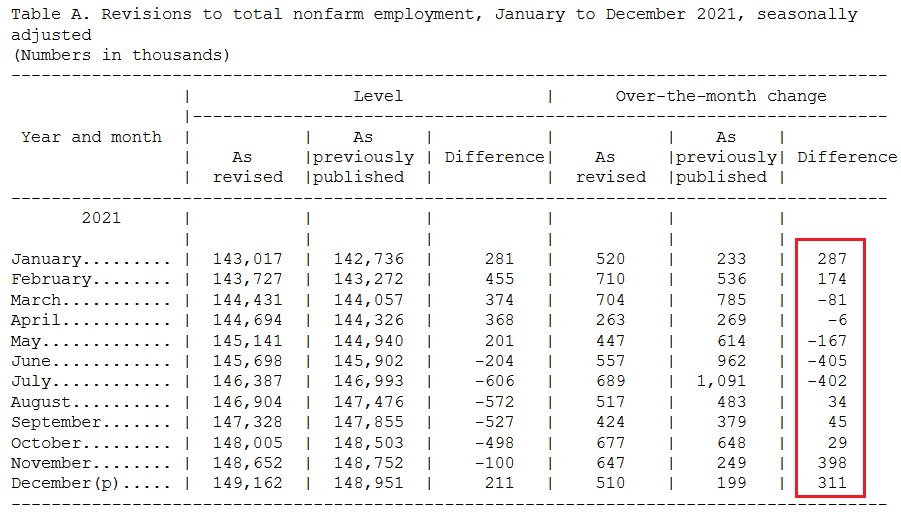
On top of that, the BLS revealed that “the over-the-month employment change for November and December 2021 combined is 709,000 higher than previously reported, while the over-the-month employment change for June and July 2021 combined is 807,000 lower. Overall, the 2021 over-the-year change is 217,000 higher than previously reported.”
Thus, the U.S. added more than 700,000 combined jobs in November and December than previously reported, and the net gain in 2021 was more than 200,000.
Please see below:
Source: BLS
As for wage inflation, the BLS also revealed:
“In January, average hourly earnings for all employees on private nonfarm payrolls increased by 23 cents to $31.63. Over the past 12 months, average hourly earnings have increased by 5.7 percent.”
As a reminder, while investors speculate on the prospect of a hawkish ECB, the latest release out of Europe shows that wage inflation is much weaker than in the U.S. To explain, I wrote on Feb. 1:
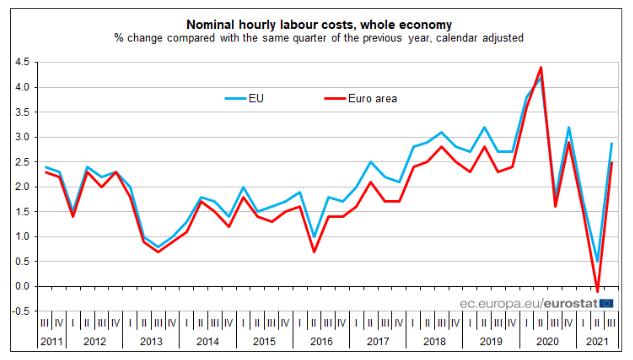
Eurozone hourly labor costs rose by 2.5% YoY on Dec. 16 (the latest release). Moreover, the report revealed that “the costs of wages & salaries per hour worked increased by 2.3%, while the non-wage component rose by 3.0% in the third quarter of 2021, compared with the same quarter of the previous year.”
As a result, non-wage labor costs – like insurance, healthcare, unemployment premiums, etc. – did the bulk of the heavy lifting. In contrast, wage and salary inflation are nowhere near the ECB’s danger zone.
Please see below:
And why is wage inflation so critical? Well, ECB Chief Economist Philip Lane said on Jan. 25:
Source: ECB
As a result, when the ECB’s Chief Economist tells you that wage inflation needs to hit 3% YoY to be “consistent” with the ECB’s 2% overall annual inflation target, a wage print of 2.3% YoY is far from troublesome. Thus, while euro bulls hope that the ECB will mirror the Fed and perform a hawkish 180, the data suggests otherwise.
In addition, while U.S. nonfarm payrolls materially outperformed on Feb. 4, I noted on Feb. 2 that there are now 4.606 million more job openings in the U.S. than citizens unemployed.
Please see below:
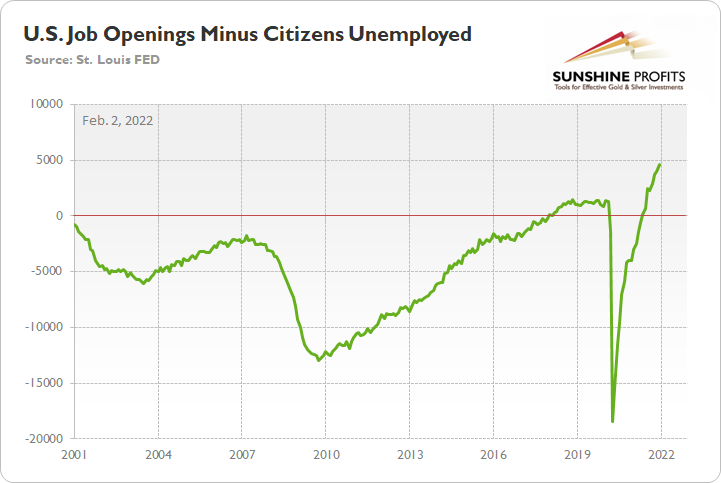
To explain, the green line above subtracts the number of unemployed U.S. citizens from the number of U.S. job openings. If you analyze the right side of the chart, you can see that the epic collapse has completely reversed and the green line is now at an all-time high. Thus, with more jobs available than people looking for work, the economic environment supports normalization by the Fed.
Thus, if we piece the puzzle together, the U.S. labor market remains healthy and U.S. inflation is materially outperforming the Eurozone. As a result, the Fed should stay ahead of the ECB, and the hawkish outperformance supports a weaker EUR/USD and a stronger USD Index. Moreover, the dynamic also supports a higher FCI and a higher U.S. 10-Year real yield. As we’ve seen since January 2021, these fundamental outcomes are extremely unkind to the PMs.
Finally, while the Omicron variant has depressed economic sentiment, I noted previously that the disruptions should be short-lived. For example, with Americans’ anxiety about COVID-19 decelerating, renewed economic strength should keep the pressure on the Fed.
Please see below:
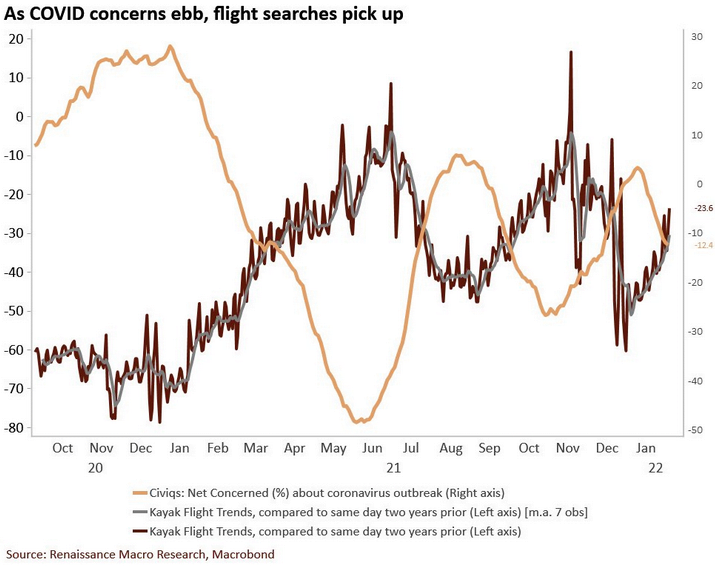
To explain, the light brown line above tracks the net percentage of Americans concerned about COVID-19, while the dark brown line above tracks the change in flight search trends on Kayak. In a nutshell: the more concern over COVID-19 (a high light brown line), the more Americans hunker down and avoid travel (a low dark brown line).
However, if you analyze the right side of the chart, you can see that the light brown line has rolled over and the dark brown line has materially risen. Moreover, with the trend poised to persist as the warmer weather arrives, increased mobility should uplift sentiment, support economic growth, and keep the Fed’s rate hike cycle on schedule.
The bottom line? The USD Index’s fundamentals remain extremely healthy, and while short-term sentiment has been unkind, rising real yields and a hawkish Fed should remain supportive over the medium term. Moreover, with the PMs often moving inversely to the U.S. dollar, more downside should confront gold, silver, and mining stocks over the next few months.
In conclusion, the PMs rallied on Feb. 4, despite the spike in U.S. Treasury yields. However, with so much volatility confronting the general stock market recently, sentiment has pulled the PMs in many directions. However, the important point is that the medium-term thesis remains intact: the USD Index and U.S. Treasury yields should seek higher ground, and the realization is profoundly bearish for the precious metals sector.
Thank you for reading our free analysis today. Please note that the above is just a small fraction of today’s all-encompassing Gold & Silver Trading Alert. The latter includes multiple premium details such as the targets for gold and mining stocks that could be reached in the next few weeks. If you’d like to read those premium details, we have good news for you. As soon as you sign up for our free gold newsletter, you’ll get a free 7-day no-obligation trial access to our premium Gold & Silver Trading Alerts. It’s really free – sign up today.
Przemyslaw Radomski, CFA
Founder, Editor-in-chief
Sunshine Profits: Effective Investment through Diligence & Care
All essays, research and information found above represent analyses and opinions of Przemyslaw Radomski, CFA and Sunshine Profits’ associates only. As such, it may prove wrong and be subject to change without notice. Opinions and analyses are based on data available to authors of respective essays at the time of writing. Although the information provided above is based on careful research and sources that are deemed to be accurate, Przemyslaw Radomski, CFA and his associates do not guarantee the accuracy or thoroughness of the data or information reported. The opinions published above are neither an offer nor a recommendation to purchase or sell any securities. Mr. Radomski is not a Registered Securities Advisor. By reading Przemyslaw Radomski’s, CFA reports you fully agree that he will not be held responsible or liable for any decisions you make regarding any information provided in these reports. Investing, trading and speculation in any financial markets may involve high risk of loss. Przemyslaw Radomski, CFA, Sunshine Profits’ employees and affiliates as well as members of their families may have a short or long position in any securities, including those mentioned in any of the reports or essays, and may make additional purchases and/or sales of those securities without notice.


