
Logica Capital commentary for the month ended October 31, 2022.
Summary
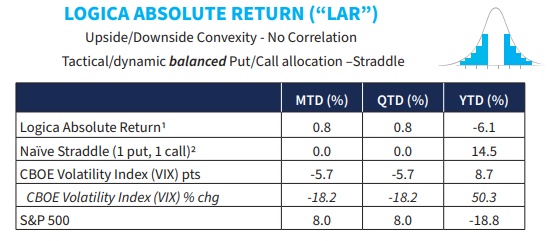
As we began last month – the S&P 500’s habit of seemingly obeying a calendar schedule continued in October with another large month – this time positive. Implied Volatility/VIX had a fairly “normal” month, which continued the pattern of muted implied volatility pop on down market moves, yet normal or (even outsized) implied volatility crush on market upside. While frustrating, this lopsided behavior inevitably has an end, and of course, must decrease to what becomes attractive long vol levels (to state the obvious, as IV falls further, it has less room to fall – to the empirically substantiated, and well-reasoned, low double-digit floor to market volatility).
Q3 2022 hedge fund letters, conferences and more
Commentary & Portfolio Return Attribution
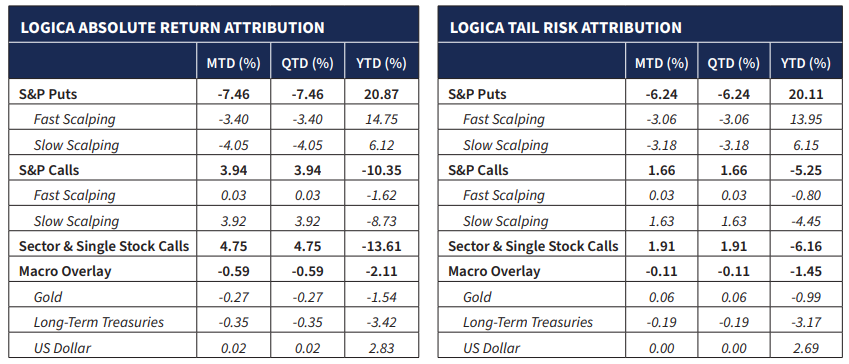
There weren’t many surprises in our attribution for October. Our S&P Puts – Fast Scalping module had a bit more success than the slow scalping, once again illustrating the value of diversification in trading frequencies, where sometimes slow beats fast and other times fast beats slow – and both are equally likely given the unknowable specificity of the future path. Separately, our Macro Overlay continued to be a slight drag on return, even at its reduced size – though we continue to believe a small allocation to these traditionally flightto-quality assets is warranted.
Year-to-Date, the “anti-momentum” portion of our Sector & Single Stock Calls has dramatically outperformed the S&P 500 Index (-12.5% vs -18.8% for the S&P), but October was a month of slight underperformance in the diversified anti-momentum module (+6.0% as a standalone, MTD) and equally so in the momentum oriented module (+6.8% as a standalone, MTD) as compared with the S&P (+8.0% MTD). This differential is particularly interesting given such an impactful S&P move, as it highlights strong dispersion across the S&P; if neither group of broadly opposing S&P exposures –momentum and anti-momentum – could achieve the S&P’s gain, the largest contribution was clearly from a particularly concentrated basket of names. Scalping in S&P Puts and Calls provided nice alpha, but not quite enough to overcome the slight underperformance of the rest of the up-capture book.
“It is useless to put on your brakes when you’re upside down.” – Paul Newman
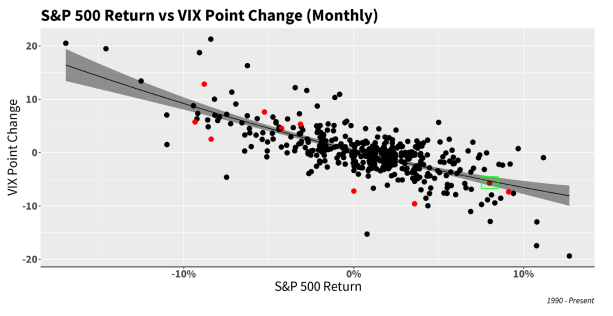
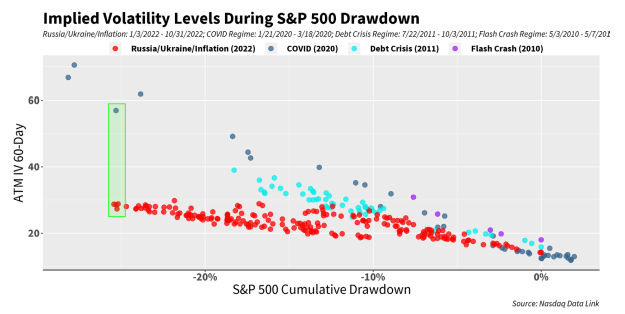
In the chart below, we can see that October 2022 (red dot in green box) was right in line with expectations of the S&P 500/VIX relationship, landing almost spot on the best fit curve. This is of course ironic, as we get almost the ideal expected S&P/VIX relationship with the S&P experiencing an 8% upside move, but on the other side of the coin, and as we’ve witnessed all year long, there’s substantial lack of VIX pop relative to S&P downside moves. To state the obvious, it is unnerving to carry a long vol portfolio in an environment where the short vol crushes are outperforming the long vol pops; where vol itself – the right skew poster child — is exhibiting negative skew.
Similarly, with respect to the current YTD drawdown in the S&P 500, we see more of the same of what we’ve been describing all year long: a measured drawdown with lack of IV upside for the extent of S&P downside, and once again, what we might call normal IV crush (historically speaking) on most market moves to the upside throughout the period. This is certainly not the asymmetry that lends itself to long vol thriving:
While we have seemingly been beating the same drum repeatedly in our 2022 letters, the conclusion that 2022 has not been an ideal environment for long vol is at this point obvious. And, as such, it’s not just us that has noticed, and wants to talk about it. An August 17th article published on CBOE’s website titled The VIX Index and Muted Volatility in 2022 stated that “Looking back at the first half of 2022 and considering the magnitude of the draw-down in the S&P 500 Index, the volatility environment has been profoundly abnormal. Since the launch of the VIX Index, the past six-month period has been the weakest for volatility in 29 years, relative to similar S&P 500 Index price moves…those using put options to hedge a downside move in the S&P 500 likely did not get the response they were looking for from their option hedges.”
For evidentiary support, the article also included some related statistics. Though several were interesting in different ways, one of the more powerful measures was a scaled-out view of long-term volatility, where they showed that “on average, prior to 2022, the one-year VIX Index rose 73% during similar drawdown periods in the S&P 500 Index. On June 30, 2022, the one-year VIX Index had risen only 13%.”
“Two blind men waited at the end of an era, contemplating beauty.” – Brandon Sanderson
For us, though, the muted vol is not even necessarily the pertinent issue, as every thematic/systematic strategy will have market regimes where they work beautifully (for long vol, think COVID, February 2018, Q4 2018, August 2015, etc…) and those where the expected payoff and convexity (the 2022 case) just isn’t quite there. The question we therefore concern ourselves with is:
- Is volatility “dead,” or is 2022 an aberration? Is this “abnormal” or the new “normal”? Can volatility be “trusted” again? Etc…
First, we begin by attacking the questions. In a world of sparse data, and fat tails, there is no such thing as normal/abnormal; simply, it takes mounds of data to determine the “normal” reference level. The essence of fat tails is that they are fat, which translating the mathematics into the actionable concepts, leaves us with the inability to assess normal behavior, and likewise, to know any measure of the variance around what may or may not be normal. Is a single data point in a fat tail “abnormal” or is it just another point that will continue to define the fatness of the tail? Outliers lie out. Accordingly, in the absence of reliable evidence, the only means to trust or distrust the future viability is logic.
That said, to enable us to hone in on the applicable logic, it sometimes helps to view a few data points for their anecdotal contribution. To this end, when we look through recent history, we see several periods where the underlying market has drawn down rather significantly, and long volatility has not necessarily been the optimal defensive strategy to employ. Remember that even though long volatility is typically negatively correlated with its underlying market, it is not short that market per se. Behold, the subtle dance between correlation and causation.
“It’s not the size of the dog in the fight, it’s the size of the fight in the dog.” – Mark Twain
In addition to our chart above highlighting 2022 vs some other regimes that did contain a measurable volatility pop, we take a look at a few other regimes/drawdowns that actually didn’t, much like 2022 hasn’t.
As the winner in this category, we find it interesting to look back at the 2007-09 Great Financial Crisis, but splitting it up into two phases: Early, and Late. We can see below that 2022 (red dots) bears an astonishing resemblance to the “Early” part of the GFC (black dots) and lasted around the same amount of time (about 1 year). Then as we approached Q4 of 2008, as everyone undoubtedly recalls, the bottom fell out of the market, and VIX skyrocketed:
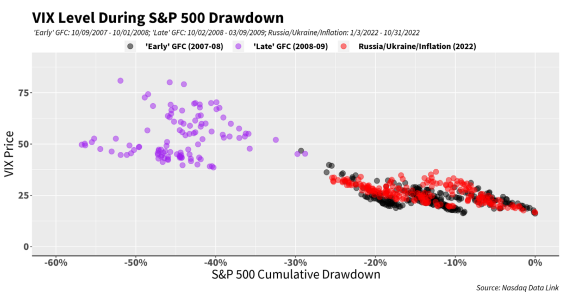
When we look back at Logica’s simulated performance during this Early GFC time period, we find it very similar to the performance we have experienced in 2022, and then, what followed was a very profitable period during the Late GFC time frame
To be clear, we certainly aren’t in the business of predicting crises, and the above is in no way implying that we think this market is on the verge of collapse. If anything, it reveals one seemingly logical reality: that volatility can easily spike aggressively after an extended muted period, of course, as a result of true panic and/ or unbounded uncertainty that follows the “muting”. In other words, the very fact that it did occur this way means that it can occur this way. As to whether it does or not – well, that likely depends on whether or not there is enough of a stress/panic event to instigate it. Welcome to the unknown.
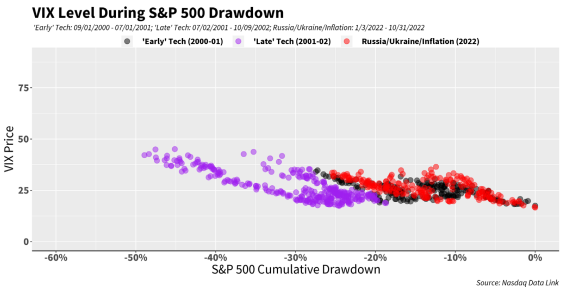
For example, if the drawdown does continue further in a measured grind down pace, it’s just as likely that we experience an outcome similar to the 2000 Tech Bubble, where VIX/IV doesn’t rise that much over the extended period of time and increasing magnitude of cumulative drawdown. Albeit, it certainly gained far more than it has in 2022 (reaching closer to 50):
All that said, and as we mentioned in our last letter, one of the reasons that both LAR and LTR have been able to hold up fairly well in 2022 is because both strategies use at-the-money (ATM) put options, as compared with out-of-the-money (OTM) put options that have seen some additional loss from skew compression. Essentially, as one moves further and further OTM, one is more and more reliant on implied volatility moving rather than merely the underlying (delta) moving. “Vomma” is the option Greek some use to denote a position’s sensitivity to the change in implied volatility, and this sensitivity is higher in OTM options, and lower in ATM options.
Accordingly, those strategies that use OTM – especially very far OTM – will typically be more path dependent, i.e., they require a much more specific path to materialize in order to pay off. Granted, when the payoff does come, it is typically a larger payoff than a strategy that uses ATM options. At the end of the day, we want our strategies to hold up and thrive in either of the 2 drawdowns above, therefore they must be less pathdependent than most in the volatility space.
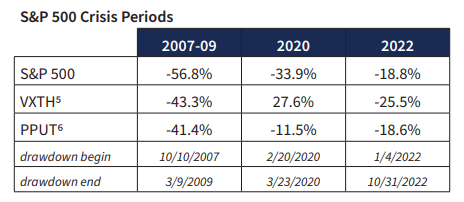
To this end, every so often in our letters we have been keeping track of a couple of products/indices that use volatility as a hedge for long positions: one product through VIX Calls, and the other using S&P 500 Puts – and both of which use OTM options as their long volatility component. We continue to see these products fail to provide much benefit (in the case of PPUT) and ironically, even provide negative benefit (in the case of VXTH). The point here is not to demean these products and/or their construction, but rather to highlight the incredible difficulty of long volatility given the behavior of this year’s declining market as compared to other recent crisis periods – and especially with regards to out-of-the-money (OTM) protection, as these 2 products employ.
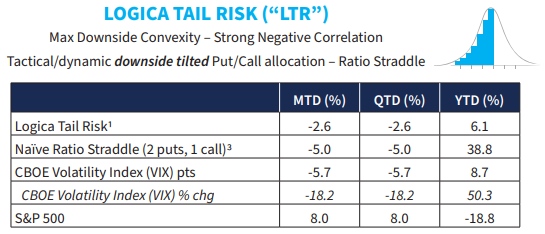
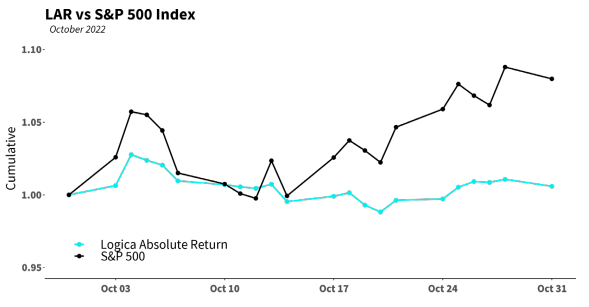
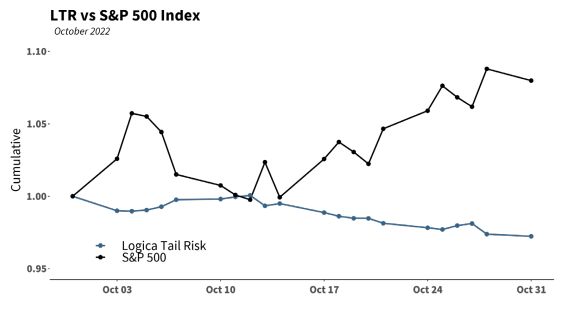
Finally, taking a look at the daily movement of our strategies for the month, we can see that LTR was able to minimize its drawdown while providing a negative correlation to the S&P 500 Index day by day, while LAR benefitted from its positive delta exposure.
Follow Wayne on Twitter @WayneHimelsein


