
Headline:
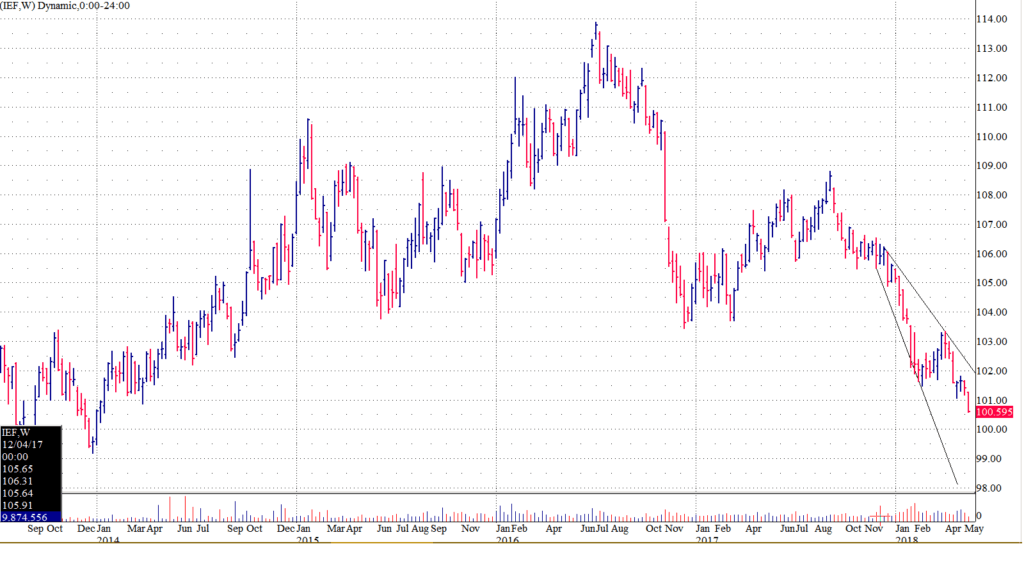
Chart + Fundamentals = Indicating Even Lower Prices + Higher Yields
[REITs]Q1 hedge fund letters, conference, scoops etc, Also read Lear Capital: Financial Products You Should Avoid?
As The Dollar Continues To Launch + U.S. Economic Activity Firms…Treasury Prices Are Sagging As Yields Leap.
That The Fed Is Now At/Beyond Its Own Inflation Targets…Their Narrative Naturally Changes i.e. higher inflation can be tolerated for a period of time…not seen as a sustainable trend…etc.
But Maybe The Federal Reserve Governors Are Mistaken?
If They Are Incorrect…And Yields Continue To Move “Up & To The Right”…The Negative Economic Impacts On An Especially Levered Private + Public U.S. Economy…Are Extremely Acute…Maybe Even More So For Emerging Markets As The Dollar Continues To Be Very Well “Bid.”
Contact The Author: [email protected]
Article by Global Slant


