Crescat Capital letter to investors for the first quarter ended March 31, 2019, titled, “Dismantling The Bull Case.”
Dear Investors:
The year-to-date rally in global risk assets after the Fed flip appears to us to be a last gasp of speculative mania for the current economic cycle.

Q1 hedge fund letters, conference, scoops etc
In our view, three flawed narratives are driving late-cycle euphoria in financial markets today:
- “Central banks can always prevent a downturn in financial markets and the business cycle”;
- “US stocks valuations remain attractive”; and
- “Chinese stimulus and a US-China trade deal will reignite growth in the second half of 2019.”
We believe that the first two storylines are simply wrong. We show why herein. Regarding the third, in our view, China is much more likely to tank the world economy over the next several quarters than rescue it given the historic credit imbalances there.
Central Banks Do Not Have Your Back
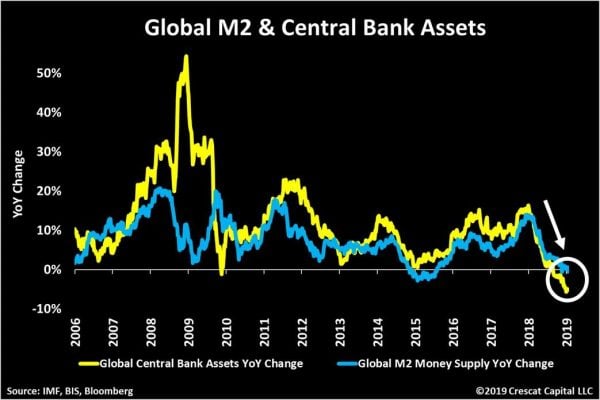
There has been a huge misconception that global central bank liquidity is what is driving stock prices up today. Our work shows that both global M2 money supply and central bank assets have been contracting on a year-over-year basis so far in 2019. That tells us liquidity has not been the driver of the market-top retest rally; hope has been.
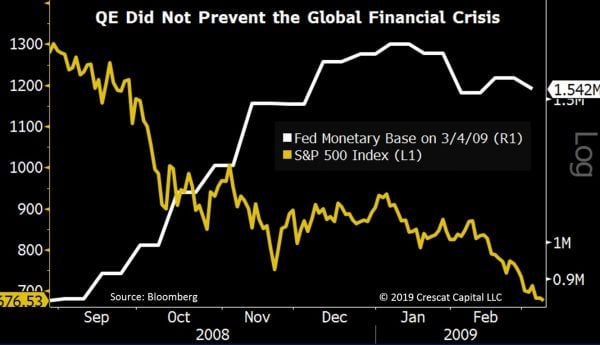
But even when global QE returns, it is likely to be no saving grace. As shown above, starting in September 2006 led by China, global central banks increased their balance sheets by $3.9 trillion or more than 50% through March of 2009. This unprecedented level of money printing did not prevent the Global Financial Crisis. Rather it preceded and accompanied it.
Even the Fed’s QE1 which started in 2008 did not stop stocks from plunging; it only coincided with it as shown below.
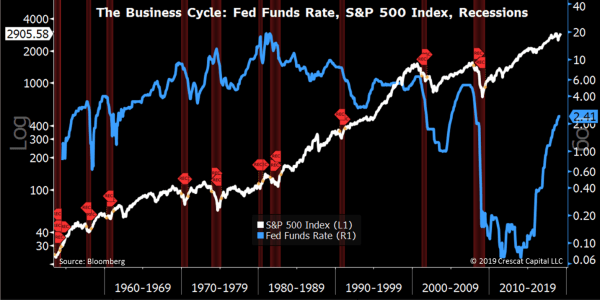
The same goes for the Fed’s past changes in interest rate regimes from hiking to easing which are much more often bearish than bullish for stocks. As we show in the chart below, there were twelve times since 1954 (the history of the Fed Funds) that the US central bank paused its interest rate hiking cycle and then reversed it. Only three of those reversals ended in soft landings (1966, 1984, and 1995). In contrast, nine were associated with stock market downturns that led to recessions. We believe the three soft landings were possible because they occurred early in the business cycle, an average of only three years into the expansion. The Fed’s December 2018 hike followed by a pause, on the other hand, occurred a record 9 1/2 years into the economic expansion, beating the pause at the peak of the tech bubble by one quarter! Of the nine pauses associated with market downturns and recessions, the economic contraction began an average of just five months from the date of the last rate hike. That would be next month if this is the average delay! But we likely won’t know officially when the next recession begins, as typical, until months after it has started when prior-reported economic data gets revised downward.
It is also important to note that the stock market peak associated with the nine recessions occurred an average of two months before the last Fed rate hike. The September 2018 market peak, therefore which we are re-testing though still shy of, could still be relevant; it was three months before the Fed’s last hike. Even if the market pushes marginally higher here, it will still be very likely that we are near a top based on Crescat’s work.
It is also important to note that none of the historical corrections and bear markets that surrounded late-cycle Fed rate reversals bottomed until after the economy entered the recession. It seems highly prudent therefore to wait until the next inevitable recession which could be right around the corner before buying stocks today.
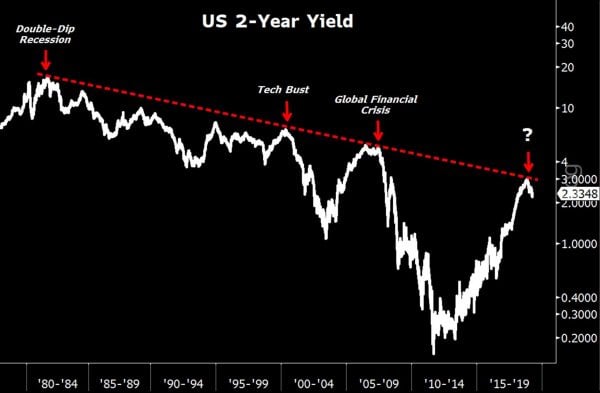
Another good macro timing signal for the peak of the stock market and business cycle is when the credit markets start pricing in Fed rate-cuts late in the expansion. That has never been a bullish sign. As shown in the chart below, every prior time the 2-year yield started to fall after re-testing a multi-decade resistance line going back to 1980, a major bear market and recession followed. Will this time be any different?
Precious Metals
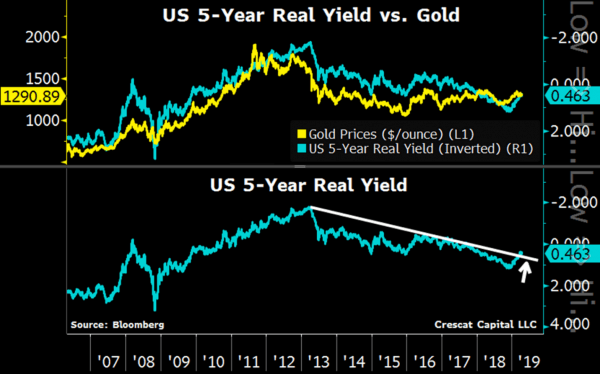
The recent drop in nominal rates is also causing a drop in real yields. Below we show a multi-year breakout of the 5-year TIPS, inverted, which reflects the real interest rate. Real rates have followed gold prices remarkably closely for years. If this pattern holds, even if inflation expectations remain muted, the decline in nominal rates should be positive for gold, especially at today’s historically low valuation relative to the global fiat monetary base.
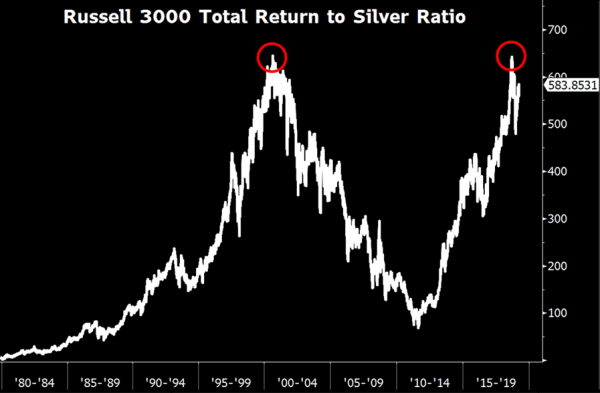
It’s stunning to us how historically depressed the valuation for gold’s high-beta, safe-haven cousin, silver, is this late in the cycle. One interesting way to see this is by comparing silver’s performance relative to a broad US stock index. Below, we show Russell 3000-to-silver ratio near record levels. It formed what appears to be a double top after retesting tech-bubble-peak levels last year.
Global Yield Curve Inversion
As we noted before, today we have an unprecedented amount of economies with 30-year yields lower than LIBOR overnight rates. Spain just joined the pack recently and we now have fourteen economies showing this negative spread. For us, it reiterates Crescat’s global yield curve inversion thesis, which is negative for global stocks and positive for future inflows into US dollars, and US Treasuries by extension as haven assets in a global financial crisis. The fact is, US yields across the entire curve today are attractively high compared to many global developed market alternatives.

When financial crises have unfolded in the past, US rates have tended to converge with global rates. Therefore, we expect many of these yield spreads to narrow significantly as the global economic cycle turns down.
US Treasury vs. German Bund Spread
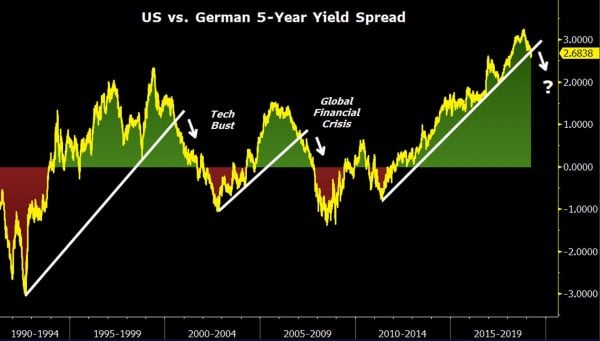
US vs. German 5-year yield spread just broke down from a multi-year support line! Previous breakdowns timed the market top in 2000 & 2007. It’s another critical macro timing indicator.
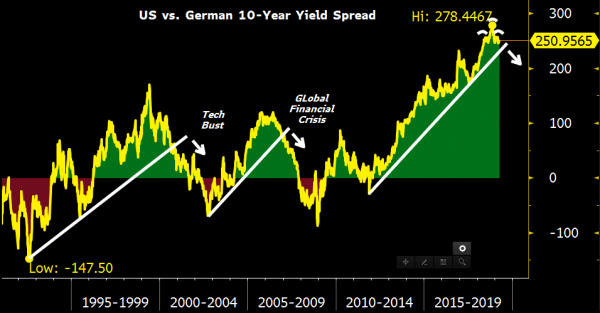
The US-German 5-year yield spread breakdown is possibly leading a big move that is likely to happen on 10-year spread. In our global macro hedge fund, we are long US 10-year Treasuries and short 10-year German Bunds to play the likely breakdown and narrowing of that spread as shown in the chart below. The legendary former bond king, Bill Gross, was too early in this trade. It got away from him, but it was still a good idea. The trade is now lining up with so many of our other macro timing indicators that we believe the spread is finally getting ready to converge. A classic head-and-shoulders pattern meanwhile appears to have formed over the last year, a bearish technical set up.
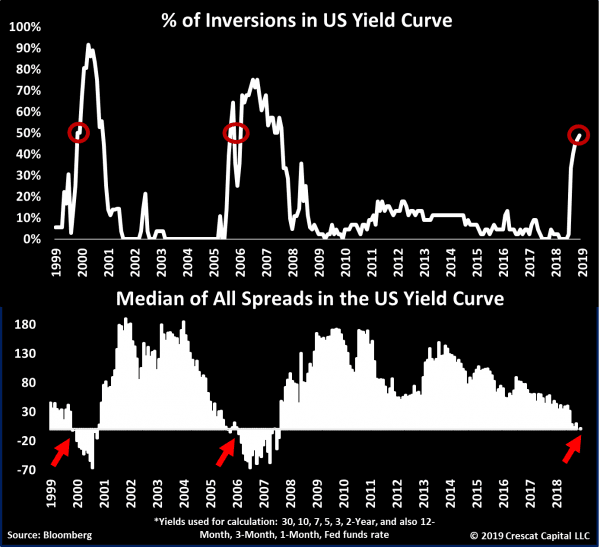
US Yield Curve Inversions
Below is our comprehensive way of measuring inversions in the US yield curve. This model calculates all possible 44 spreads across US rates, and the percentage is now close to 50%, just as high as it was at the peak of the tech and housing bubbles. Historically, these elevated levels of inversions tend to be great times to own precious metals and sell US stocks.
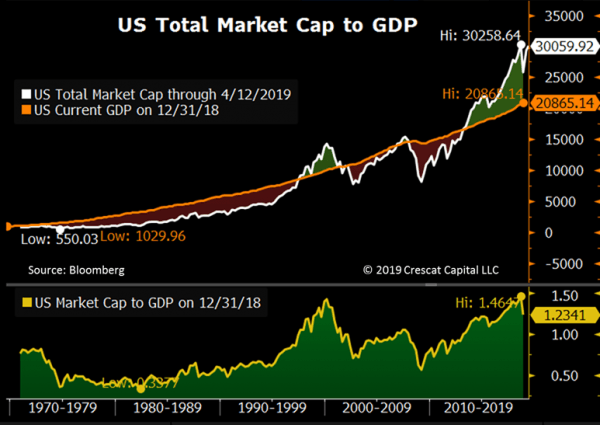
US Equity Valuations Near Record Highs
The recent surge in stocks has pushed valuations back near all-time highs. Below, we show that the total US market cap-to-GDP ratio reached its highest ever last September at almost 150% prior to the 4th quarter market meltdown. This measure is close to re-testing its highs again today! The first panel of the chart below illustrates how the total US equity market capitalization tends to fluctuate above and below GDP across economic cycles. A multiple of one time GDP tends to be the median valuation over time. But valuations rarely stop at the median during bull and bear market cycles. They have become more stretched than ever relative to GDP in the current business cycle. In the second panel, we can clearly see that valuations in this cycle went even higher than in the tech bubble.
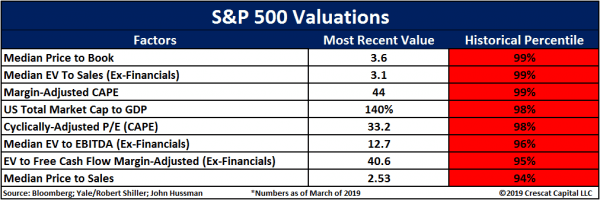
Total market cap to GDP is just one example of US stock market valuations at historic extremes. Crescat’s models show that record valuations were hit on September 2018 across most valuation measures. We are just shy of re-testing them today:
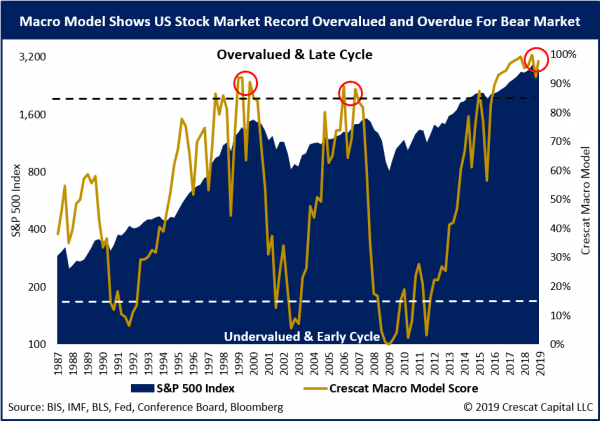
Crescat Macro Model
Crescat’s macro model combines sixteen factors across key fundamental, economic, and technical indicators to time the stock market and business cycle. After the year-to-date rally, the model is just two percentage points from record overvalued and record late-cycle levels! The yellow line below shows a back test of our model score going back to 1987. The model did extremely well at timing the tops and bottoms of the last two US stock market and business cycles. This time, the S&P 500 briefly entered overvalued/late-cycle levels in September of 2015 and was followed by a meltdown in China and emerging markets that Crescat capitalized on in 2015. A pause in 2016 in Fed interest rate hikes gave emerging and developed markets a new lease to extend the global business cycle. As hikes resumed in 2017, the market and our macro model score only surged to new highs. In September 2018, we reached what we believe were and still are truly mania levels.
We strongly believe US stocks are overdue for a bear market and the time of reckoning is near. The bear market started to unfold in the fourth quarter of last year in our view. But now we are close to retesting the September highs. Based on Crescat’s macro model score, and a myriad of other indicators, there is a strong probability that this rally will fail and that the bear market will resume.
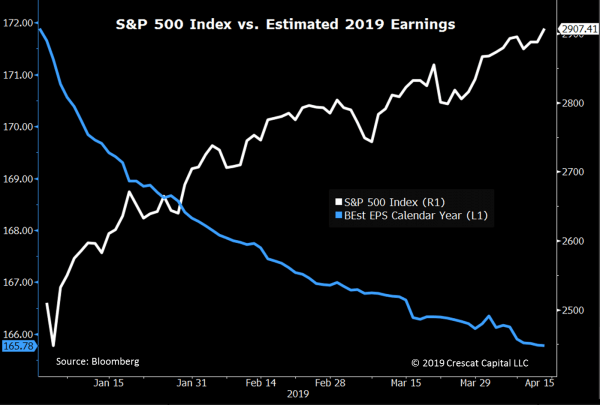
It’s interesting to us how surging US stocks are in complete disconnect with the deteriorating fundamental outlook. Earnings estimates for 2019 in fact have been plunging all year while diverging significantly from sharply rising equity prices. This is not a positive set-up for stocks as we start the Q1 earnings season.
Sentiment Indicators
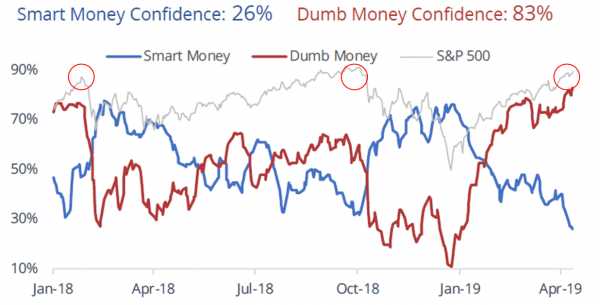
The recent stock market rally has remarkably similar fingerprints to the January 2018 and September 2018 speculative tops as shown by the two charts below courtesy of Jason Goepfert at sentimenTrader.com.
Jason’s smart versus dumb money indicators incorporate OEX put/call and open interest ratios, commercial hedger positions in equity index futures, and the current relationship between stocks and bonds. The smart-money indicator is currently near its lows while the dumb money one is near its highs. A similar wide spread between these two indicators preceded the market’s two steep selloffs last year.
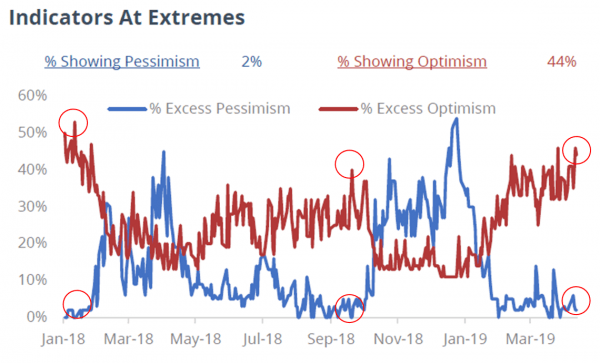
SentimenTrader also tracks 60+ market indicators and tallies the percentage of them showing extreme optimism versus extreme pessimism. As shown in the chart below, 44% of these indicators are registering extreme optimism levels in equity markets today. Conversely, only 2% of these indicators are showing significant levels of pessimism. Similar to the smart vs. dumb money spread, such divergences performed extremely well at identifying the last two interim market tops.
Record bullishness sentiment rarely ends well for longs. Neither does extreme divergences between speculative longs and professional hedgers who are short.
Certainly, indicators like these in hindsight could have helped us see how temporarily oversold the markets were in late December to better manage the recent counter attack from the bulls. While we have stayed grounded primarily in our macro and fundamental research, and that will not change, sentiment indicators can help on the margin. We hope they will help others to can see why timing for many of our tactically bearish macro views could be ripe.
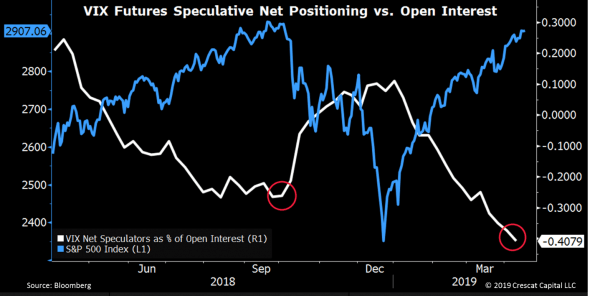
The chart below shows a third sentiment indicator we found that looks incredibly frothy today, VIX speculation at an extreme. Speculative futures traders are more net short stock market volatility than they were at the September market peak.
China More Likely to Tank than Rescue the Global Economy
We think those looking for China growth resurgence or trade deal to materially extend the stock market and business cycle are sorely mistaken. We have written extensively about China’s 400% growth in banking assets since 2008, likely creating the largest credit bubble and overvalued currency in modern financial history. Based on this unsustainable rate of credit expansion, China was responsible for over 60% of global GDP growth since the global financial crisis. The country’s massive investment in non-productive infrastructure assets was financed on credit and created high GDP growth but failed to add to the wealth or debt-servicing capacity of the country. As a result, China appears to us to be a financial crisis waiting to unfold.
State-directed misallocation of capital has compromised the savings of Chinese citizens. In other words, there is an enormous non-performing loan problem that we believe renders China’s banks insolvent. The country’s citizens, the banks’ creditors, are the ones holding the bag. When the Chinese economy inevitably implodes under its bad debt, the government will be forced to print money to recapitalize its banks and bail out its citizens to avoid social unrest. This massive money printing will almost certainly lead to a currency crisis.
The Trump administration’s hardball on trade is just one of many catalysts for the bursting of the China credit bubble. Whether there is a trade agreement or an ongoing trade war, either one would lead to a continued decline in China’s current account balance which should exert downward pressure on its currency. We think China’s increasing fiscal deficit due to the recent stimulus will also exert new downward pressure on the currency.
While the US administration may continue to hype an impending trade deal as hope for financial markets, we believe trade talks have dragged on for too long already to not have wreaked havoc on global supply chains and economic growth for the rest of the year. As the light continues to get shined on China, it should become clear that nothing beyond a token trade deal is likely to ever be reached. It is much more likely that the ongoing trade negotiations will only continue to serve to awaken the US government and its citizen voters to the egregious extent of China’s malfeasance.
China’s cyber hacking, intellectual property theft, and forced technology transfer are likely to be impossible roadblocks to arriving at any meaningful and enforceable trade deal. The U.S. Trade Representative reports make it clear that China has failed to live up to its commitments to open its markets to fair trade ever since it was permitted to join the WTO in 2001. China’s state-directed economic policies are simply incompatible with an international trade system based on open, market-oriented policies and rooted in the principles of nondiscrimination, market access, reciprocity, fairness and transparency.
With election season upon us in the US, the nature of our country’s engagement with China should once again become a major campaign issue. Taking a strong stance against China’s trade and human rights transgressions would likely have broad, bi-partisan voter support. Democracy, liberty, and justice are the foundation that has made the US a true world economic superpower. Contrast that with China’s authoritarianism, suppression, and corruption. Sure, there may be some corruption in democratic, advanced economies too. But we believe it pales compared to China.
In our view, the trade talks are closer to morphing into a new cold war than to being resolved by a substantial trade pact. Meanwhile, much like downfall of other totalitarian communist economies, we believe both internal and foreign capital is likely to continue fleeing the country, exerting downward pressure on its currency, economy, and banks. We continue to have a negative view on both the Chinese yuan and Hong Kong dollar that we are expressing in our global macro fund through put options on these currencies. We also are short richly-valued, US-listed “China-hustle” stocks in both hedge funds.
Crescat Remains Steadfast in our Views and Positioning
Today, with historic US equity valuations, record credit bubbles globally, and longest US economic expansion cycle ever likely to soon come to an end based on our models, we remain steadfast in our net short US and global equities position in our hedge funds. We are also short subprime credit in our global macro fund. We remain long precious metals and precious metals mining stocks across all our strategies.
There is indeed a US business cycle as well as a global economic cycle. We believe both are ripe for a downturn. We intend to capitalize on it like we did in the fourth quarter of last year which should be only the beginning. Like last year, we are having what we think is only a temporary pullback as the US stock market retests its all-time highs. Like last year, we believe global financial markets are poised for a major downturn. Staying grounded in our models, themes, and positioning was key to our strong year in 2018. Such grounding we believe will be key to generating strong performance again in the coming months and quarters.
We will continue to follow our model signals and risk controls, but we aim to stay net short global equities and subprime credit until the next global economic downturn has been widely acknowledged and stock values are once again cheap before we get significantly net long again.
As macro managers with a strong value bias, we remain confident that the underlying intrinsic value of Crescat’s portfolios at any time are worth substantially more than the market is quoting them (longs worth more and shorts worth less) or we would not be in those positions. This grounding gives us the fortitude to withstand a moderate amount of market volatility and persevere for long-term high absolute and risk-adjusted returns compared to our benchmarks as we have been able to deliver historically and expect to in the future. We think the financial markets are presenting an incredible setup for Crescat’s strategies today.
Sincerely,
Kevin C. Smith, CFA
Chief Investment Officer
Tavi Costa
Global Macro Analyst


