Key highlights for 2018:
- Hedge funds bounced back to positive territory in April, up 0.55% with the underlying markets, as represented by the MSCI AC World Index (Local) up 1.18% over the same period. On a year-to-date basis, managers gained 0.23% with 10% of them posting returns in excess of 5%.
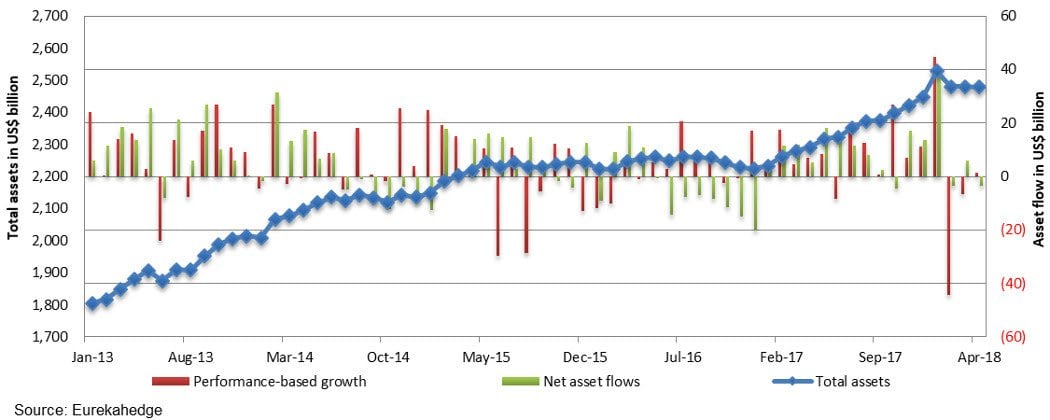
- Total hedge fund assets grew by US$31.9 billion over the past four months, with US$36.2 billion attributed to investor inflows while managers posted performance-based losses of US$4.4 billion. Investors have been selective in their allocations across strategies with long/short equities and macro hedge funds seeing stronger subscriptions year-to-date.
- CTA/managed futures managers posted their third consecutive month of investor redemptions, totalling US$5.9 billion, bringing its year-to-date outflows to US$2.8 billion. Managers have posted performance-based losses of US$11.7 billion as of April 2018 year-to-date, the highest performance-based losses among all strategic mandates.
- All strategic mandates were up this month with the Eurekahedge Distressed Debt Hedge Fund Index posting the best returns, up 1.12% during the month – the only strategy to post four consecutive month of gains since the start of the year. Distressed debt managers saw investor redemptions of US$1.3 billion as of 2018 year-to-date while performance-based gains of US$0.8 billion were recorded.
- Asian hedge funds posted their third consecutive month of losses in April, down 0.12%. On a year-to-date basis, Asian managers lost 0.03%, with weaknesses led by Japan and India mandated hedge funds which were down 1.69% and 1.19% respectively.
- Asset base for the US$1.65 trillion North American hedge fund industry grew by US$18.4 billion over the year, with most of this growth attributed to investor allocations of US$22.1 billion year-to-date, while performance-based losses totalling US$3.7 billion were recorded.
- The Eurekahedge Crypto-Currency Hedge Fund Index rebounded to positive territory in April, up 45.43%, while its 2018 year-to-date figure is still in the red, down 21.87%. In contrast, bitcoin has lost over 26% over the same year-to-date period.
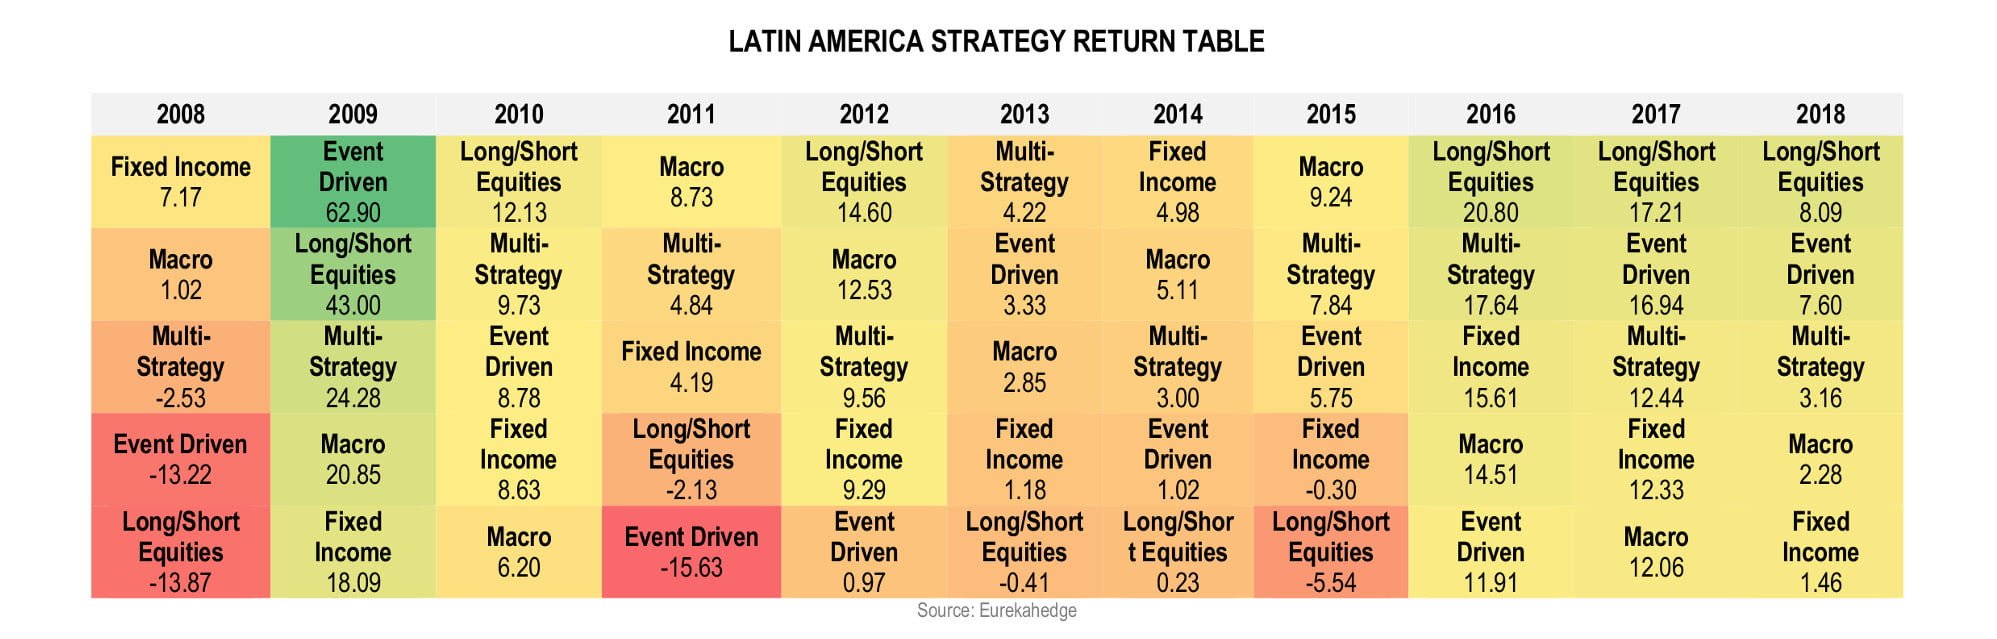
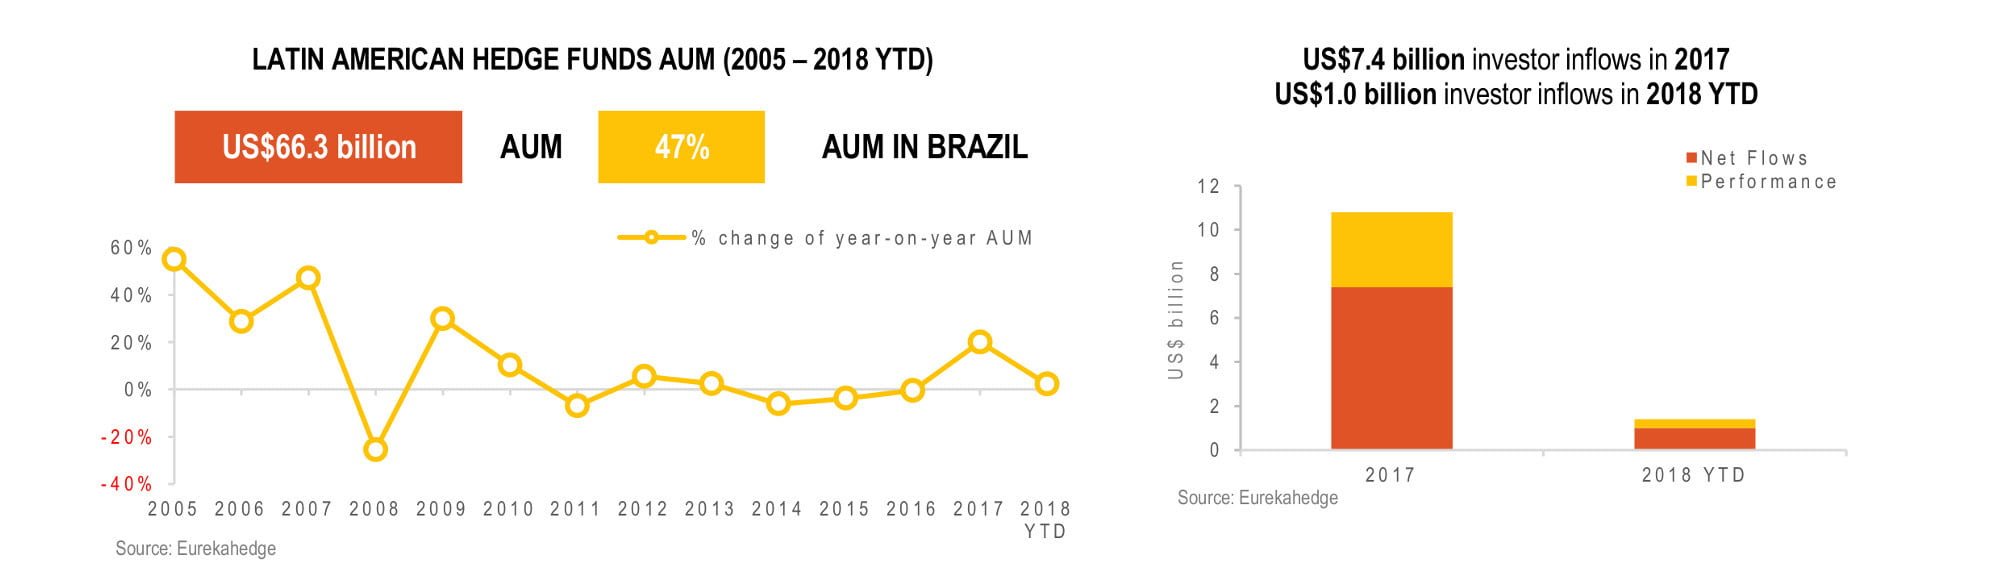
- While hedge funds with exposure into Latin America posted impressive returns this year, launch activity has been rather muted. Closures have outpaced launches annually from 2011 to 2018 year-to-date, with a total of 236 closures and 127 fund launches during this period. For more details, see the 2018 Key Trends in Latin American Hedge Funds report.

Q1 hedge fund letters, conference, scoops etc, Also read Lear Capital:
2018 Key Trends in Latin American Hedge Funds
Hedge funds successfully traded their way around an overwhelming month in April and were up 0.55% while underlying markets as represented by the MSCI World Index (Local) gained 1.18% during the month. Investors' risk appetite improved in April amid waning concerns over trade war, bolstered by the 'soft' tone of Xi Jinping in response to US trade sanctions. Developed markets outperformed their emerging market counterparts during the month, as the latter still remained rather volatile with the region equity markets posting a slightly negative return during the month on the back of a strengthening US dollar and concerns over US-China trade spat. Equity markets rebounded in April with strength led by European and North American markets with mixed to flat performance across Asian equity markets. Economic data for Q1 2018 was largely encouraging albeit recovery was at a slower pace with indicators pointing towards global economic expansion. Meanwhile, 58% of the underlying constituent funds for the Eurekahedge Hedge Fund Index were in positive territory during the month, with nearly 5% of them reporting gains in excess of 5%. European hedge funds led performance among regional mandates this month, up 0.78% while distressed debt managers topped the table across strategies, gaining 1.12% over the same period.
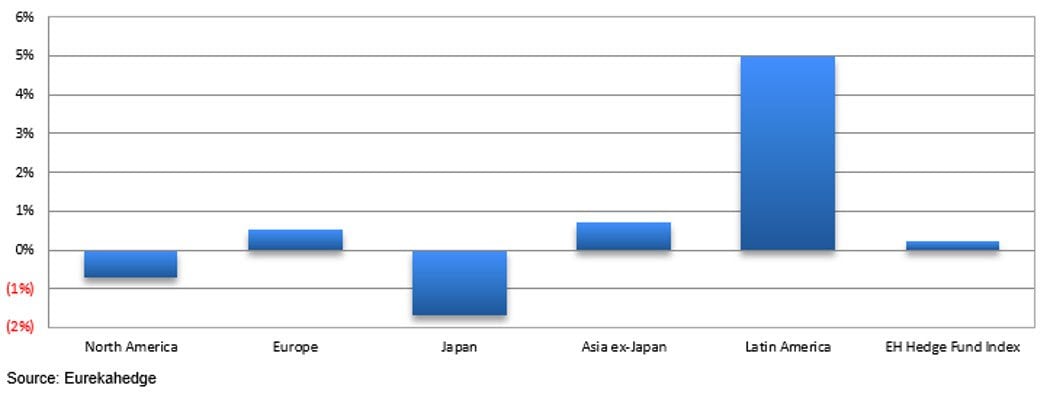
On a year-to-date basis, hedge funds were up 0.23% while underlying markets declined 1.08%. Latin American hedge fund managers led the table on a year-to-date basis, up 5.00% followed by their Asia ex-Japan and European counterparts with gains of 0.71% and 0.52% respectively.
April 2018 and March 2018 returns across regions
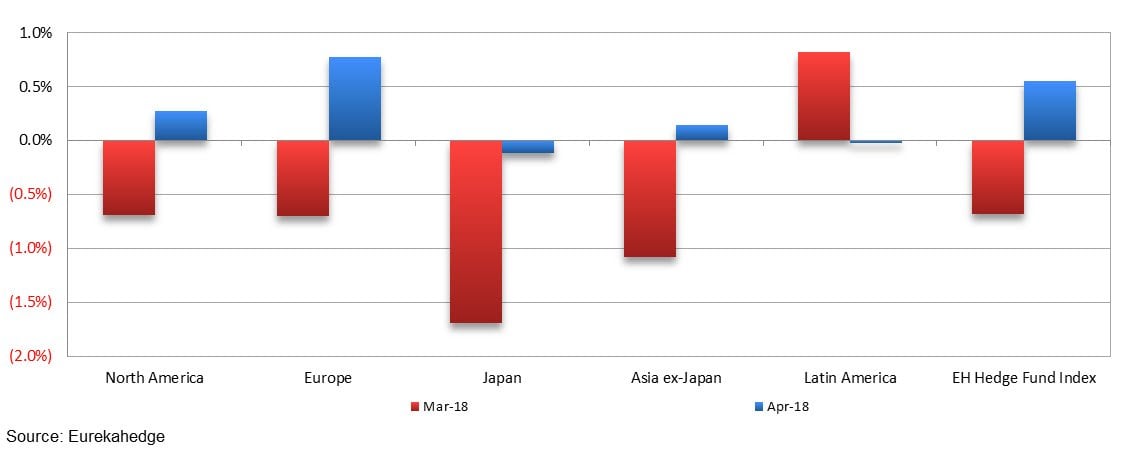
Performance was a mixed bag across regional mandates with European hedge funds in the lead this month, gaining 0.78% as equity performance in the market showed fair strength, with European equities posting a relief rally at the outcome of the ECB窶冱 recent meeting to change its monetary policy in a more gradual pace. North American mandates also bounced back in positive territory, up 0.27% during the month followed by Asia ex-Japan mandates which were up 0.14% over the same period. On the other hand, Japanese hedge fund managers languished into negative territory during the month, down 0.11% despite a pickup in USD sentiment led to weaker yen which lend some support to underlying equity markets with the Nikkei 225 Index up 4.72%. Political uncertainty plaguing the Latin American region particularly in Brazil, leading to considerable losses during the month 窶・breaking its three consecutive month of gains since the start of the year. The Eurekahedge Latin American Hedge Funds Index declined a modest 0.02% in April.
On a year-to-date basis, Latin American managers topped the tables, and were up 5.00%, followed by Asia ex-Japan and European hedge fund managers with gains of 0.71% and 0.52% respectively. On the other hand, Japanese managers posted the steepest decline year-to-date, down of 1.69% followed by North American managers with losses of 0.70% over the same year-to-date period.
2018 year-to-date returns across regions
Mizuho-Eurekahedge Asset Weighted Index
The asset weighted Mizuho-Eurekahedge Index declined 0.47% in April. It should also be noted that the Mizuho-Eurekahedge Index is US dollar denominated, and during months of strong US dollar gains, the index results include the currency conversion loss for funds that are denominated in other currencies. The US Dollar Index gained 2.08% in April while down 0.31% for the first four months of the year.
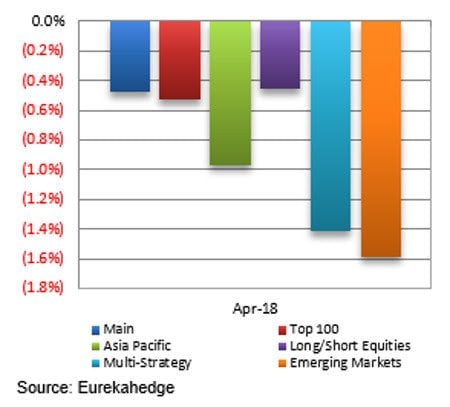
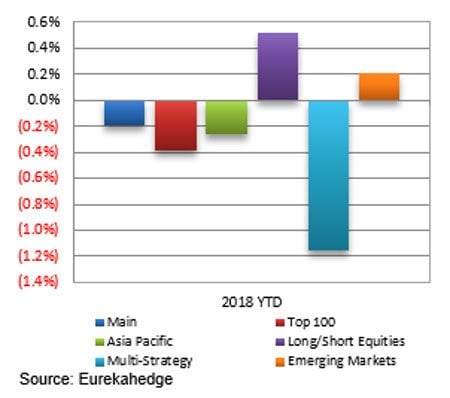
Performance was lacklustre across the board among the suite of Mizuho-Eurekahedge Indices with the Mizuho-Eurekahedge Emerging Market Index posting the steepest decline, with losses of 1.59% followed by the Mizuho-Eurekahedge Multi-Strategy Equities Index with losses of 1.42% over the same period. As of 2018 year-to-date, the Mizuho-Eurekahedge Long Short Equities Index led the tables with gains of 0.52% followed by the Mizuho-Eurekahedge Emerging Market Index which was up 0.21%. On the other hand, the Mizuho-Eurekahedge Multi-Strategy Index performed the worst with losses of 1.15% followed by Mizuho-Eurekahedge Top 100 Index, down 0.38% over the same year-to-date period.
|
Mizuho-Eurekahedge Indices April 2018 returns
|
Mizuho-Eurekahedge Indices 2018 year-to-date returns
|
CBOE Eurekahedge Volatility Indexes
The CBOE Eurekahedge Volatility Indexes comprise four equally-weighted volatility indices 窶・long volatility, short volatility, relative value and tail risk. The CBOE Eurekahedge Long Volatility Index is designed to track the performance of underlying hedge fund managers who take a net long view on implied volatility with a goal of positive absolute return. In contrast, the CBOE Eurekahedge Short Volatility Index tracks the performance of underlying hedge fund managers who take a net short view on implied volatility with a goal of positive absolute return. This strategy often involves the selling of options to take advantage of the discrepancies in current implied volatility versus expectations of subsequent implied or realised volatility. The CBOE Eurekahedge Relative Value Volatility Index on the other hand measures the performance of underlying hedge fund managers that trade relative value or opportunistic volatility strategies. Managers utilising this strategy can pursue long, short or neutral views on volatility with a goal of positive absolute return. Meanwhile, the CBOE Eurekahedge Tail Risk Index tracks the performance of underlying hedge fund managers that specifically seek to achieve capital appreciation during periods of extreme market stress.
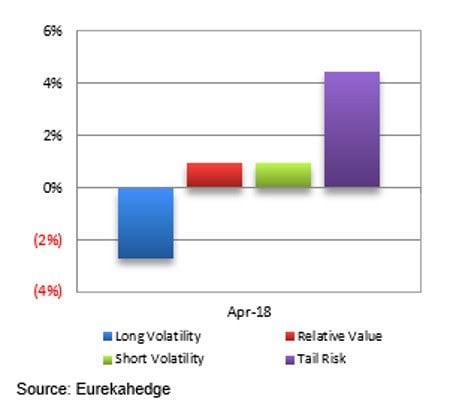
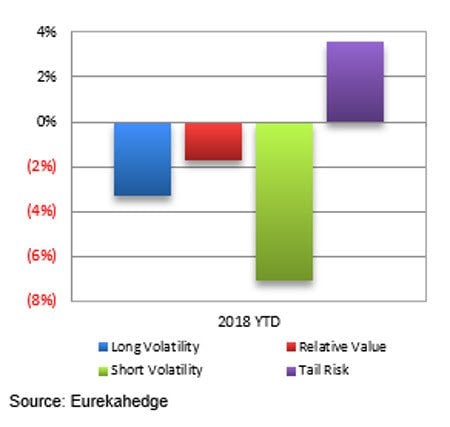
During the month of April, the CBOE Eurekahedge Relative Value Volatility Hedge Fund Index and the CBOE Eurekahedge Short Volatility Hedge Fund Index posted gains of 0.97% each as volatility levels, represented by the CBOE VIX fell during the month after its unstoppable uptrend since the start of the year. The VIX fell 20.23% in April. While the returns for the CBOE Eurekahedge Tail Risk Index are still being populated, early figures show that the strategy posted the best returns among the suite of volatility indices during the month and is also up 4.41% in April. This is quite surprising and rather uncharacteristic of the tail risk index, but can be explained away on account of steep profits posted by one of the constituents for this 窶脇qual weighted index窶・ As more of the constituents report in, this number is likely to be revised lower. It should be observed though that tail risk and long volatility strategies are designed to deliver outsized returns during periods of extreme market volatility thereby providing overall portfolio level protection, hence losses can be expected during normal market conditions. The CBOE Eurekahedge Long Volatility Index was down 2.71% during the month. On a year-to-date basis, the CBOE Eurekahedge Tail Risk Volatility Index was up 3.56% - the only strategy to post positive returns year-to-date among volatility-focused hedge funds. Meanwhile, the CBOE Eurekahedge Short Volatility Index posted the steepest loss year-to-date, down 7.05% followed bythe CBOE Eurekahedge Long Volatility Index and the CBOE Eurekahedge Relative Value Volatility Index which posted losses of 3.32% and 1.75% on a year-to-date basis respectively.
|
CBOE Eurekahedge Volatility Indexes April 2018 returns
|
CBOE Eurekahedge Volatility Indexes 2018 year-to-date returns
|
Summary monthly asset flow data since January 2013
Eurekahedge
Launched in 2001, Eurekahedge has a proven track record spanning over 16 years as the world's largest independent data provider and alternative research firm specialising in global hedge fund databases and research. Headquartered in Singapore with offices in New York and Philippines, the global expertise of our research team constantly adapts to industry changes and needs, allowing Eurekahedge to develop and offer a wide array of products and services coveted by institutional investors, family offices, accredited investors, qualified purchasers, financial institutions and media sources. In addition to market-leading hedge fund databases, Eurekahedge's other business functions include hedge fund research publications, due diligence services, investor services, analytical platforms and risk management tools.


