
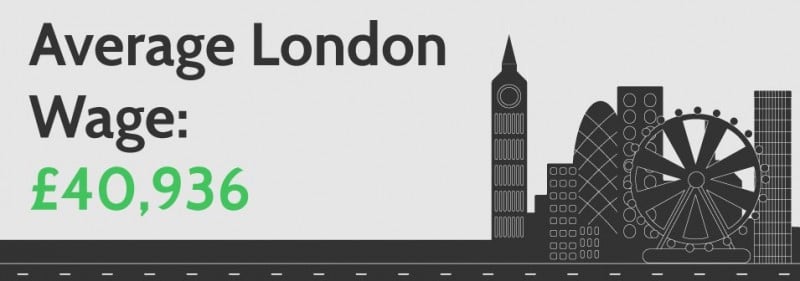
It will come as no surprise to learn that people in London’s workforce, on average, earn the highest wages in the UK.

This is partly due to a greater amount of opportunities with established, high paying companies. However, it must be kept in mind that those living in the capital have a higher cost of living across the board.
But when the average wages earned by Londoners are placed side by side in comparison with those of other UK cities, there’s a clear disparity which raises concerns about income equality.
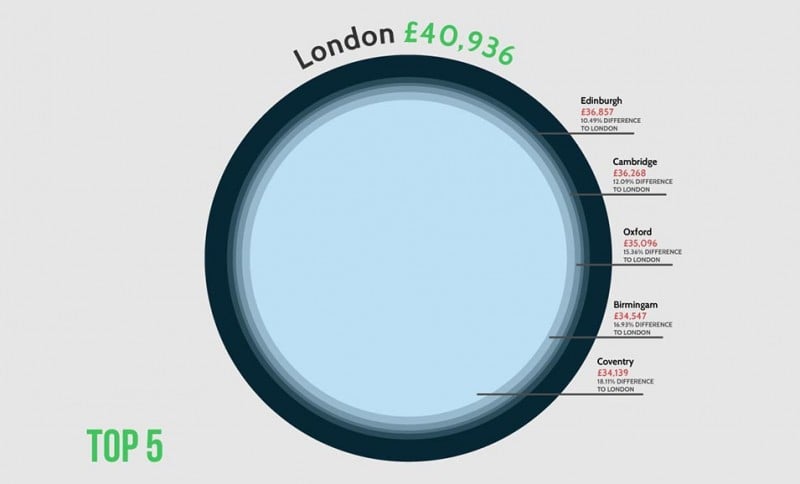
The commercial financial specialists at ABC Finance Ltd investigated this issue and produced some eye-opening research.
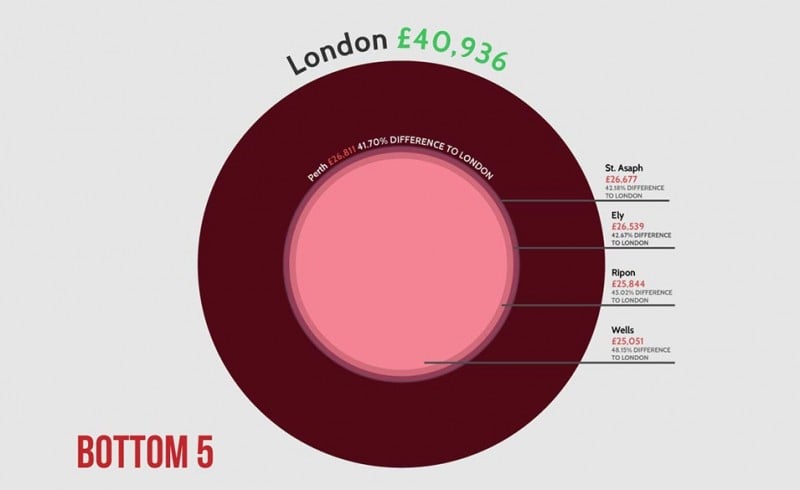
Depending on your location, you could be working for nothing for almost half the year in direct comparison with average London earnings.
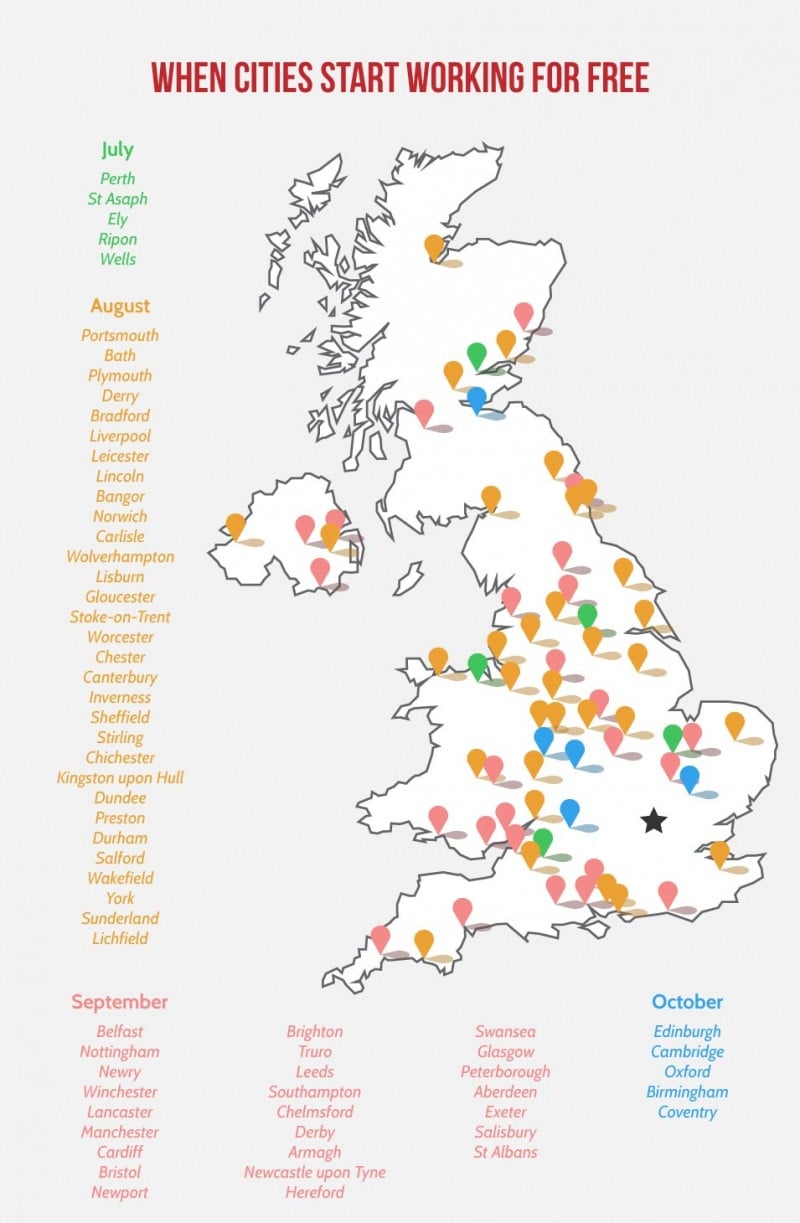
For context, if you earn the average UK wage of £33,900 – you’re working for free from September compared to earners in the capital.
When looking at wages before cost of living, the results are certainly shocking. However, the picture changes somewhat when day-to-day expenditures are deducted from average earnings.
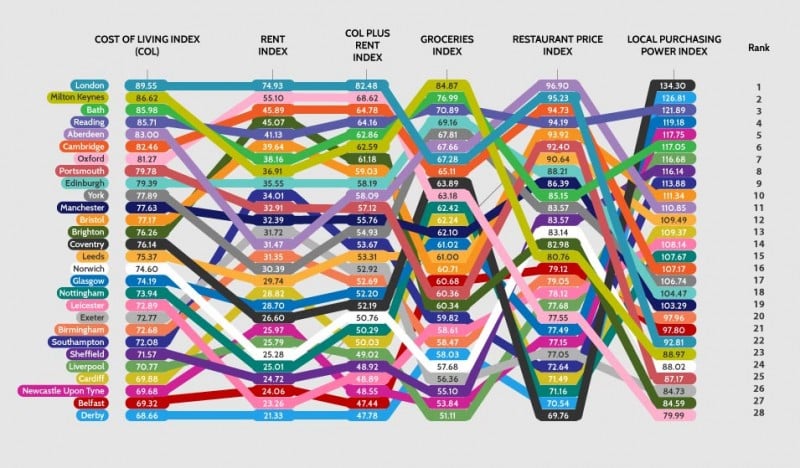
London has the highest average household spend in the UK at £30,898 (that’s almost equivalent to an entire average annual UK wage). When compared to the region with the lowest cost of living, the North East, with £20,976 in outgoings – you can see how the gap between actual wages earned and disposable income tightens for those in the capital.
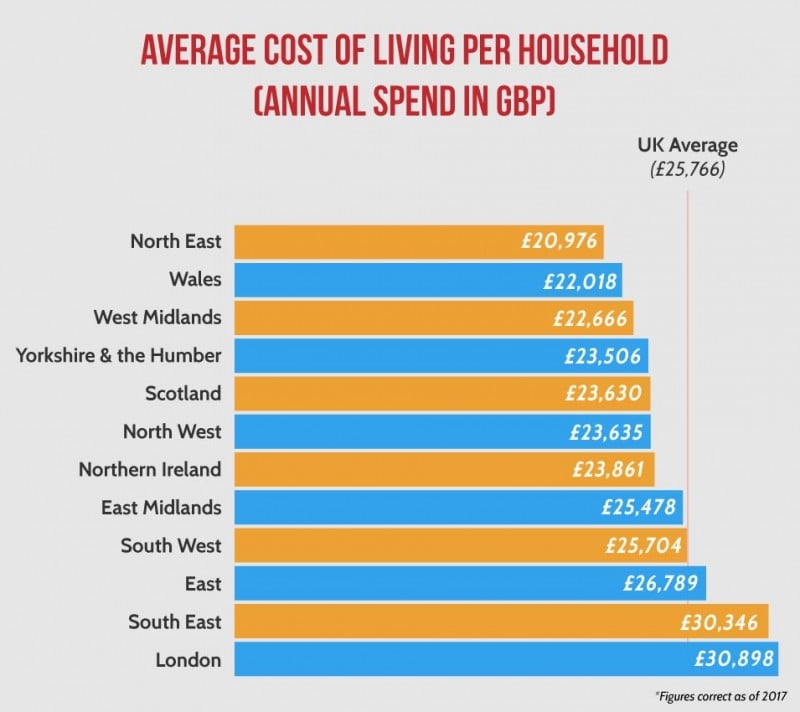
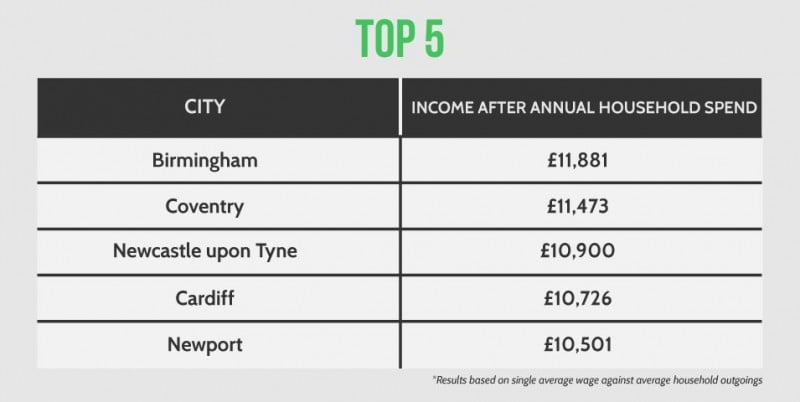
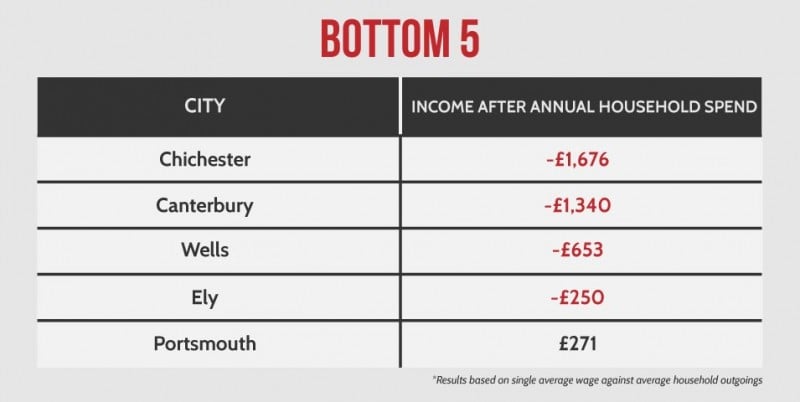
The examples below show those cities whose workers are left with the highest and lowest amount of money after the average annual household spend per region has been taken off their wages:
Highest
- Birmingham: £11,881
- Coventry: £11,473
- Newcastle upon Tyne: £10,900
- Cardiff: £10,726
- Newport: £10,501
Lowest
- Chichester: -£1,676
- Canterbury: -£1,340
- Wells: -£653
- Ely: -£250
- Portsmouth: £271
Once the annual household spend per region is applied to the average wages for a city, London doesn’t quite make the top five – reaching number seven with £10,038 left after outgoings.
However, it performs substantially better than the cities in the lowest five, most of whose average wages can’t even cover the annual household spend of their region.
Essentially, wherever you work there will be pay disparity – not everyone earns the average wage for their city and some make a whole lot more.
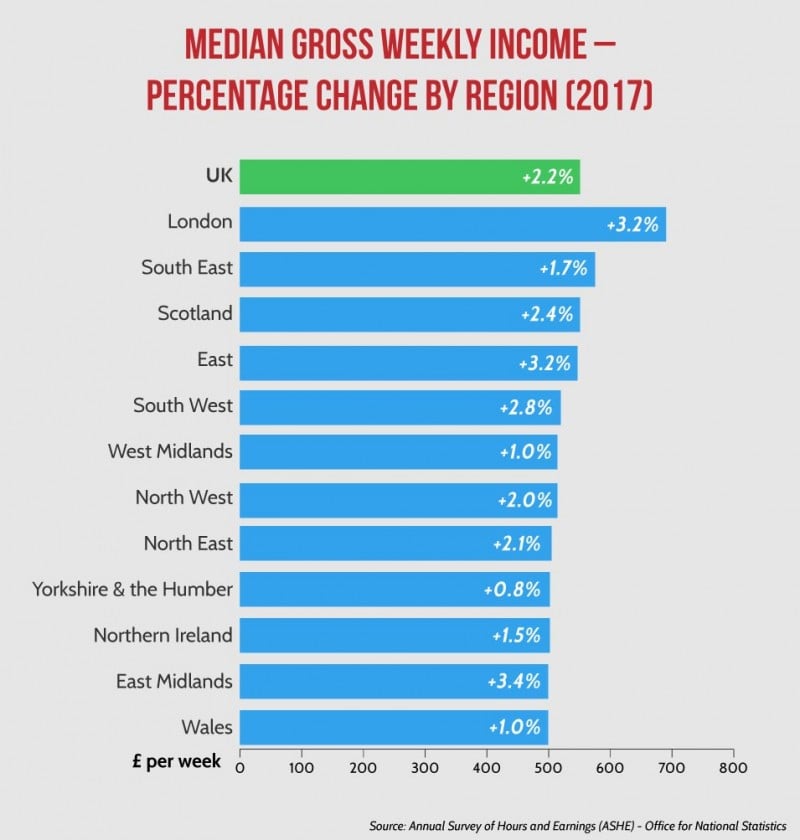
It’s not all doom and gloom though, there is something positive happening in terms of employee remuneration, wages across the board are rising year on year. The East Midlands, London and the East of England saw the largest growth in employee pay in 2017.
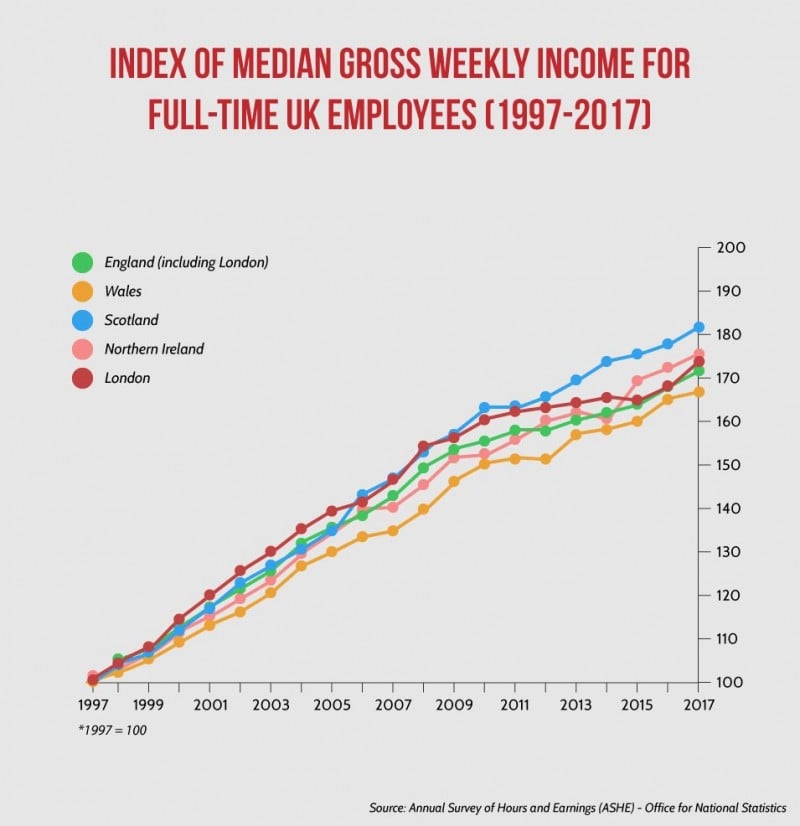
This upswing has been charted by the Office for National Statistics since 1997 and since the start of their research both Scotland and Northern Ireland have benefitted from a greater increase in wages than London, with Wales trailing behind.
To put it simply, every country in the UK has seen their wages rise over 60% since the ONS began monitoring earnings. So, although it may not feel like it, we’re supposedly better off than we were a decade ago.
Find out more about when your city starts working for free: https://abcfinance.co.uk/


