Summary
- The 16 selected large oil palm growers and traders attracted more loans per year in the period from 2006-2015 and issued more bonds.
- SE Asia banks are the most important lenders to these palm oil companies.
- Loans are becoming more important than bonds over time.
- Stronger bank ESG policies the more their loan portfolio focuses on companies that appear to have improved their sustainability performance, 2010-2015.
Published by Chain Reaction Research, and written by Fenneke Brascamp, Aidenvironment; Alexandra Christopoulou, Profundo; and Gabriel Thoumi, CFA, FRM, Climate Advisers.
By financing the massive expansion of the palm oil sector, banks are contributing to deforestation, peat development and social conflicts. Analysis of bank financing – both loans and equity and debt underwriting – of 16 major palm oil companies from 2006-2015 shows that banks are more important financiers than equity and debt investors. This means that investors in these banks also are exposed indirectly to sustainability risks. The adoption of no deforestation policies by banks has an impact, but too many banks have not yet adopted such policies.
Key Findings
- More loans, more bonds and less shares. The 16 selected large oil palm growers and traders attracted more loans per year in the period from 2006-2015 and issued more bonds. Only share issuances showed a negative trend.
- Loans are becoming more important than bonds over time. Both new loans and new bond issuances are growing faster than the total assets of the companies, but the growth of loans is stronger. This means that banks have strengthened their position as the main external financiers of the sector. Investors in important banks are thus exposed indirectly to sustainability risks in the palm oil sector.
- SE Asia banks are the most important lenders to these palm oil companies, closely followed by East Asian and European banks. Banks from North America, Australia and other regions play a smaller role. Banks from different regions seem to respond similarly to upward and downward changes in the market.
- Malaysian and U.S. banks dominate underwriting.
Indonesian banks do not play as relevant a role in underwriting compared with Malaysian banks. - Companies which improved their sustainability performance 2010-2015 may have attracted more loans and issued more bonds. Companies that did not improve their sustainability performance also attracted more loans, but did not issue bonds. These companies, which are lagging behind in terms of environmental and social commitments, avoid the bond markets and rely strongly on bank financing.
- Of the 17 most important banks, only three have adopted strong ESG policies on the palm oil sector. Another seven have a policy, which needs further improvement, while seven banks have a weak policy or no policy at all.
- The stronger the ESG policies of banks, the more their loan portfolio focuses on companies, which appear to have improved their sustainability performance, 2010-2015. Banks thus seem to bring their policies into practice.
- It appears companies that have not improved their sustainability performance, increasingly rely on loans from banks that have weak ESG policies. These banks mainly come from Indonesia, Malaysia, Singapore and the United States.
Palm oil growers and refiners surveyed include:
- Asian Agri, Indonesia
- Astra Agro Lestari, Indonesia
- Bumitama Agri, Singapore
- Felda Global Ventures, Malaysia
- First Resources, Singapore
- Genting Plantations, Malaysia
- Golden Agri-Resources, Singapore
- Indofood Agri Resources, Singapore
- IOI Corporation, Malaysia
- Kencana Agri, Singapore
- Kuala Lumpur Kepong, Malaysia
- Salim Ivomas Pratama, Indonesia
- Sawit Sumbermas Sarana, Indonesia
- Sime Darby, Malaysia
- Sinar Mas Agro Resources & Technology, Indonesia
- Wilmar International, Singapore
Banks Finance Palm Oil Sector Expansion 2006-2015
Banks play an important role in financing the expansion of the oil palm sector. Significant funds are needed to develop land, to plant seedlings and to build infrastructure, while oil palm trees only start to bear fruit after three-to-five years and only reach peak production after seven years. Upfront financing is therefore required.
Because of their crucial role in enabling the expansion of the palm oil sector – which has resulted in deforestation, peat development and social conflicts – media and NGOs have focused their attention on banks. In response to this pressure, some banks have adopted sound ESG policies for the palm oil sector. Also, the growth of the palm oil sector has seen its ups and downs, which deterred some banks from financing the sector further.
The objective of this research is to analyze how these different developments have impacted the role of banks in financing this sector. Based on three criteria, 16 palm oil companies were selected. The criteria are: total assets, market capitalization and land bank size. For these 16 companies, all new loans and stock issuances during the past ten years (2006-2015) were analyzed. The figures in this study refer to new loans and underwriting services attracted each year.
Loans to Palm Oil Companies Increased 78 Percent Annually, 2006-2015
Overall, the selected oil palm companies attracted more loans, issued more bonds and issued less shares in the period from 2006-2015. From 2006-2015, the annual volume of loans provided to the selected companies increased from USD 226 million to USD 2,321 million, with an average growth of 78 percent per year. As most loans are multi-annual, years in which the new loan volumes peak are followed by years with lower volumes in which the companies need less loans.
Figure 1, 2 and 3 below show how the development of the volume of new loans relates to the growth of the companies themselves, measured in total assets. Both indicators show an increasing trend, but loan volume growth outpaces total assets. As a result, the volume of new loans as a percentage of total assets doubled from 3 percent to greater than 7 percent.

Figure 1: New Loans 2006-2015
Figure 2: Total Assets 2006-2015
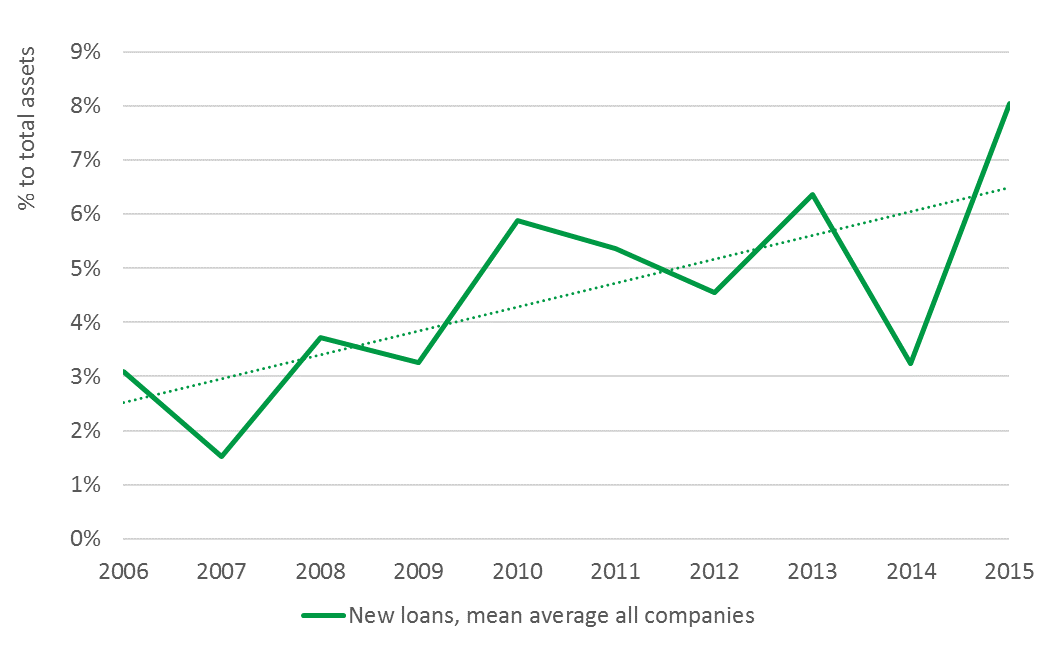
Figure 3: New Loans per Year, 2006-2015
Figure 4 below looks at the trend for the individual companies, which are getting more dependent on loans, as they saw an increase in the percentage of new loans relative to their total assets.
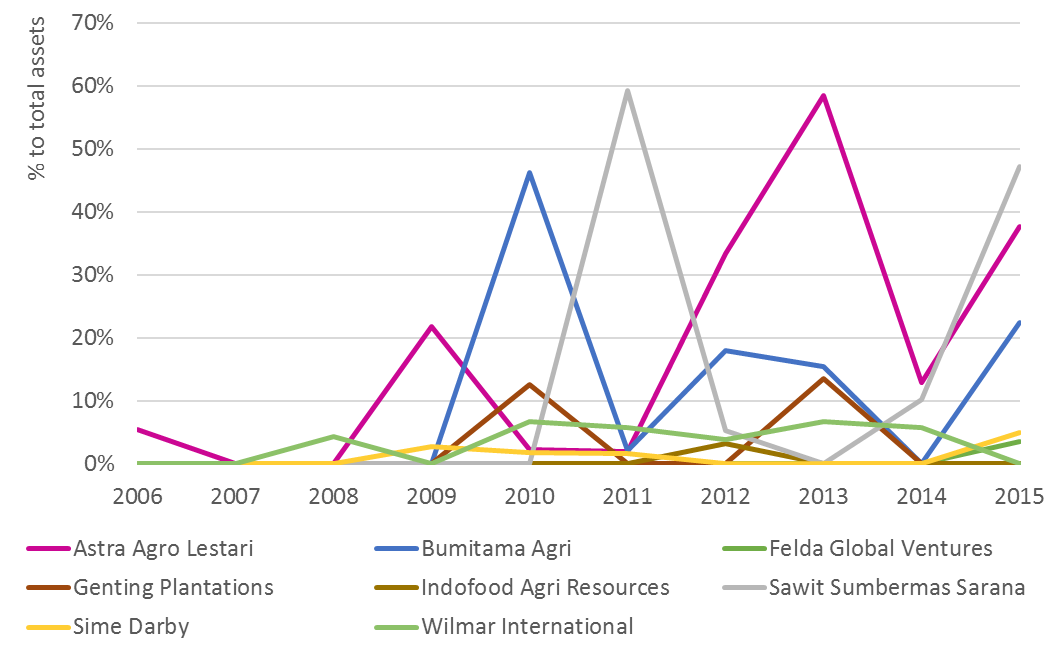
Figure 4: Companies with a Growing Percentage of Loans to Total Assets, 2006-2015
Figure 5 below looks at the companies that attracted less bank loans over the years. Partially this can be explained by the fact that some of these companies attracted more bonds (see Figure 5).
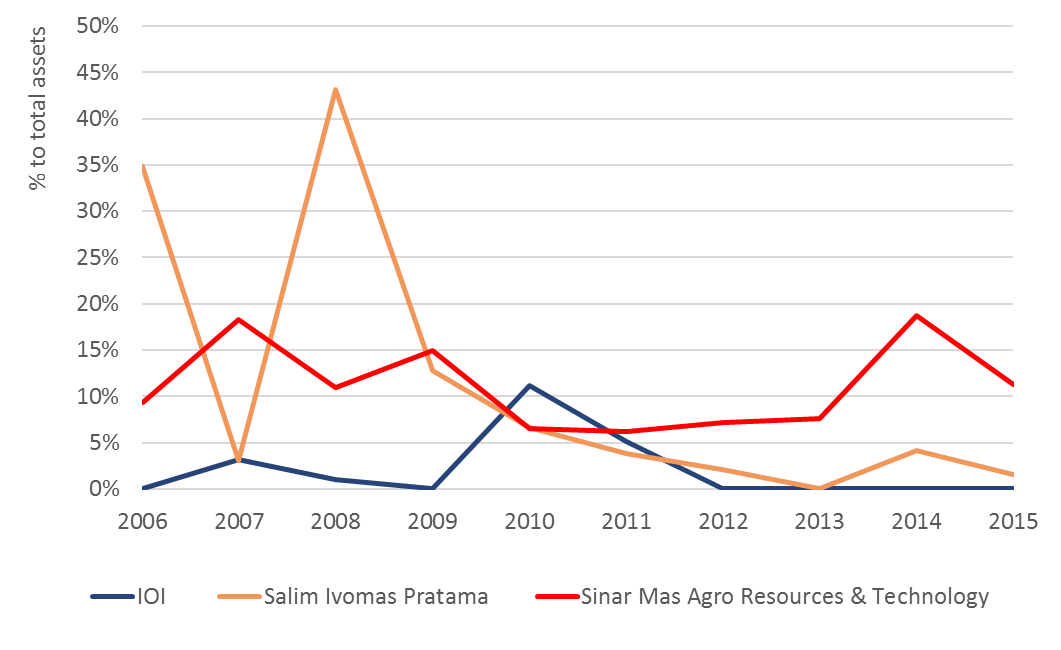
Figure 5: Companies with Declining Percentage of Loans to Total Assets, 2006-2015
Bond Issuance Up, Equity Issuance Down, 2006-2015
Apart from attracting bank loans, companies can also extract financing by issuing new bonds and shares. Share issuances were peaking in 2012, because Felda Global Ventures Holdings went public. This was the second-largest IPO worldwide in that year.
Despite this incidental peak, the volume of share issuances shows a decreasing trend over the past ten years, while the volume of bond issuances is increasing.
Figures 6 and 7 below shows how the development of the volume of new bond issuances relates to the growth of the companies themselves, measured in total assets. Both indicators show an increasing trend, but the bond volume grows stronger. As a result, the volume of new bond issuances as percentage of total assets increased from around 1.4 percent to about 2.1 percent. Bond financing is thus getting more important, but does not follow the same strong growth as new loans (Figure 3).
Figure 6: Underwriting Per Year, 2006-2015
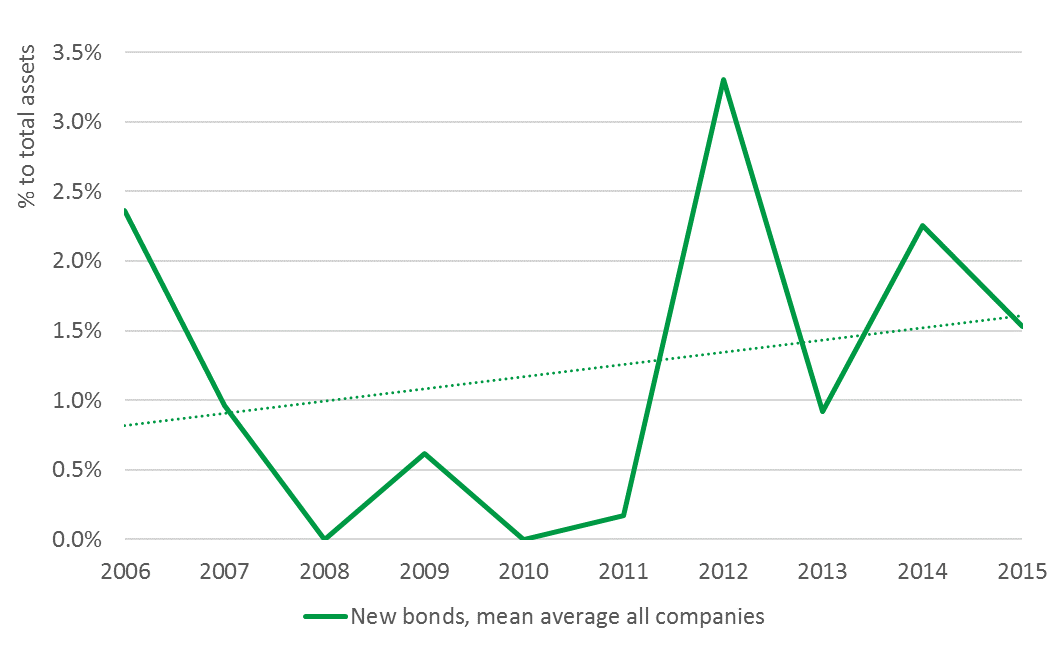
Figure 7: Bond Issuance as Percentage of Total Assets, 2006-2015
Figure 8 looks at the trend for the individual companies which are getting more dependent on bonds, as they saw an increase in the percentage of new bond issuances relative to their total assets.
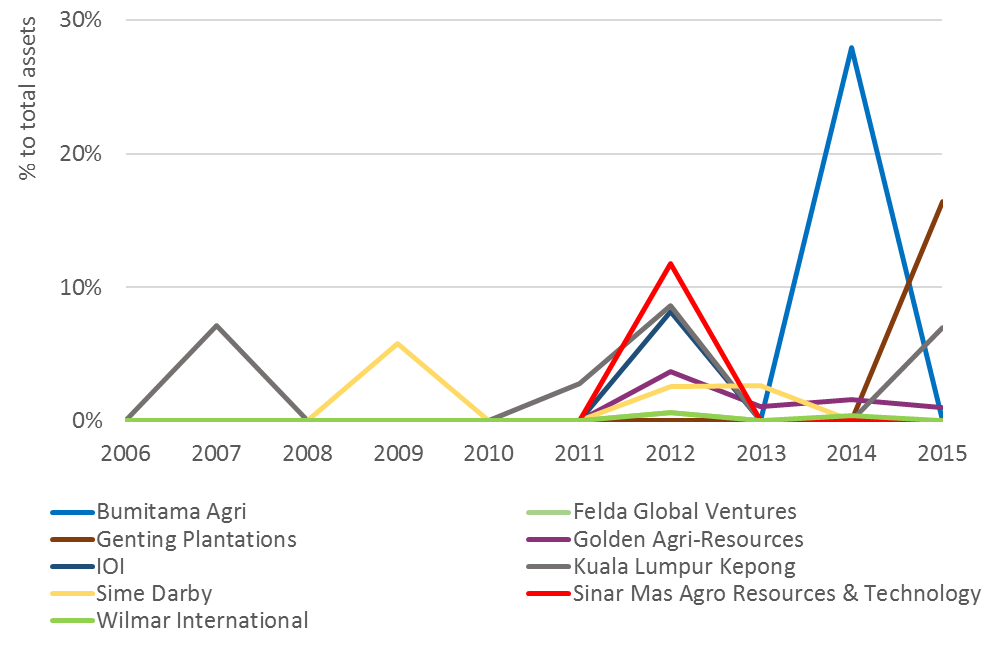
Figure 8: Companies with a Growing Percentage of Bond Issuance to Total Assets, 2006-2015
Sinar Mas Agro Resources & Technology is an example of a company replacing loans by bonds, as the company dropped from a 18 percent to a 7 percent ratio of loans to total assets from 2007-2012 (see Figure 5), while at the same time in 2012 bond issuances accounted for 12 percent of the company’s assets.
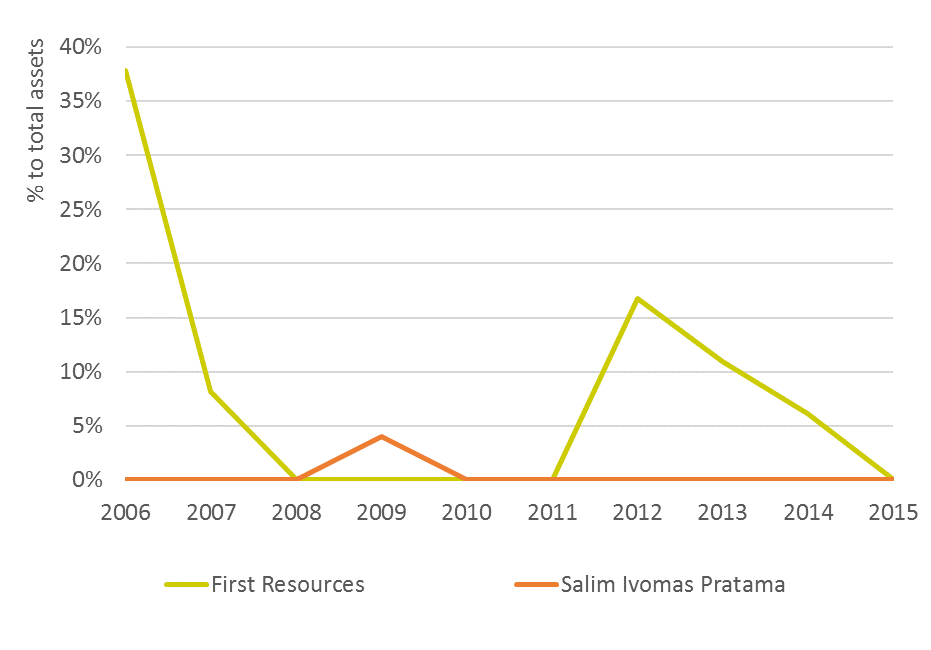
Figure 9: Companies with a Declining Percentage of Bond Issuance to Total Assets, 2006-2015
Figure 9 above shows SE Asian trend lines of loans and bonds to total assets. Loans show a steeper growth. This means that loans are becoming more important over time than bonds in financing palm oil companies. Figure 10 below demonstrates new loans to new debt issuance 2006-2015.
Figure 10: Loans and Debt Issuance, 2006-2015
SE Asian Banks Lead Palm Oil Sector Financiers, 2006-2015
Banks providing loans and underwriting services were grouped based on their region of origin. The six regions used are:
SE Asia
- Indonesia
- Malaysia
- Philippines
- Singapore
East Asia
- China
- Japan
- Taiwan
EU28
- Belgium
- Denmark
- France
- Germany
- Netherlands
- Spain
- United Kingdom
North America
- United States
Oceania
- Australia
Other
- India
- Kuwait
- Libya
- Switzerland
- Thailand
- United Arab Emirates
As shown below in Figures 11 and 12, domestic banks from SE Asia were most important in financing palm oil companies in the period 2006-2015, closely followed by East Asian and European banks. Banks from North America, Australia and other regions play a smaller role. Banks from different regions seem to respond similarly to upward and downward changes in the market.
Figure 11: Loan Values per Bank Region, 2006-2015
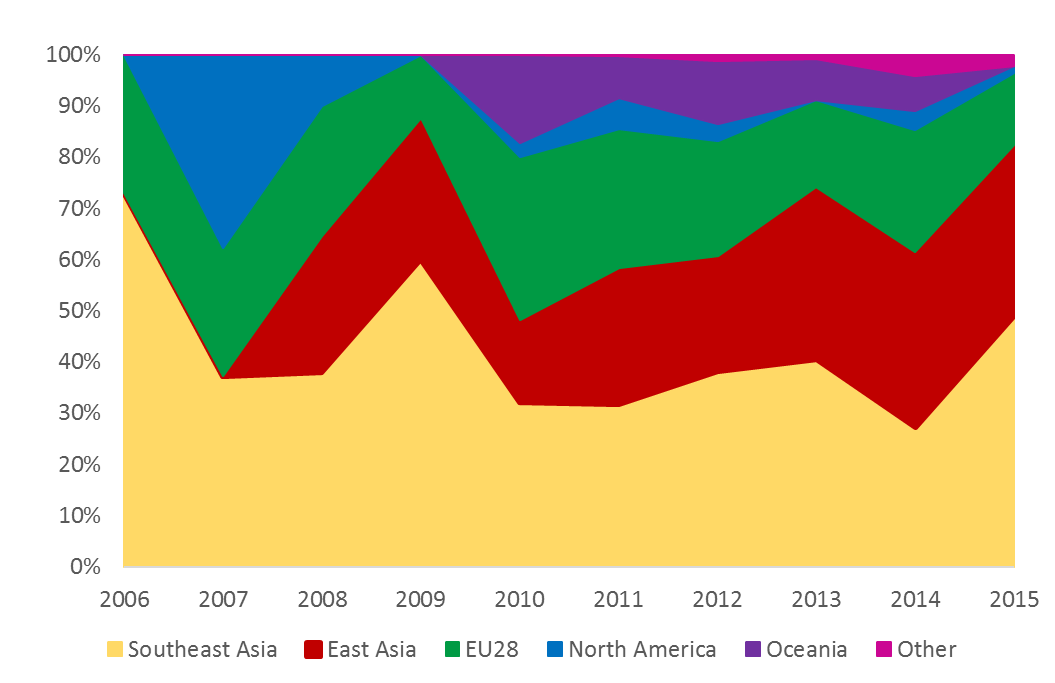
Figure 12: Loans per Bank Region, 2006-2015
15 Palm Oil Banks Issued 72 Percent Total Loans, 2006-2015
As shown below in Figure 13, loans provided by the top-15 banks account for 72 percent of the total loans provided to the 16 selected oil palm companies. In the period from 2006-2015, 11 percent of all loans to the 16 companies were provided by Oversea-Chinese Banking Corporation (Singapore). Other important banks were Mitsubishi (Japan), Sumitomo (Japan), HSBC (United Kingdom), DBS (Singapore) and Mizuho (Japan). As these banks are listed on a stock exchange, investors in these banks are exposed indirectly to the sustainability risks of the palm oil sector.


Figure 13: Top-15 Banks Providing Loans, 2006-2015
15 Palm Oil Banks Underwrote 88 Percent Debt and Equity Issuance, 2006-2015
As shown below in Figure 14, underwriting services provided by the top-15 banks account for 88 percent of the total provided to the 16 selected oil palm companies 2006-2015. Underwriting of bond and share issuances is dominated by Malaysian investment banks (CIMB, Malayan Banking and RHB) and American investment banks (Citi, JPMorgan Chase, Morgan Stanley and the American subsidiaries of Credit Suisse and Deutsche). As these banks are listed on a stock exchange, investors in these banks are exposed indirectly to the sustainability risks of the palm oil sector. In contrast to their Malaysian counterparts, Indonesian banks do not play a relevant role in underwriting. This reflects a stronger development of the domestic capital market in Malaysia.
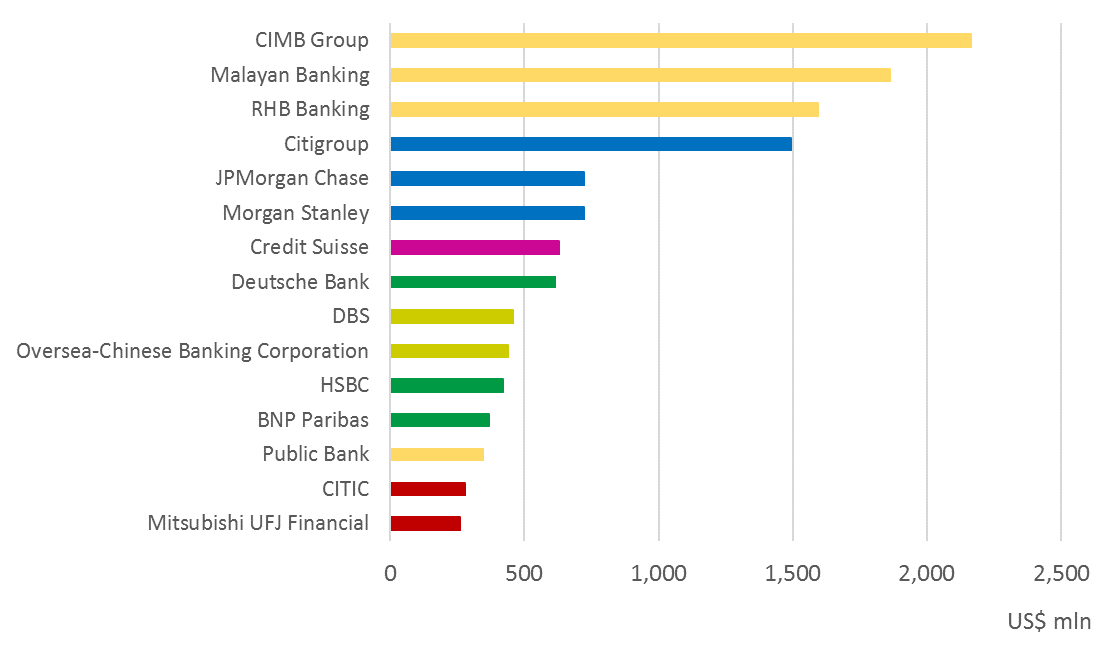
Figure 14: Top-15 Banks Providing Underwriting, 2006-2015
16 Palm Oil Companies Sustainability Performance, 2010-2015
Assessing the sustainability performance of the 16 companies over the period 2010-2015, companies can be grouped in two distinct categories (Figure 15): companies improving their sustainability performance and companies not improving (the ‘stable’ companies).
| Companies improving their sustainability performance 2010-2015 |
| Astra Agro Lestari |
| Bumitama Agri |
| Felda Global Ventures |
| First Resources |
| Genting Plantations |
| Golden Agri-Resources |
| IOI |
| Kencana Agri |
| Kuala Lumpur Kepong |
| Sime Darby |
| Sinar Mas Agro Resources & Technology |
| Wilmar International |
| Companies which did not improve their sustainability performance 2010-2015 |
| Asian Agri |
| Indofood Agri Resources |
| Salim Ivomas Pratama |
| Sawit Sumbermas Sarana |
Figure 15: Companies Ranked by Sustainability Performance
As shown in Figures 16 and 17 from 2010-2015, companies that improved their sustainability performance have attracted more loans and issued more bonds. Stable companies also have attracted more loans, but they do not appear to have issued any bonds during this period. Both ‘improving’ and ‘stable’ companies issued less shares in time as shown below in Figure 18.

Figure 16: Sustainability Progress and Loans, Percentage to Total Assets, 2010-2015
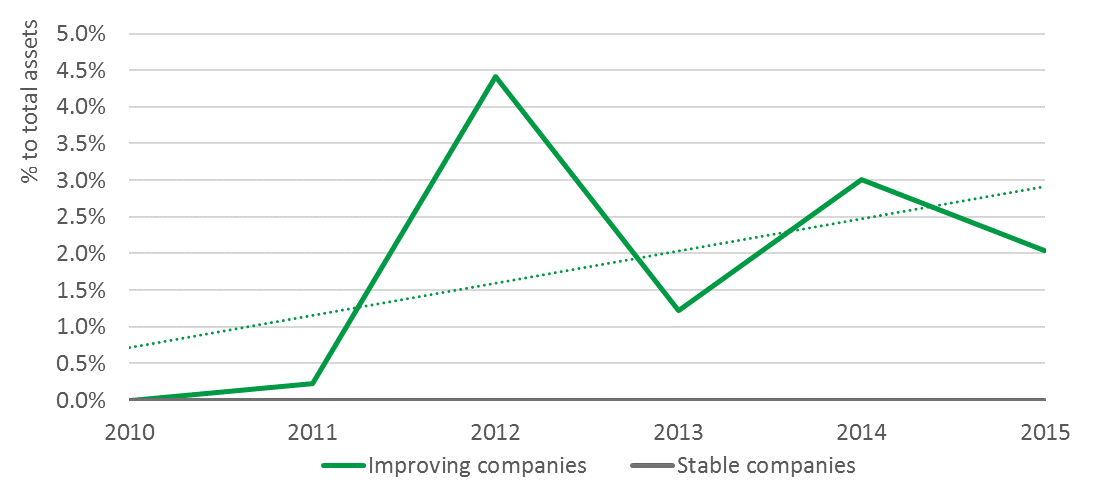
Figure 17: Sustainability Progress and Debt Issuance, Percentage to Total Assets, 2010-2015
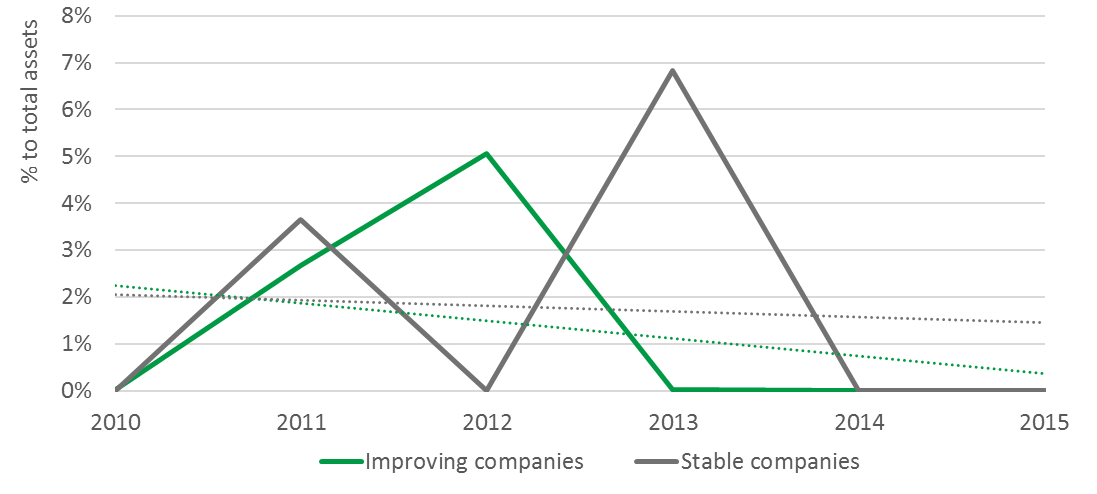
Figure 18: Sustainability Progress and Share Issuance, Percentage to Total Assets, 2010-2015
17 Banks Palm Oil Policies Scored
For the main banks providing loans and underwriting issuances, we analyzed if the quality of their ESG policies on the oil palm sector had a significant influence on their financing activities in the period 2010-2015. We used the policy scores assigned to the banks on the Forests and Finance website and grouped the banks in three groups, based on their scores. This is shown below in Figure 19.
| Bank | (Zero to 30) |
| Bank Mandiri | 0 |
| BNP Paribas | *21 |
| CIMB Group | 0 |
| Citigroup | 18 |
| Credit Suisse | 20 |
| DBS | 1 |
| Deutsche Bank | 15 |
| HSBC | 16 |
| JPMorgan Chase | 14 |
| Malayan Banking | 0 |
| Mitsubishi UFJ Financial | 10 |
| Mizuho Financial | 10 |
| Morgan Stanley | 7 |
| OCBC | 1 |
| Rabobank | 23 |
| RHB Banking | 0 |
| Sumitomo Mitsui Financial | 10 |
Figure 19: Scoring Banks by Their ESG Policies
Source: forestsandfinance.org
*The bank profile of BNP Paribas was not provided by the Forests and Finance website. It was assessed following the same methodology.
Policy scores are summed and ranked from zero – the lowest – to 30 – the highest. Rabobank scored highest at 23, followed by BNP Paribas at 21. Meanwhile, Bank Mandiri, CIMB Group, Malayan Banking and RHB Banking scored lowest at zero.
The Forests and Finance criteria for bank policy evaluation are:
Scope of commitments
- Is the bank a signatory to the main international covenants relevant to forestry and land issues?
- Does the bank have a publicly available forestry sector specific policy?
- Applied to all forms of investments and financial services provided?
- Applied to all relevant clients including all subsidiaries across a business group’s activities?
- Are clients’ operations required to undergo regular independent assessment in relation to legality, social and environmental issues?
Environmental standards
- Is the degradation or conversion of natural forests prohibited?
- Are operations in High Conversation Value (HCV) forest prohibited?
- Are operations in peat or other High Carbon Stock (HCS) forest prohibited?
- Are operations in protected areas prohibited?
- Is proof of legality in operations and sourcing required?
Social standards
- Is a check of land tenure legality required?
- Is proof of the Free, Prior and Informed Consent (NASDAQ:FPIC) of indigenous communities required where applicable?
- Is forced labor and child labor prohibited?
- Are health & safety protections for the community and workers required?
- Do communities affected by client operations have any grievance mechanism available to them?
Of the 17 most important banks, only 3 have adopted strong ESG policies on this sector. Another 7 have a policy which needs further improvement, while 7 banks have a very weak policy or no policy at all. Figure 13 below shows that possibly the stronger the ESG policies banks have covering their lending activities, the more their loan portfolio seems to focus on companies which improved their sustainability performance, 2010-2015. These banks appear to be executing upon their ESG policies and putting them into practice. Banks with good policies (scored higher than 20), did not provide any loans to the stable companies. Stable companies did not issue bonds in this period and there was only one case where a bank with a good policy underwrote a share issuance of a stable company (BNP Paribas and Sawit Sumbermas Sarana).
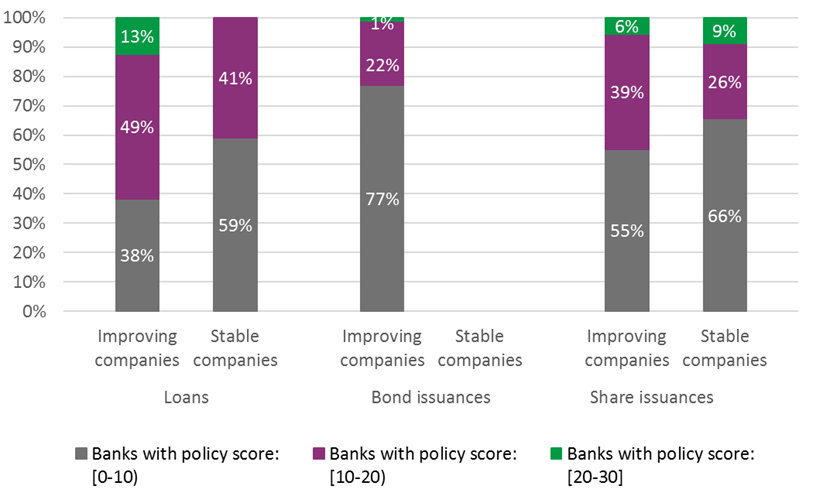
Figure 21: Loans and Underwriting by Bank Policy Score, 2010-2015
As shown above in Figure 21, the ‘stable’ companies, which have not improved their sustainability performance in the period 2010-2015, are not issuing bonds. They are increasingly relying on bank loans, especially from banks which have not adopted strong ESG policies: 59 percent of their bank loans is coming from banks with poor policies and 41 percent from banks with moderate policies. The banks with poor policies mainly come from Indonesia, Malaysia, Singapore and the United States.
Disclaimer: This report and the information therein is derived from selected public sources. Chain Reaction Research is an unincorporated project of Aidenvironment, Climate Advisers and Profundo (individually and together, the “Sponsors”). The Sponsors believe the information in this report comes from reliable sources, but they do not guarantee the accuracy or completeness of this information, which is subject to change without notice, and nothing in this document shall be construed as such a guarantee. The statements reflect the current judgment of the authors of the relevant articles or features, and do not necessarily reflect the opinion of the Sponsors. The Sponsors disclaim any liability, joint or severable, arising from use of this document and its contents. Nothing herein shall constitute or be construed as an offering of financial instruments or as investment advice or recommendations by the Sponsors of an investment or other strategy (e.g., whether or not to “buy”, “sell”, or “hold” an investment). Employees of the Sponsors may hold positions in the companies, projects or investments covered by this report. No aspect of this report is based on the consideration of an investor or potential investor’s individual circumstances. You should determine on your own whether you agree with the content of this document and any information or data provided by the Sponsors.