
Gold started this year with a quick rally, but it was mostly erased. It’s still above its mid-2022 high, but will it stay there for much longer?
Is It All Bearish?
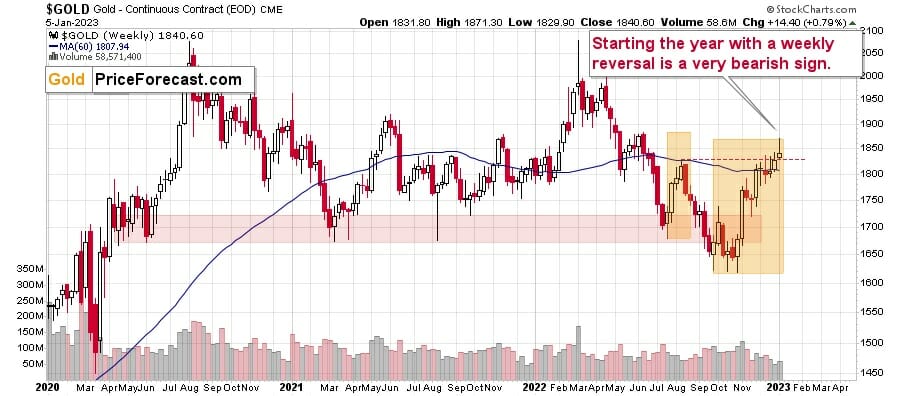
The above chart features gold prices in terms of weekly candlesticks. As you can see, it just approached its August high, and it’s trying to break above those highs once again. The previous attempts failed, so the question is whether this attempt will succeed.
Q4 2022 hedge fund letters, conferences and more
I doubt it. Given the shape of this week’s candlestick, a decline from here is much more likely. After all, that’s what prices tend to do after reversal candlesticks – they change direction, and there’s no doubt that the most recent short-term move was to the upside.
Of course, the week is not over yet, but given the lack of a decent rally in today’s pre-market trading, it’s likely that the weekly reversal will become a fact shortly.
Again, this is a very powerful bearish indication.
Similarities
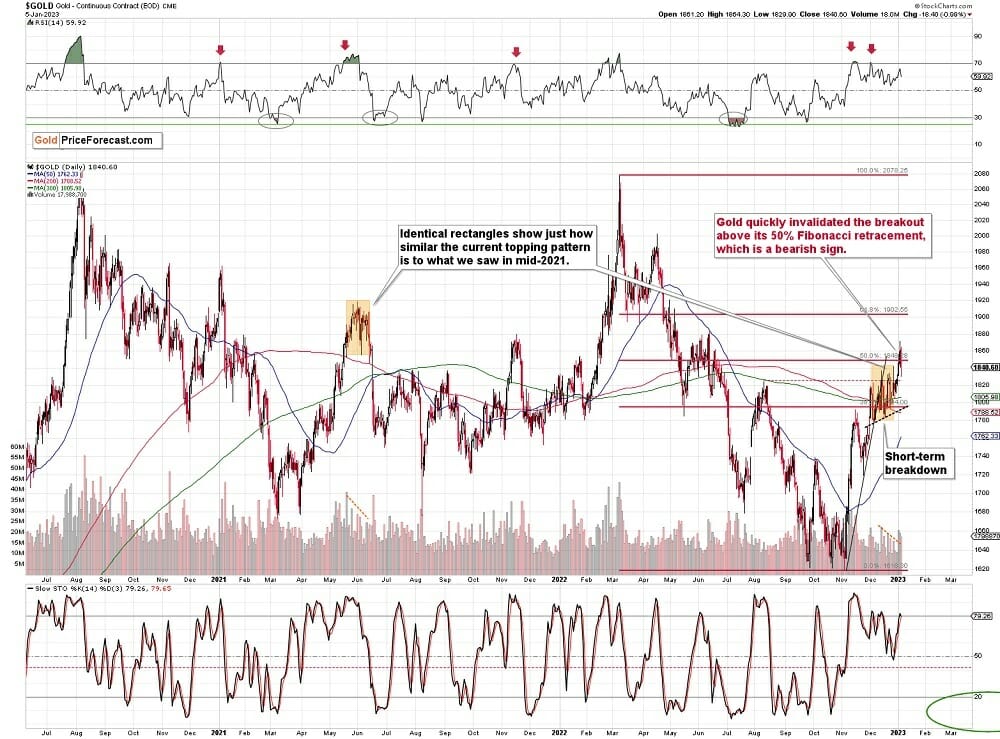
From a short-term point of view, we see that the gold price moved to its 50% Fibonacci retracement level, and then moved back down below it. In other words, gold invalidated its breakout above this important resistance level, just like I’d been expecting it to.
I copied the mid-2021 topping pattern to the current situation. I marked the period from the first intraday high to the start of the decline, and I marked it from the intraday high to the intraday low of the pattern.
Those are not identical, but there is still much similarity present.
Interestingly, both patterns were preceded by similarly sharp rallies, which were preceded by a broad bottom, which in turn were preceded by a decline of about $2,000.
The difference is now that gold has moved to new intraday highs, while back in mid-2021, it hadn’t. Then again, nothing specific happened on the USD/JPY exchange rate back then, as it was only recently when the Bank of Japan moved to the hawkish camp.
The above-mentioned similarity as well as the invalidation of the breakout above the 50% Fibonacci retracement together paint a very bearish picture for gold’s short-term outlook.
Naturally, the above is up-to-date at the moment when it was written. When the outlook changes, I’ll provide an update. If you’d like to read it as well as other exclusive gold and silver price analyses, I encourage you to sign up for our free gold newsletter.
Thank you.
Przemyslaw Radomski, CFA
Founder, Editor-in-chief
Sunshine Profits: Effective Investment through Diligence & Care
All essays, research and information found above represent analyses and opinions of Przemyslaw Radomski, CFA and Sunshine Profits’ associates only. As such, it may prove wrong and be subject to change without notice.
Opinions and analyses are based on data available to authors of respective essays at the time of writing. Although the information provided above is based on careful research and sources that are deemed to be accurate, Przemyslaw Radomski, CFA and his associates do not guarantee the accuracy or thoroughness of the data or information reported.
The opinions published above are neither an offer nor a recommendation to purchase or sell any securities. Mr. Radomski is not a Registered Securities Advisor. By reading Przemyslaw Radomski’s, CFA reports you fully agree that he will not be held responsible or liable for any decisions you make regarding any information provided in these reports. Investing, trading and speculation in any financial markets may involve high risk of loss.
Przemyslaw Radomski, CFA, Sunshine Profits’ employees and affiliates as well as members of their families may have a short or long position in any securities, including those mentioned in any of the reports or essays, and may make additional purchases and/or sales of those securities without notice.


