
Weitz Value Fund commentary for the first quarter ended December 31, 2017.
H/T Dataroma
The Value Fund’s Institutional Class returned +3.04% during the fourth quarter compared to +6.64% and +6.59% for the S&P 500 and Russell 1000 indices, respectively. For the 2017 calendar year, the Fund’s Institutional Class returned +15.80% compared to +21.83% and +21.69% for the S&P 500 and Russell 1000 indices. Since adopting its large-cap company mandate in June 2008, the Fund has generated annual returns of +8.74% compared to +10.42% and +10.43% for the S&P 500 and Russell 1000.
Investors’ appetite for stocks remained high during the fourth quarter, pushing most indices to record levels. The S&P 500 posted positive returns during every month of 2017, a first for the long-running index. The underlying values of our portfolio companies grew a satisfactory +8% in 2017 while their collective stock prices rose at approximately twice that rate. The Fund’s primary benchmarks climbed faster still, leaving implied valuations at 15-year highs as we enter 2018.
We aim to purchase stocks at a discount to what they are worth, creating wealth primarily via: 1) the increase in a business’s intrinsic value over time, and 2) a narrowing of the gap between price and this growing value. As outlined above, stock prices have generally risen faster than our portfolio and “on-deck” companies’ valuations for several years now, leaving the latter “value lever” with less to contribute moving forward. Absent broader mispricing, we have been tilting the Fund toward businesses where we have the most confidence in future value progression. Top positions Berkshire Hathaway, Charter Communications (via Liberty Broadband), Alphabet, LabCorp, Mastercard (Visa, too), Oracle and Praxair serve as examples, with this group’s portfolio weighting 25% larger than a year ago. Three of the Fund’s four new stock purchases this year fit this profile as well, including fourth-quarter purchase Priceline Group which we describe in more detail below.
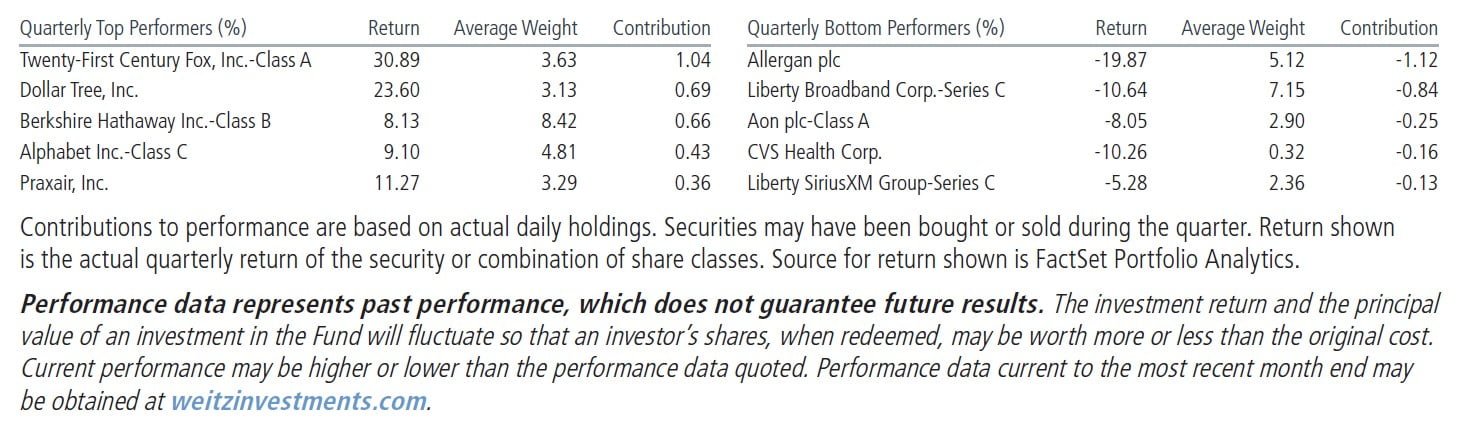
Several months back in our third-quarter summary, we expressed our belief that Twenty-First Century Fox’s durable, if unexciting, growth would eventually become difficult for the market to ignore. We have long held that Fox had a strong hand to play amid tectonic shifts in the broader media landscape, particularly given the increasing importance of global scale. We would not have guessed, however, that: 1) Disney and Fox were in or about to begin exploratory merger talks, or 2) the Murdoch family would be willing sellers. Of the realistic homes for Fox’s assets, Disney would be our first choice among known suitors. The agreed-upon deal price is a nice validation of our valuation work, and made Fox the Fund’s largest contributor during the fourth quarter. Potentially significant regulatory hurdles remain, but we are positive on the prospects for the “new Disney,” assuming the deal is approved. Dollar Tree shares enjoyed another strong quarter. Healthy and improving underlying growth and benefits from recently enacted U.S. corporate tax reform helped lift the stock to levels approaching our estimate of intrinsic value. We sold some Dollar Tree shares near $100 during the quarter as a result.
Berkshire Hathaway, the Fund’s largest holding, was a notable contributor to fourth-quarter and full-year performance. Large acquisitions proved elusive over the course of 2017, but Berkshire’s existing collection of insurance, railroad, utility and manufacturing businesses drove a healthy double-digit increase in intrinsic value per share (aided in part by a reduction in the company’s deferred tax liability). Deployable cash now stands in excess of $90 billion, positioning Mr. Buffett well as opportunities arise in the days ahead. Card networks Mastercard and Visa each returned nearly 50% during 2017. Combined, they were the largest contributors to the Fund’s full-year performance. Among the most competitively advantaged businesses we own, both platforms benefit from attractive secular growth opportunities and provide a natural hedge against potential inflation. At narrower discounts, we continued trimming our Mastercard position during the fourth quarter, with the expectation of more modest returns from current price levels in the years ahead. Finally, Google parent Alphabet, Inc. continues to successfully leverage its position as the world’s largest advertising platform, generating outstanding organic growth despite a revenue base that now exceeds $100 billion annually.
On the other side of the ledger, Allergan plc was the largest detractor from Fund performance during the fourth quarter and calendar year. Following the invalidation of dry eye drug Restasis’s patents in federal court in October, we once again tested the assumptions underlying our valuation scenarios. The earlier-than-expected loss of Restasis profits and more conservative forecasts for the company’s aesthetics franchise resulted in a downward revision to our base case estimate of intrinsic value. The drop in Allergan’s stock price, however, has been far more pronounced, so we added to our position at $173 during the quarter.
Shares of Liberty Broadband, which represent Liberty Media’s 26% stake in Charter Communications, declined ~11% during the fourth quarter. In October, Charter reported a larger-than-expected decline in video subscribers and slower growth in the high-speed data (i.e., broadband) business. While strategic interest in Charter’s core cable assets appears to remain high, management continues to believe the most tax-efficient path to maximizing shareholder value is by gradually improving the Time Warner Cable and Brighthouse assets standalone. Despite the fourthquarter breather, shares of Liberty Broadband were healthy contributors to full-year performance. Natural gas producer Range Resources, which we’ve written about as a laggard for much of the past year, was the other primary detractor from Fund performance during 2017. We are in the process of evaluating the position relative to other potentially more attractive opportunities and will update you on our progress in the near future.
We sold two positions during the fourth quarter–United Parcel Services (UPS) and CVS Health (CVS). UPS was a nine-year holding for the Fund, generating benchmark-like annual returns over that period. The combination of rising capital intensity, potential for additional competition in the final mile of delivery and a full valuation led us to the sidelines. With the benefit of hindsight, we closed our small position in CVS Health somewhat prematurely. We were skeptical of the long-term merits of a potential merger with Aetna and unenthused about the prospect of issuing sizeable amounts of stock at a discount to complete the transaction.
The Fund established a starter position in Priceline Group (PCLN) during the quarter. Priceline is an online travel agency that gathers lodging, airline, car rental and other travel-related inventory in a centralized, digital marketplace for convenient discovery and booking by travelers around the globe. Priceline’s strength lies internationally, particularly in Europe. Booking.com, its flagship platform, has built relationships with some 700,000 unique hotels and 800,000 vacation rental properties around the world, providing scale and brand focus that enables the company to acquire new customers more efficiently than peevrs. Priceline’s future growth rate is likely to slow as it increases in size, but we expect the business to continue to benefit as bookings shift from offline to more convenient online channels. We anticipate the inherent cyclicality of global travel providing periodic opportunities to build on our initial position.
aaa
Average annual total returns for the Fund’s Institutional and Investor Class for the one-, five- and ten-year periods ended December 31, 2017, were 15.80%, 10.54%, 6.04% and 15.55%, 10.38%, 5.97%, respectively. Returns assume reinvestment of dividends and redemption at the end of each period, and reflect the deduction of annual operating expenses, which as stated in the most recent Prospectus are 1.10% (gross) and 1.24% of the Fund’s Institutional and Investor Class net assets, respectively. Returns also include fee waivers and/or expense reimbursements, if any; total returns would have been lower had there been no waivers or reimbursements. The Investment Adviser has agreed in writing to waive its fees and reimburse certain expenses (excluding taxes, interest, brokerage costs, acquired fund fees and expenses and extraordinary expenses) to limit the total annual fund operating expenses for Institutional Class shares and Investor Class shares to 0.99% and 1.30%, respectively, of each Class’s average daily net assets through July 31, 2018.
Institutional Class shares became available for sale on July 31, 2014. For performance prior to that date, returns include the actual performance of the Fund’s Investor Class (and use the actual expenses of the Fund’s Investor Class), without adjustment. For any such period of time, the performance of the Fund’s Institutional Class would have been similar to the performance of the Fund’s Investor Class, because the shares of both classes are invested in the same portfolio of securities, but the classes bear different expenses.
Average annual total returns for the S&P 500 and the Russell 1000 indices for the one-, five- and ten-year periods ended December 31, 2017, were 21.83%, 15.79%, 8.50% and 21.69%, 15.71%, 8.59%, respectively. Index performance is hypothetical and is shown for illustrative purposes only. Comparative returns are the average returns for the applicable period of the reflected indices. The S&P 500® is an unmanaged index consisting of 500 companies generally representative of the market for the stocks of large-size U.S. companies. The Russell 1000® Index measures the performance of the large-cap segment of the U.S. equity universe. It is a subset of the Russell 3000® Index and includes approximately 1,000 of the largest securities based on a combination of their market cap and current index membership. Russell Investment Group is the source and owner of the trademarks, service marks and copyrights related to the Russell Indices. Russell® is the trademark of Russell Investment Group.
As of December 31, 2017: Allergan plc comprised 5.7% of Value Fund’s net assets; Alphabet, Inc. (Parent of Google)-Class C 4.9%; Aon plc-Class A 2.8%; Berkshire Hathaway Inc.-Class B 8.8%; Dollar Tree, Inc. 3.0%; Laboratory Corp. of America Holdings 4.6%; Liberty Broadband Corp.-Series C 6.9%; Liberty SiriusXM Group-Series C 2.3%; Mastercard Inc.-Class A 4.0%; Oracle Corp. 3.7%; Praxair, Inc. 3.5%; Range Resources Corp. 0.7%; The Priceline Group Inc. 1.0%; Twenty-First Century Fox, Inc.-Class A 3.9%; Visa Inc.-Class A 3.1%. Portfolio composition is subject to change at any time. Current and future portfolio holdings are subject to risk.
See the full PDF below.


