For weekend reading, Louis Navellier offers the following commentary:
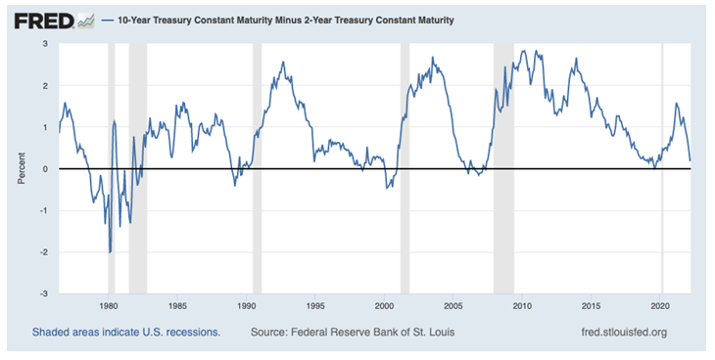
The first rate hike since 2018 is behind us and the bond market celebrated by pressing the yield curve closer to zero. The difference between the 2-year and 10-year note hit 17 basis points this week. Every recession in the past 40 years was preceded by an inverted yield curve – where this spread turned negative before the recession. The bizarre part is that even the 2020 recession, which had nothing to do with the Fed but a mandatory COVID shutdown, also saw an inverted yield curve in the summer of 2019.
Q4 2021 hedge fund letters, conferences and more
I don’t think the Fed is out to cause a recession, but I am just wondering how far they are willing to go, given that they are “behind the curve” on inflation. I seriously doubt that they can hike rates six more times in 2022 – as they implied they would do in the press conference following last week’s rate hike.
The trouble with too much debt in the system is that fewer rate hikes tend to have a bigger impact on the economy compared to a time when the economic system is less leveraged. Total debt in the U.S. economy stands at $88.3 trillion and GDP is about $24 trillion, so the debt to GDP ratio is 367%, pushing 400%.
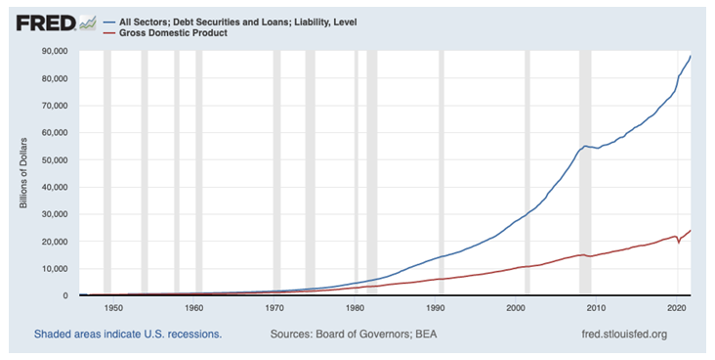
Those two lines are hopelessly diverging. I doubt we can make it to a 500% debt-to-GDP ratio without any accidents, but I would admit that the COVID recession was amazingly shallow given the speed with which money went out the door in Washington. Spending money you don’t have is easy, but unwinding the deficit binge and Fed balance sheet would be harder as we just witnessed the opening salvo.
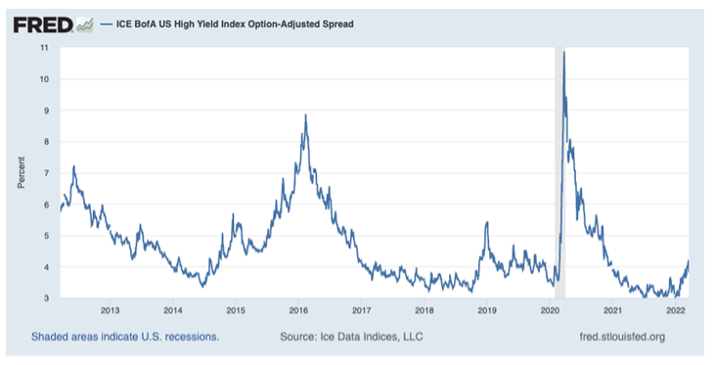
The composite high yield index amazingly shows spreads to Treasuries “inside 400” closing last week at 381 basis points (chart above). Credit spreads have risen, but not nearly as much as they did in 2018 when Powell managed to get them up to 535 bps, and not nearly as much as they did in early 2016 when a Chinese economic slowdown got them to nearly 900. I think credit spreads will rise more, particularly if the Fed is about to deliver at least half of what they say they will do in terms of tightening in 2022.
The geopolitical situation, which is complicating all these market worries about inflation and interest rates, is impossible to predict, other than to say that if it is resolved quickly, we will see a relief rally. If it is not resolved quickly, it will add to global inflation while the boomerang effect of all the sanctions has not been seen yet. I do think some sanctions will backfire – the full effects of which are yet unknown.
So far, it is not looking like a quick resolution scenario.
Can the Fed Override the Yield Curve?
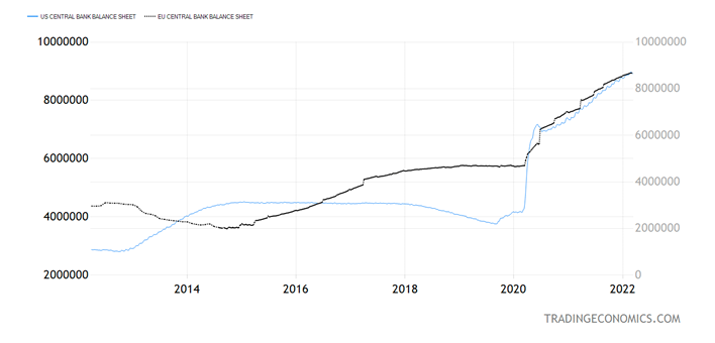
Since the Fed balance sheet almost made it to $9 trillion, virtually doubling the $4.5 trillion high from the previous crisis, can the Fed also push around Treasury yields and thus prevent an “inverted yield curve”?
To be honest, I am not sure. The interventions in the Treasury market and its equivalent in the eurozone are so extreme that we don’t know at this point what “normal” would look like, and my guess is that the Fed doesn’t, either. Powell has vowed not to be “on autopilot,” again, as in 2018, when his $50 billion balance sheet run-off rate caused quite the volatility in both stocks and bonds.
Since the balance sheet reached double the previous peak, does that mean the run-off rate will be double? That means $100 billion a month, which corresponds with the previous $120 monthly infusions. Also, shrinking the balance sheet in the U.S. while the ECB is still expanding implies a much stronger EUR-USD exchange rate, which in the middle of this geopolitical mess should not be surprising to anyone.


