The yield curve has spoken: a recession is coming. Everything indicates that it will make gold shine.
It Happened Again
Have you ever wondered what the yield curve’s favorite song is? Neither have I, but I bet that in July it was Britney Spears’ hit, Oops, I Did It Again! Indeed, the yield curve inverted again last month, for the second time in 2022. It means that long-term rates fell below those on shorter-dated bonds.
Q2 2022 hedge fund letters, conferences and more

As the chart below shows, the spread between 10-year and 2-year US Treasuries fell below zero for the first time this year at the beginning of April. However, it was a very short inversion, which lasted only two days, but on July 6, the yield curve inverted again – and this time it was more lasting.
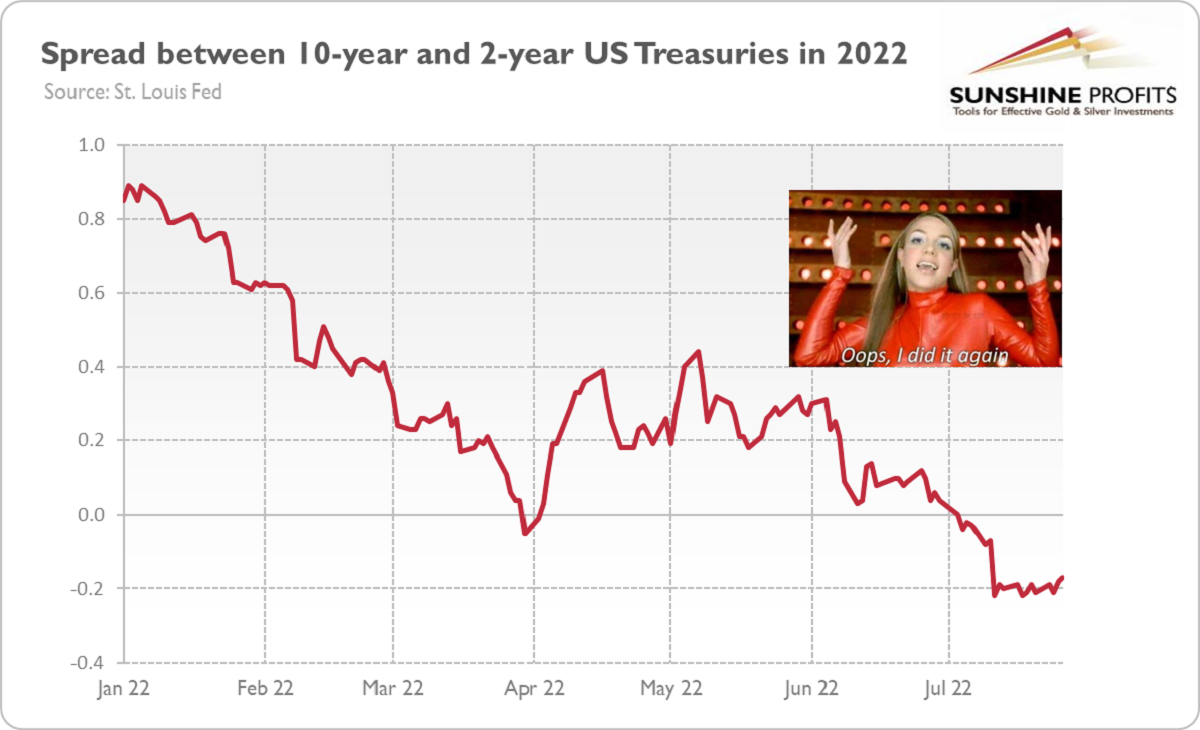
This is a very important development, as it strengthens the recessionary signal sent by the curve in April. The previous reversal was very brief and shallow – and thus not very reliable. However, the second inversion within just four months implies that dark clouds are indeed gathering over the US economy.
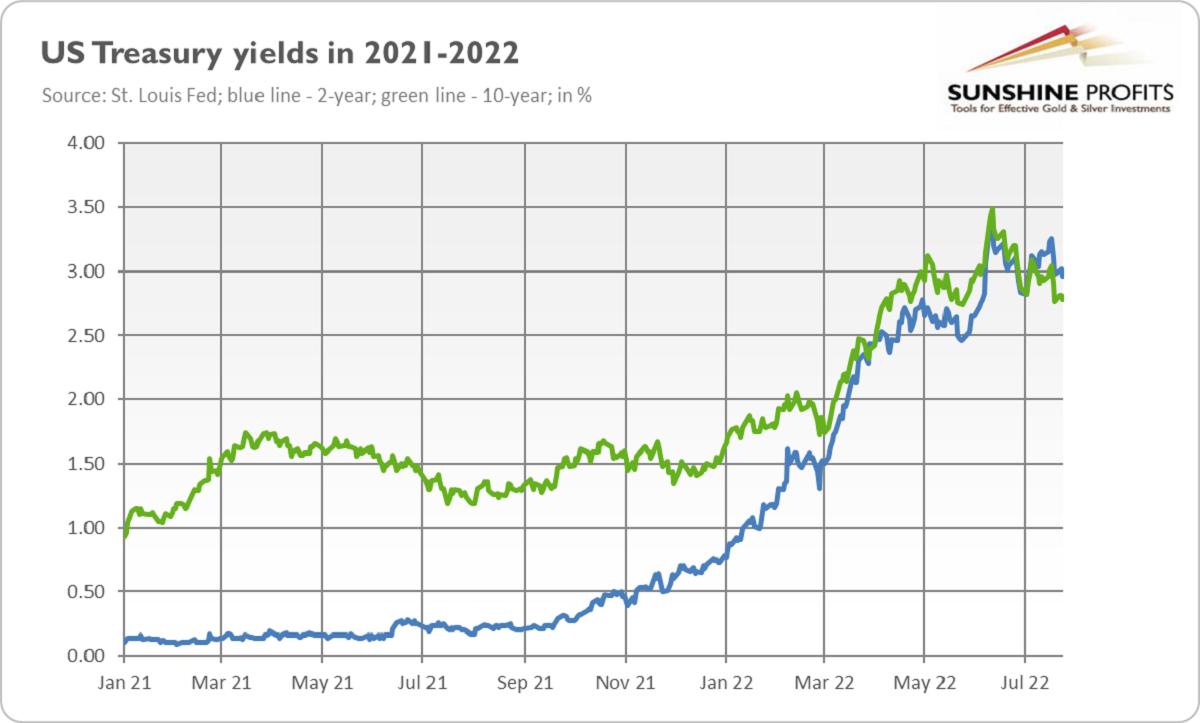
Why? There are two explanations for the yield curve’s inversion. According to the first one, more mainstream, inversion means that investors expect higher rates now and lower rates in the future, as they believe that the Fed’s tightening cycle will lead to a recession. The second interpretation is offered by the Austrian school of economics. It says that because of input price inflation and the tightening of the Fed’s monetary policy, entrepreneurs and investors are simply scrambling for funds, as they are in a liquidity shortage, which bids short-term interest rates up. Which one is true? Well, as the chart below shows, the yield curve has clearly inverted because of the rise in the 2-year Treasury yield, which fits nicely with the Austrian boom and bust cycle theory.
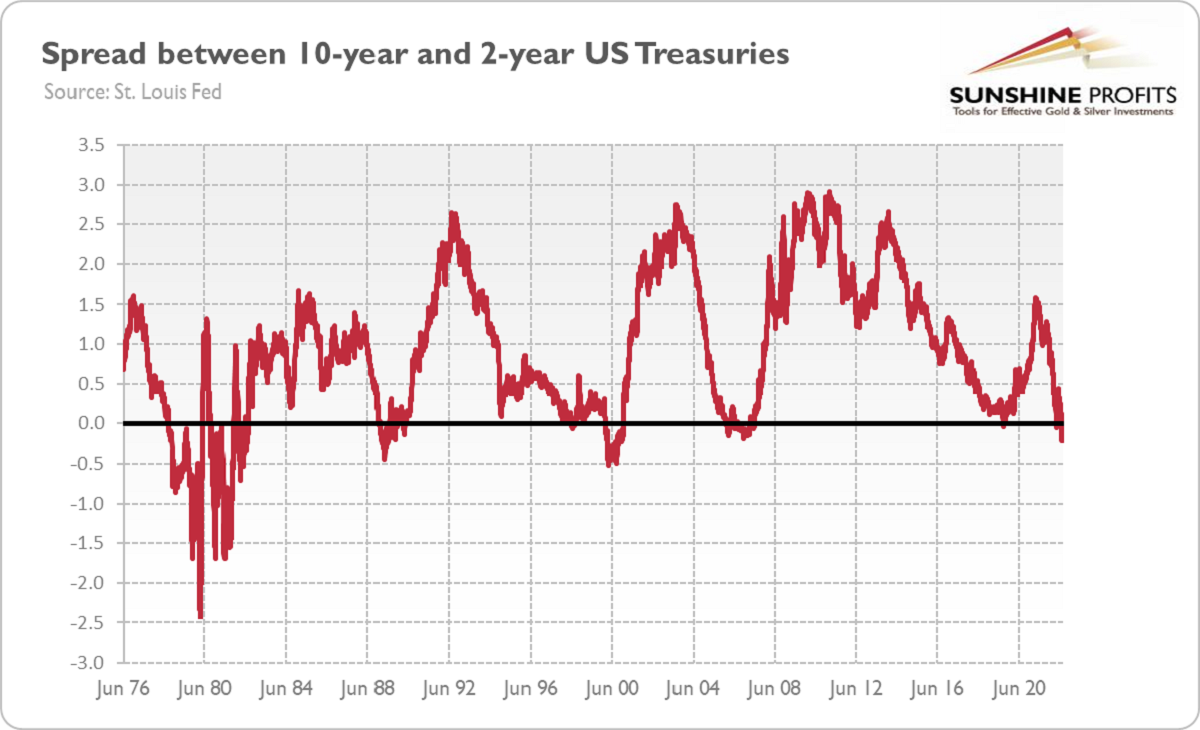
However, why should we worry about the yield curve’s inversion? Well, as the chart below shows, the inversion of the yield curve has been historically a very powerful recessionary signal. As one can see, it preceded all recessions since 1976. For example, the yield curve inverted in February 2000, in parallel with the burst of the dot-com bubble and about one year before the official beginning of a recession. The spread also turned negative in mid-2006, several months before the Great Recession, and in August 2019, just around the repo crisis, which would lead to another recession even if the coronavirus crisis didn’t occur. There was a false signal sent by the yield curve, but only one, when the curve inverted in mid-1998.
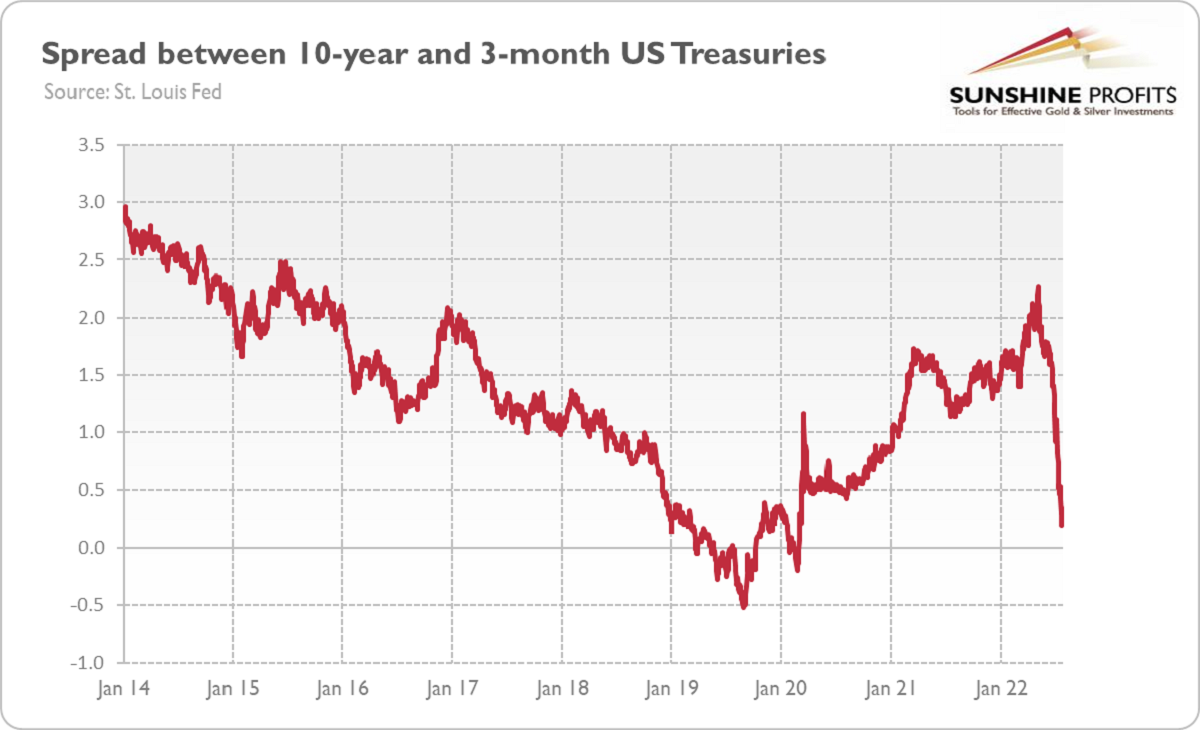
Should we believe the yield curve this time? Well, it’s possible that we’ll avoid a recession this time. After all, despite the slowdown in GDP growth, the labor market remains tight and the unemployment rate stays at a very low level. The more important spread between 10-year and 3-month US Treasuries hasn’t yet turned negative, as the chart below shows. However, it has flattened significantly since May, plunging to a level close to zero, and it may invert as well after the next hike in the federal funds rate.
Another issue is that since COVID-19, we have lived in exceptional times, so traditional indicators might not work properly now. However, this is something the pundits say each time the yield curve inverts: this time it’ll be different. Yeah, for sure! I’ve heard many justifications why we shouldn’t worry about the yield curve’s inversion in 2019. Each time it turned out that the yield curve was right and the pundits – wrong. In 2019, there was a repo crisis and a standard recession was on the way – the only reason it didn’t occur was the introduction of the Great Lockdown and the emergence of the coronavirus recession.
What does it all mean for the gold market? Well, in the immediate future, not much. In fact, the increase in the short- to medium-term bond yields could be negative for the yellow metal. However, in the more distant future, the inversion of the yield curve bodes well for gold. After all, it means that the recession is coming, and gold tends to shine during economic crises. Also, during an economic downturn, the Fed is likely to reverse its hawkish stance. When the Fed stops raising interest rates and starts to cut them, gold should rally again.
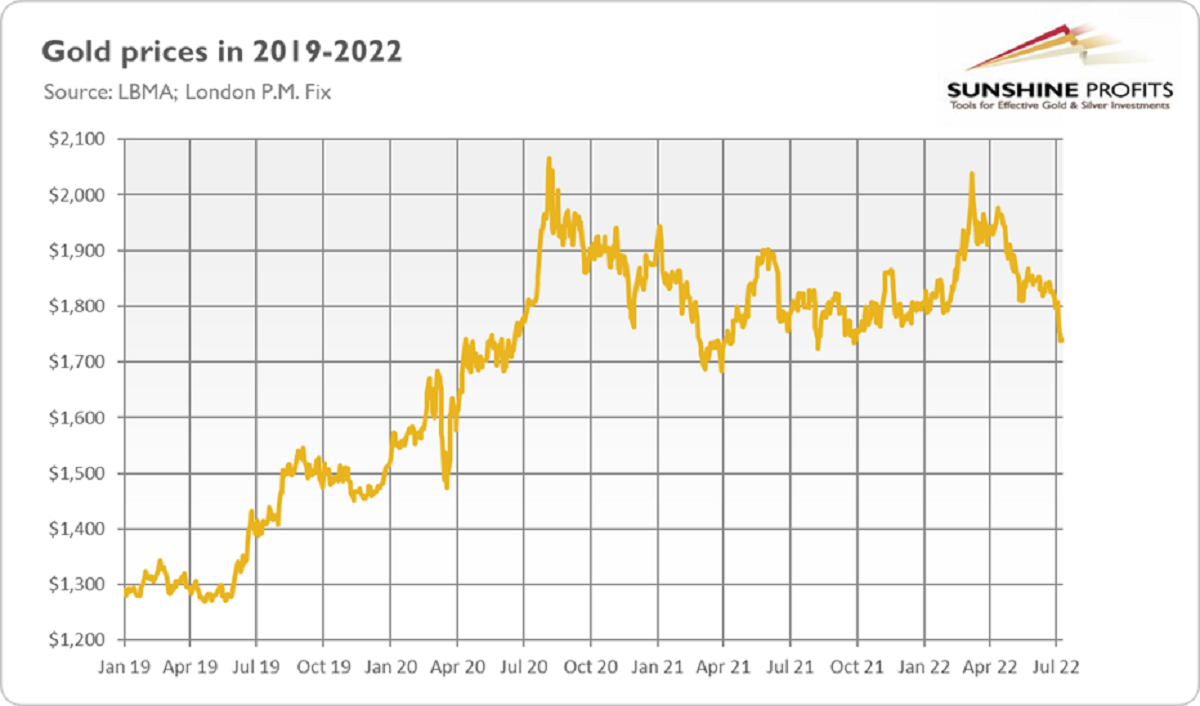
The analogy might be the 2018-2020 period. The Fed hiked the federal funds rate for the last time during its previous tightening cycle in December 2018. In July 2019, it started to cut its policy rates. As the chart above shows, the Fed’s dovish U-turn made gold soar. The same may happen this time. However, gold bulls should still be prepared for some pain – the Fed hasn’t said the last hawkish word.
Thank you for reading today’s free analysis. We hope you enjoyed it. If so, we would like to invite you to sign up for our free gold newsletter. Once you sign up, you’ll also get 7-day no-obligation trial of all our premium gold services, including our Gold & Silver Trading Alerts. Sign up today!
Arkadiusz Sieron, PhD
Sunshine Profits: Effective Investment through Diligence & Care.


