
In his Daily Market Notes report to investors, while commenting on the second-quarter results, Louis Navellier wrote:
Q1 2021 hedge fund letters, conferences and more
The Second-Quarter Results Are Looking Good
Over 90% of the stocks in the S&P 500 have announced their first-quarter results and, so far, the average sales and earnings surprises are running at 3.7% and 23.2% (respectively) above consensus analyst estimates. This is why analysts are so busy revising their consensus sales and earnings estimates higher.
I once predicted that sales and earnings momentum would peak in the first quarter, but I was premature, since second-quarter results could surpass the first quarter and help sustain this earnings momentum.
Our friends at Bespoke issued a great report on Tuesday that illustrated “what is working in the S&P 500” based on their decile analysis since February 12th. Here are the highlights based on their decile analysts. (Bear in mind that the overall S&P 500 rose just 5.5% in those 90 days, so these gains are exceptional.)
- The Top 30% of stocks in the S&P 500 with the lowest P/E ratio have risen 16.42% (lowest 10%), 16.48% (next lowest 10%) and 17.15% (third lowest 10%), respectively.
- The Top 30% of stocks in the S&P 500 with the lowest Price to Sales have risen 19.37%, 16.98% and 15.00%, respectively.
- The Top 50% of stocks in the S&P 500 with the highest Dividend Yield have risen 12.75%, 15.09%, 16.05%, 15.11% and 13.19%, respectively.
- The Bottom 20% of stocks in the S&P 500 with the lowest Share Price are up 11.59% and 12.15%, respectively.
- The Bottom 10% of stocks in the S&P 500 with the lowest Market Capitalization are up 10.63%.
- The Bottom 30% of stocks in the S&P 500 with the least International Revenues are up 8.61%, 11.24% and 10.25%, respectively.
A Mean Reversion Market And The Disruption Of Cyberattacks
In summary, this decile report on the S&P 500 illustrates is that we are in a “mean reversion” market since NASDAQ (the previous leader) has been correcting. Although this can also be interpreted as a “value shift,” value stocks without strong forecasted sales and earnings are expected to stall in the upcoming weeks. Essentially, mean reversion markets build a base for NASDAQ and growth stocks to “re-launch,” so I think it is important that if and when you buy value stocks, you stick to those with strong forecasted sales and earnings, like some of the steel and copper stocks that I recommend.
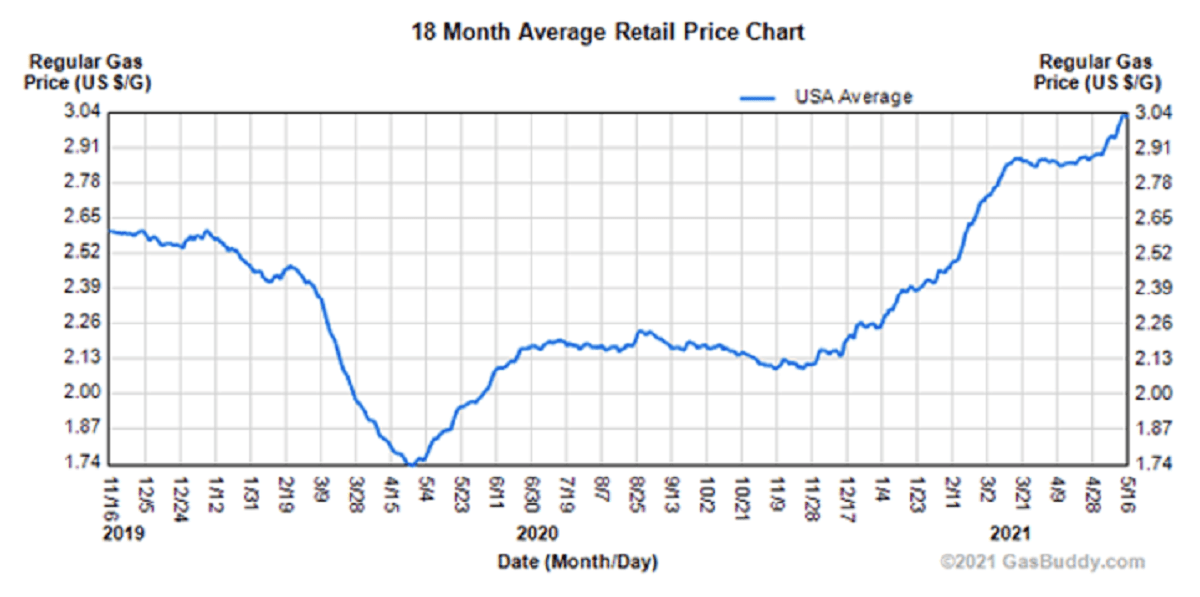
The one-week shutdown of the Colonial Pipeline revealed how disruptive a well-executed cyberattack can be. The six-day Colonial Pipeline shutdown was the most disruptive cyberattack on record. Widespread panic buying continues after the network restarted, leaving filling stations across the Southeast out of gas.
The main takeaway is that isolated attacks, even large ones like the Colonial Pipeline, had no material impact on the stock market, but they should serve as a major wake up call to all federal, state, and local authorities about preparedness. It would take something on a much larger scale to materially disrupt the financial markets, and the new infrastructure spending bill will no doubt take aim at rapid response systems to restore power, water, communications, and Internet services if they were taken down from cyberattacks. At the same time, cyber threats have “black swan” capabilities, just like pandemics.


