
The uncertain outlook for inflation and Fed policy has caused Treasury yields to fluctuate significantly in 2023. The Fed’s tightening has exposed weaknesses in the banking sector, as evidenced by the failure of Silicon Valley Bank (SVB), which has resulted in a surge in 10-year Treasury volatility to levels last seen in 2020 and 2008.
While rising rates alone may not necessarily harm market health, the increased uncertainty surrounding the path of interest rates can have significant consequences for all market participants. Banks may struggle to accurately price lending products. Business cash flows and ROI can become less predictable, and firms may have difficulty refinancing high levels of debt.
Q1 2023 hedge fund letters, conferences and more
Examining Bond Spreads
A common method to assess credit supply is by examining bond spreads. The difference between the yields of bonds with a certain rating quality and risk-free Treasury yields is primarily due to the default risk premium, which compensates fixed income investors. In times of deteriorating economic conditions, spreads usually increase as the likelihood of default rises.
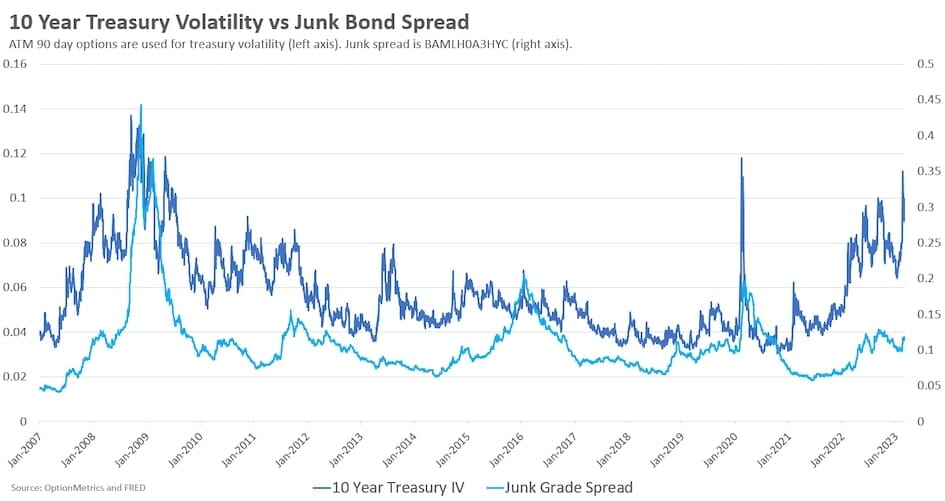
Graph 1 displays the Junk Bond Spread, which is calculated using the ICE BofA CCC and Lower US High Yield Index Option-Adjusted Spread. Typically, spikes in Treasury volatility coincide with spikes in the spread. This is economically logical since a deteriorating macro environment is reflected in rate uncertainty. The three most obvious events where spikes were simultaneous are: the Global Financial Crisis (GFC) of 2008, the EU Sovereign Debt Crisis in 2012, and the Covid-19 pandemic in 2020.
The Taper Tantrum Of 2013
It may seem puzzling that the recent spike in 10-year Treasury yields has resulted in a muted response in the junk bond spread. However, while spreads have moved quite a bit since the beginning of 2022, they are nowhere near the levels of 2008 or 2020, which would indicate the pricing in of a severe recession.
Rather, the current regional banking panic and instability in interest rates is likely closer in nature to the events of the taper tantrum of 2013.
The taper tantrum of 2013 occurred when the Federal Reserve announced its intention to reduce its monthly bond-buying program, which was implemented to stimulate the economy after the 2008 financial crisis.
The announcement of the tapering of the bond-buying program led to a sharp rise in long-term interest rates, which resulted in a sell-off in bonds and equities. In response to the market turbulence, the Fed delayed its tapering plans, eventually reducing the bond purchases in a more gradual manner, which helped to ease market concerns.
High-yield bonds are typically issued by companies with less predictable cash flows and weaker credit quality, making them less sensitive to interest rate movements but more sensitive to changes in economic conditions.
The taper tantrum in 2013 was largely driven by concerns over the potential tightening of monetary policy, which mainly affected the short end of the yield curve.
From analysis of the data above, it appears as though, similar to in 2013, the market perceives the failure of Silicon Valley Bank and the subsequent depositor bailout as relatively isolated events.
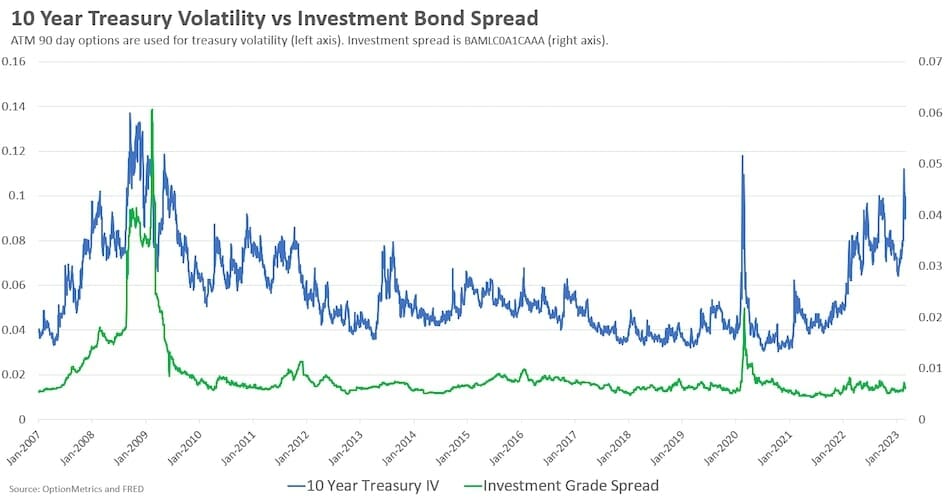
This is supported by the investment bond spread shown in Graph 2, which has hardly moved in 2023. Recent events have not resulted in significant credit tightening or signaled an imminent recession leading to a massive wave of defaults.
Article by Garrett DeSimone, PhD, & Anton Rotach, OptionMetrics
About the Author
Garrett DeSimone, Head Quant, and Anton Rotach, Jr. Modeling Quant, are with OptionMetrics, a futures and options database and analytics provider for institutional and retail investors and academic researchers worldwide. It is online at www.optionmetrics.com.


