
Tyson Foods, Inc. (NYSE: TSN) trades at a P/E multiple of 9.6x, which is much lower than the Consumer Staples sector median of 23.0x. While this makes TSN appear like a stock to add to your portfolio, you might change your mind after gaining a better understanding of the assumptions behind the P/E ratio. In this article, I will break down what the P/E ratio is, how to interpret it and what to watch out for.
Understanding Valuation Multiples and the P/E Ratio
A Multiples Valuation, also known as a Comparable Companies Analysis, determines the value of a subject company by benchmarking the subject’s financial performance against similar public companies (Peer Group). We can infer if a company is undervalued or overvalued relative to its peers by comparing metrics like growth, profit margin, and valuation multiples.
A P/E Multiple is a valuation ratio that indicates the multiple of earnings investors are willing to pay for one share of a company:
P/E Multiple = Stock Price ÷ Earnings Per Share
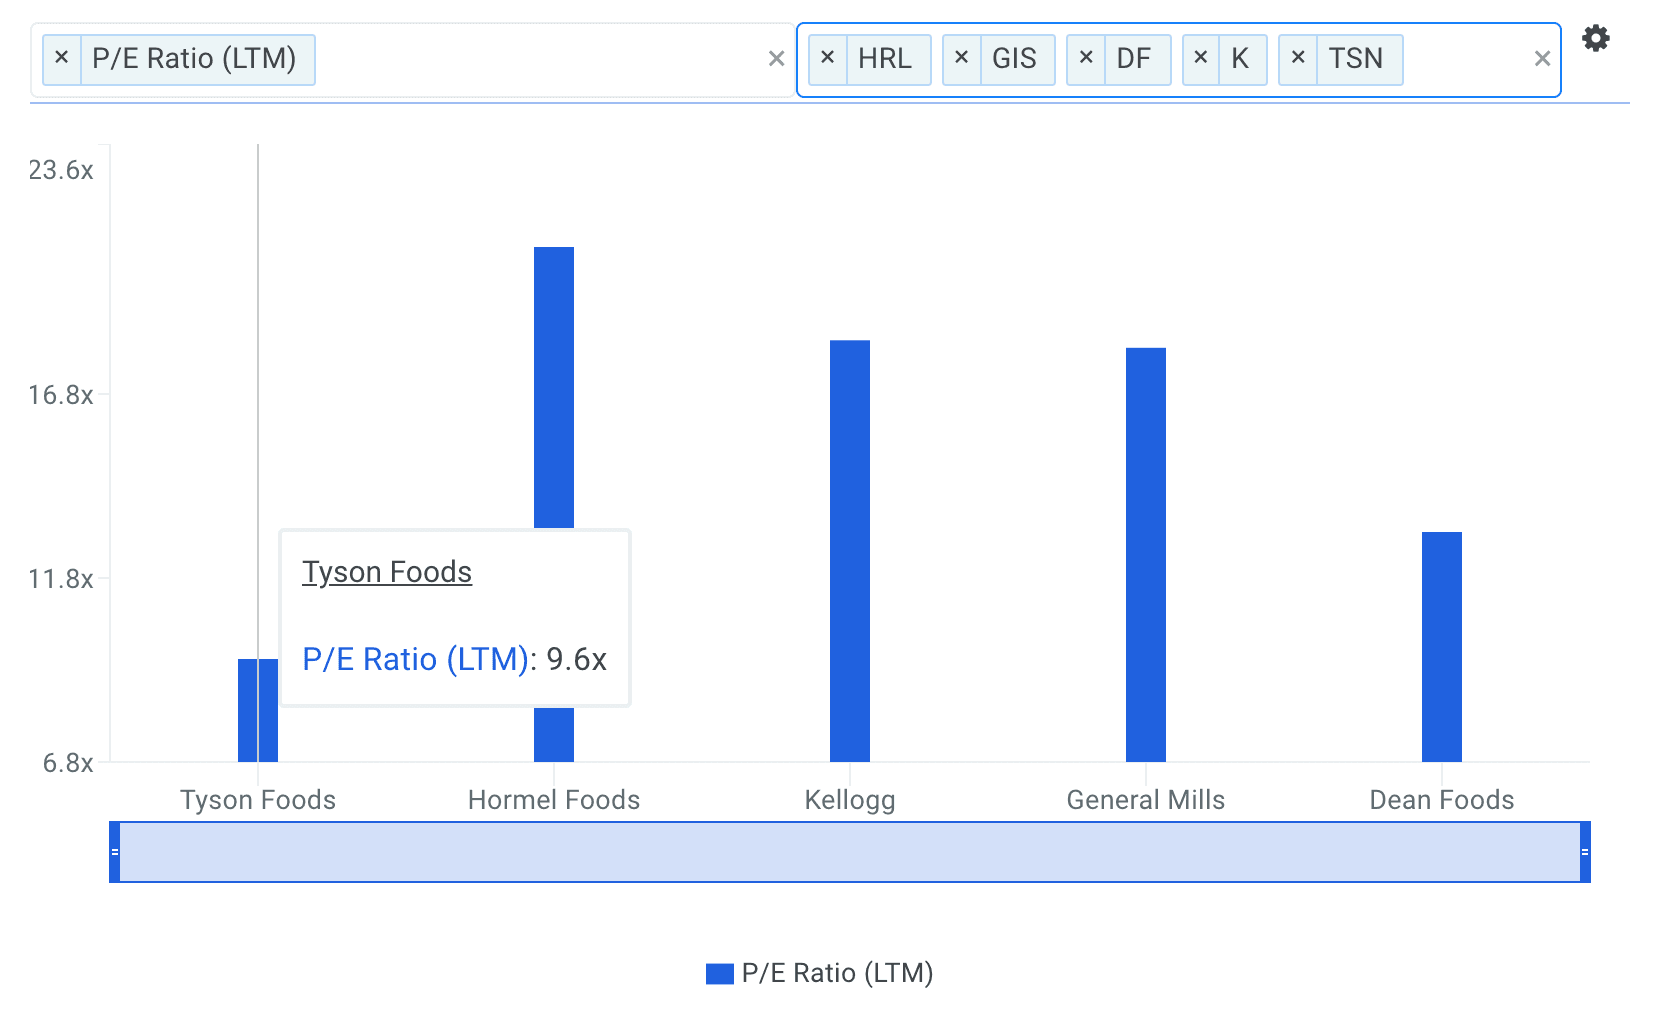
The P/E ratio is not meant to be viewed in isolation and is only useful when comparing it to other similar companies. Since it is expected that similar companies have similar P/E ratios, we can come to some conclusions about the stock if the ratios are different. I compare Tyson’s P/E multiple to those of Hormel Foods Corporation (NYSE: HRL), Kellogg Company (NYSE: K), General Mills, Inc. (NYSE: GIS) and Dean Foods Company (NYSE: DF) in the chart below.
source: finbox.io Benchmarks: P/E Multiples
Since Tyson’s P/E of 9.6x is lower than the median of its peers (18.2x), it means that investors are paying less than they should for each dollar of TSN’s earnings. As such, our analysis shows that TSN represents an undervalued stock. In fact, finbox.io’s P/E Multiple Model calculates a fair value of $129.31 per share which implies 75.4% upside.

Note that the selected multiple of 16.9x in the analysis above was determined by averaging Tyson’s current P/E multiple with its peer group and sector.
Understanding the P/E Ratio’s Limitations
Before jumping to the conclusion that Tyson should be added to your portfolio, it is important to understand that our conclusion rests on two important assumptions.
(1) the selected peer group actually contains companies that truly are similar to Tyson, and
(2) the selected peer group stocks are being fairly valued by the market.
If the first assumption is not accurate, the difference in P/E ratios could be due to a variety of factors. For example, if you accidentally compare Tyson with higher growth companies, then its P/E multiple would naturally be lower than its peers since investors reward high growth stocks with a higher price.
source: P/E model
Now if the second assumption does not hold true, Tyson’s lower multiple may be because firms in our peer group are being overvalued by the market.
What This Means For Investors
As a shareholder, you may have already conducted fundamental analysis on the stock so its current undervaluation could signal a potential buying opportunity to increase your position in TSN. However, keep in mind the limitations of the P/E ratio when making investment decisions. There are a variety of other fundamental factors that I have not taken into consideration in this article. If you have not done so already, I highly recommend you to complete your research on Tyson by taking a look at the following:
Valuation Metrics: what is Tyson’s free cash flow yield and how does it compare to its publicly traded peers? This metric measures the amount of free cash flow for each dollar of equity (market capitalization). Analyze the free cash flow yield here.
Risk Metrics: what is Tyson’s CapEx coverage? This is the amount a company outlays for capital assets for each dollar it generates from those investments. View the company’s CapEx coverage here.
Efficiency Metrics: inventory turnover is a ratio that measures the number of times a company’s inventory is sold and replaced over the year. View Tyson’s inventory turnover here.
Article by Matt Hogan, Finbox.io


