“Davidson” submits:
Vehicle Sales were released last week at 17.47mil SAAR(Seasonally Adjusted Annual Rate). Employment reports released today were higher than the average forecast. The Household Survey Employment reported 152,528,000, 447,000 than last month’s report. It is the trend which is important when analyzing this data. This report implies we have exited the industrial recession caused by 2yrs of strong US$ which forced US industrial corporations to down-size. Future reports are required to confirm this. Yet, once again pessimists are calling for a major correction while economic activity continues to expand.
Prominent forecasters believe the recent rise in market prices are due for a significant correction which they believe will lead to a significant economic downturn. The reverse is what we historically experience, i.e. economic activity drives market psychology which in turn drives market prices. Expanding economic activity has always driven markets higher as investors were drawn into being increasingly more optimistic as previous expectations proved too pessimistic. The same condition exists today.
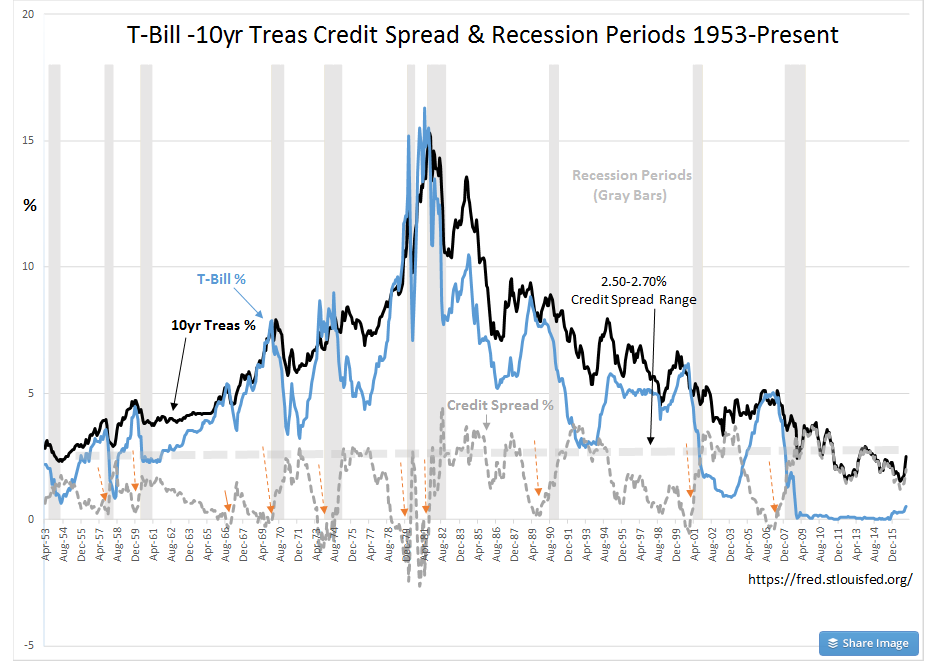
Forecasting the direction of economic expansion is relatively simple. The best overall indicator historically in my opinion is the T-Bill/10yr Treasury rate spread. The chart from 1953 shows the correlation between the rate spread an recession periods.
Every instance the T-Bill/10yr Treasury rate spread narrowed to 0.0%, but one, a recession ensued. The single instance when a recession did not occur was in 1966 as shown by the SOLID ORANGE ARROW. Market corrections did occur in every instance. If one reviews why this simple relationship is an effective economic/market indicator, one quickly comes to understand that lending institution lending profits are dependent on their cost of funds vs. lending returns for which the T-Bill/10yr Treasury rate spread is a proxy. Expanding lending activity drives economic expansions. A widening T-Bill/10yr Treasury rate spread drives lending activity. When the T-Bill/10yr Treasury rate spread narrows to 0.0%, lending activity slows markedly and over-levered businesses succumb rapidly as economic activity slows. Economic corrections are short but painful. Often corrections have lasted less than 2yrs. Short corrections have followed even when the prior expansion lasted 10yrs+. It is investor pessimism which seems to linger in relation to the pain experienced in the last recession. Many investors believe they see the next recession around every corner like Chicken Little believing that the sky is falling.
The current T-Bill/10yr Treasury rate spread is widening and supports future economic expansion. Even the most die-hard of pessimists will be forced to shift their perception towards a more optimistic stance as economic activity continues to prove them wrong. Eventually, economic activity will result in the T-Bill/10yr Treasury rate spread approaching 0.0% as optimism becomes too strong. For now, economic expansion is likely to continue for several more years with higher equity prices reflecting the gradual transition in market psychology from a position of substantial pessimism to one that is mostly optimistic.
It remains a good time to add capital to equities.