Advertisement Disclosure: When you purchase through our sponsored links, we may earn a commission from our partners. By using this website you agree to our T&Cs.
This article is an excerpt from a previously released Sidoxia Capital Management complementary newsletter (September 1, 2015). Subscribe on the right side of the page for the complete text.
Are you an adrenaline junkie? You may be one and not even know it. If you are an investor in the stock market, you may have noticed a sinking feeling in your investment portfolio before a sharp bounce-back, much like a bungee jump. Before the recent drop of -6.6% in the Dow during August, some stock investors got lulled into a state of complacency, considering a tripling in stock prices over the last six years.
Almost any current or future news headline has the capability of potentially triggering a short-term bungee jump in stock prices. Now, worries over the health of the Chinese economy and financial markets, coupled with concerns of an impending rate hike by the Federal Reserve have created some tension for global financial markets. The slowdown in China should not be ignored, but as famed investor Bill Nygren pointed out, its impact should be placed in the proper context. China only represents 15% of global economic activity and U.S. exports to China only account for 0.7% of our GDP.
Although the drop in U.S. prices last month was scary, other major markets were in deeper freefall. For example, the Chinese Shanghai Composite, Japanese Nikkei, and German DAX indexes nosedived -15%, -10%, and -9% last month, respectively.
Successful veteran investors understand alarming volatility is the price of admission to achieve superior, long-term equity returns. In fact, data compiled since 1900 underscores the commonplace of volatility over the decades. For example, during the last 115 years, investors have witnessed the following:
5% market corrections, 3 times per year on average (“correction” = price decline);
10% market corrections, 1 time per year on average; and
20% market corrections, 1 time every 3.5 years on average.
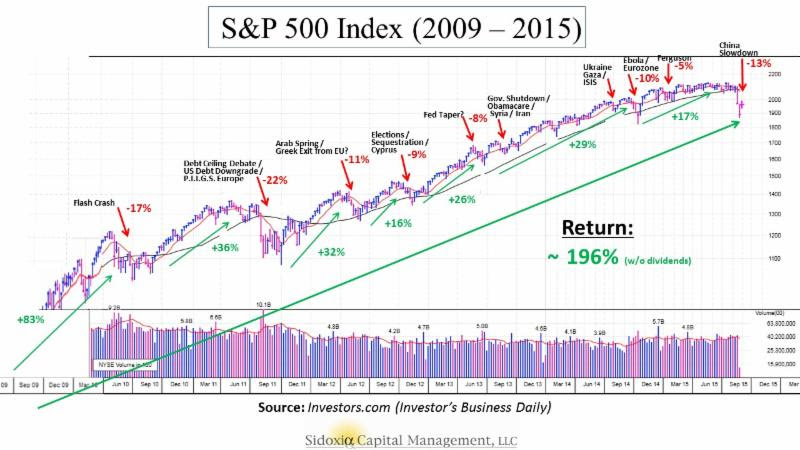
The chart below provides some graphical perspective on volatility over a shorter period of time (i.e., the last six years). As you can see, previous corrections have felt just as uncomfortable in magnitude as the latest dip, but regardless of the endless stream of concerns, prices have repeatedly rebounded.
Welcome Back Volatility! Mini Flash Crash
Another byproduct of the recent downdraft was unusual trading activity in certain stocks and exchange traded funds (ETF). For example, during the first ten minutes of trading last Monday, blue chip companies like General Electric Co (GE) and Starbucks Corp (SBUX) fell by more than -20%, before snapping back by at least +20% by the end of the day. Trading in certain exchange traded funds (ETFs) experienced similar trading anomalies, including Vanguard’s Consumer Staples ETF (VDC) with approximately $2.4 billion in assets. After dropping -32% in the opening minutes of the trading day, VDC closed down a modest -3%.
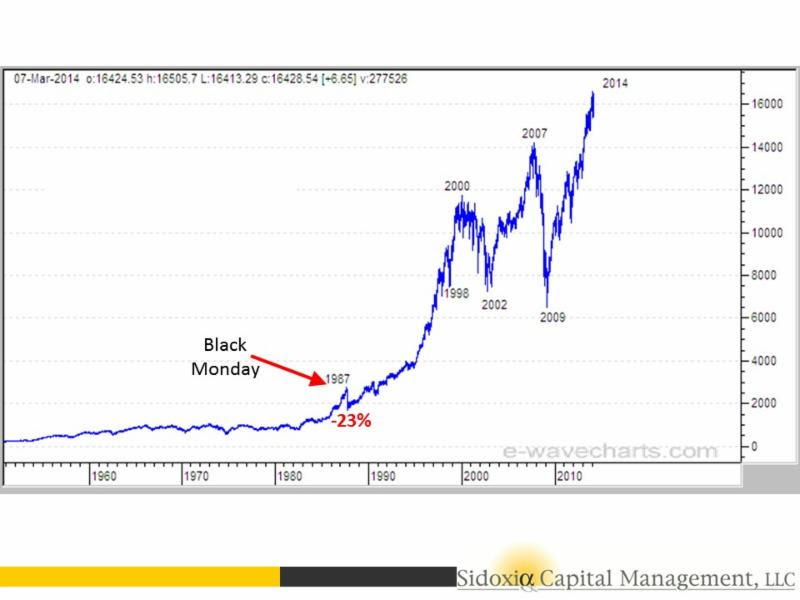
This type of trading activity does not build a lot of short term investor confidence, but this phenomenon of volatility is nothing new. As I pointed out in my Catching Falling Knives article, we survived quite nicely in the subsequent years post the 2010 “Flash Crash” – thank you for the +36% surge in the S&P 500 index through mid-2011. And if the -588 point drop (-3.6%) last Monday felt horribly for you, the decline actually isn’t that bad if you consider how miserably the -22.6% drop felt for investors on October 19, 1987 (“Black Monday“). That’s right, about one quarter of the entire stock market’s value was wiped away within a 24 hour period. You can see below, “Black Monday” turned out to be a very temporary condition that represented a huge buying opportunity. The Dow Jones Industrial Average has since increased in value by more than 10-fold (1,000%+) since the price crash of 1987 bottomed out.
Market
Surprise, Surprise? No!
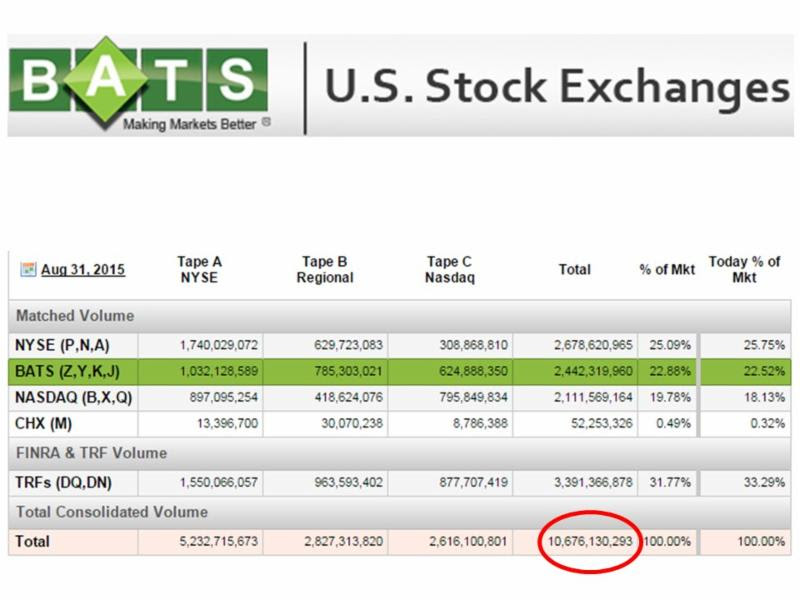
Should these sporadic wild short-term swings come as a surprise to anyone? Given the explosion in the number of daily shares exchanging hands, thanks in large part to cutting-edge advancements in networking technology, it’s no wonder we don’t experience these problems more frequently. Over the last five trading days, the U.S. stock market has averaged 10,676,130,293 shares in daily trading volume (see table below). With a computerized tidal wave of panic and greed periodically circulating through the financial markets in nanoseconds, investors will need to become more accustomed to turbulences like the recent one because technology will continue to push the envelope on ever-increasing trading speeds and volumes. Technological glitches played a major role in 1987 on “Black Monday” when computers were overloaded by panicked selling related to derivative trading (portfolio insurance). Similar problems occurred during the “Flash Crash” in the spring of 2010 when dislocations were created by the fragmented number of exchanges and under-regulated high frequency trading (HFT) participants.
Market
If you read the newspaper, watched the evening news, or combed financial blogs, you probably wouldn’t have any difficulty finding any items to worry about on the negative side of the ledger, including China’s difficulties, timing of a Fed Funds interest rate increase, and generally sluggish global economic growth. After last month’s bungee dive in stock prices, much of the underlying positives have been neglected or ignored:
Economic growth revised higher (Q2 GDP raised to +3.7% from +2.3%)
Unemployment rate continues to drop ( at 5.3%, a 7-year low)
Interest rates near historic lows (3.95%, 30-year mortgage rate), which will remain massively stimulative even if the Fed modestly increases short-term rates
U.S. corporate profits are near record highs (despite dampening effect of the strong U.S. dollar on exports)
Reasonable valuations (improved after latest index price declines)
Housing market on a steady recovery (existing home sales at multi-year highs and pricing up +6% vs. July of last year)
Massively accommodative central banks around the globe (e.g., European Central Bank and People’s Bank of China)
Not everyone wants to go bungee jumping, and not all investors can stomach the adrenaline filled swings of a 100% stock portfolio asset allocation. It’s volatile times like these that remind investors about the importance of diversification, along with staying true to your investment objectives. Too many times investors use their emotions to guide decision making. Living through market drops can be scary, but if your investment plan is securely in place, you can rest assured that this financial bungee ride will eventually bounce back higher.
Our Editorial Standards
At ValueWalk, we’re committed to providing accurate, research-backed information. Our editors go above and beyond to ensure our content is trustworthy and transparent.
Investing Caffeine, a blog written by professional money manager Wade W. Slome, CFA, CFP®. Investing Caffeine will wake up your investment brain by tackling the complex issues of investing and financial planning, with the goal of educating and entertaining your mind.
Investing Caffeine, a blog written by professional money manager Wade W. Slome, CFA, CFP®. Investing Caffeine will wake up your investment brain by tackling the complex issues of investing and financial planning, with the goal of educating and entertaining your mind.
Also, the 3 sectors that Wall Street analysts are most bullish about. The usual suspects dominated in 2025 as both the Communication Services and Information Technology sectors helped boost the...