Logica Capital commentary for the month ended June 30, 2022.
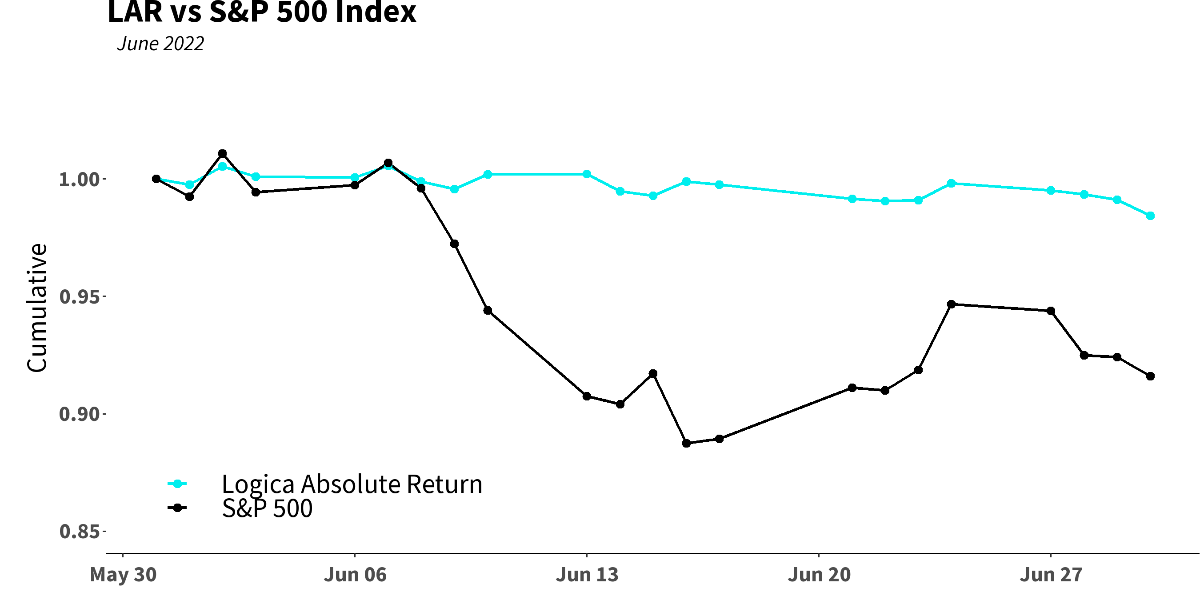
Logica Absolute Return (LAR) – Upside/Downside Convexity – No Correlation
- Tactical/dynamic balanced Put/Call allocation – Straddle
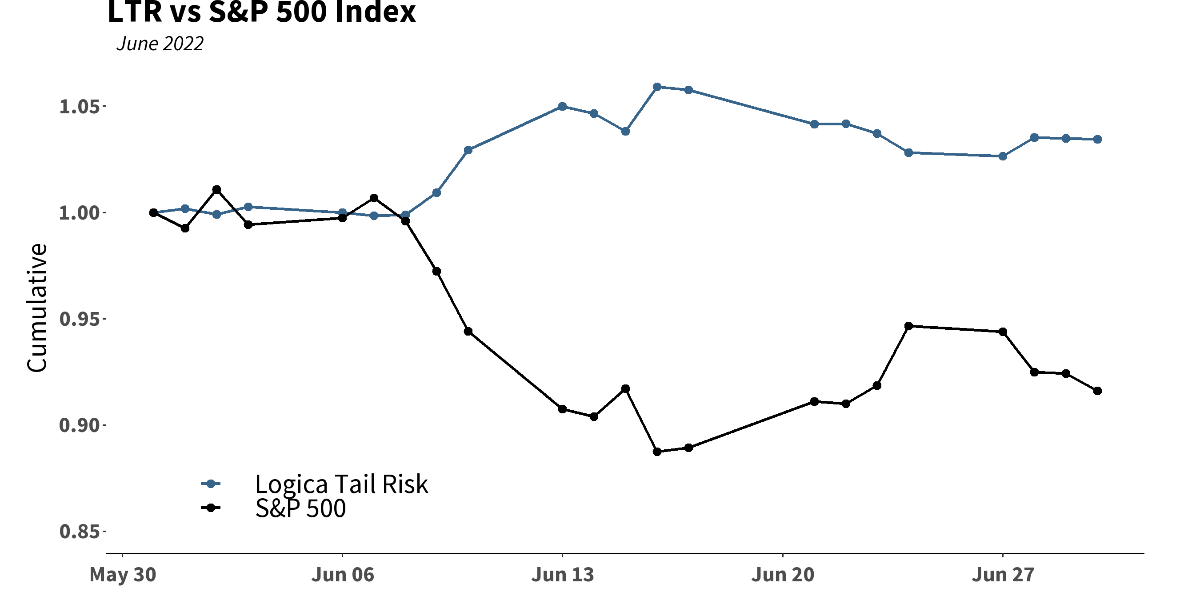
Logica Tail Risk (LTR) – Max Downside Convexity – Strong Negative Correlation
- Tactical/dynamic downside tilted Put/Call allocation – Ratio Straddle
Summary
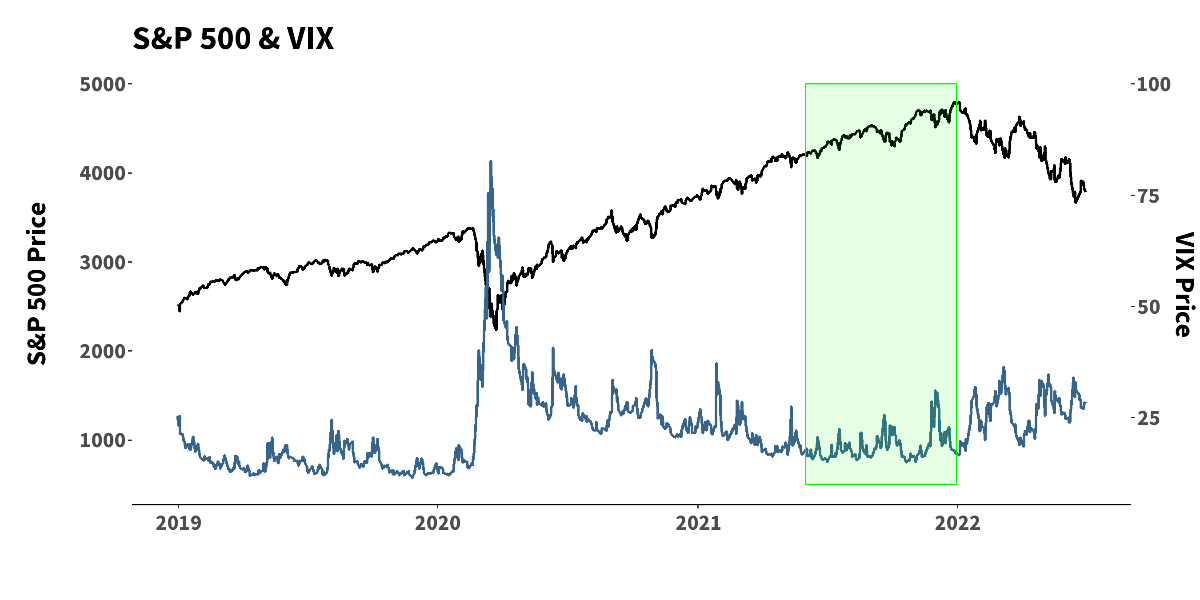
In what is becoming an incredibly familiar story (the broken records are stacking up!), June saw the S&P 500 down significantly without the expected response from VIX/Implied Volatility, as seen above. 2022 has also seen an astounding lack of volatility of volatility (“vol of vol”) – meaning, largely, that while implied volatility remains generally elevated, it is relatively unresponsive to even greater moves/gyrations in the underlying market.
Q2 2022 hedge fund letters, conferences and more
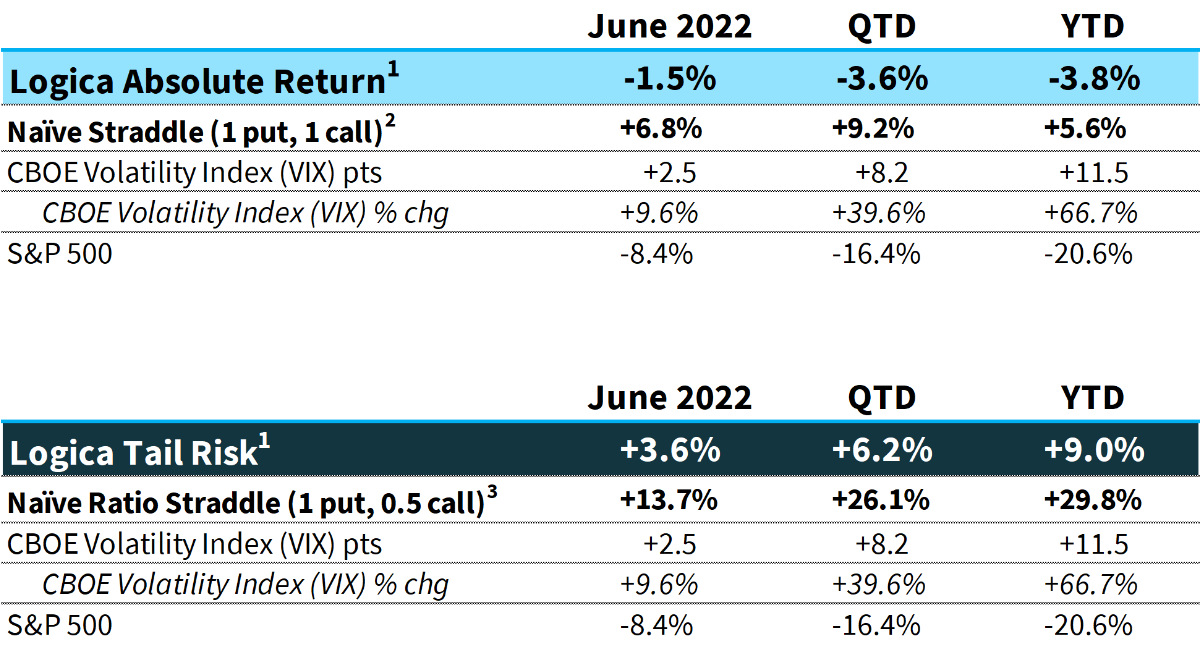
1 Returns are net of fees and represent the returns of Logica Absolute Return Fund, LP and Logica Tail Risk Fund, LP, respectively. Past performance is not indicative of future results.
2 Naïve Straddle Return: a 1.5 month out, S&P 500 at-the-money put and call bought on the final trading day of prior month and sold on the final trading day of current month. This return on premium is divided by a factor of 6 to be comparable to Logica’s typical AUM-to-premium ratio. For illustration purposes only.
3 Naïve Ratio Straddle Return: a 1.5 month out, S&P 500 at-the-money put and at-the-money call (divided by 2) bought on the final trading day of prior month and sold on the final trading day of current month. This return on premium is divided by a factor of 6 to be comparable to Logica’s typical AUM-to-premium ratio. For illustration purposes only.
Logica Capital Commentary & Portfolio Return Attribution
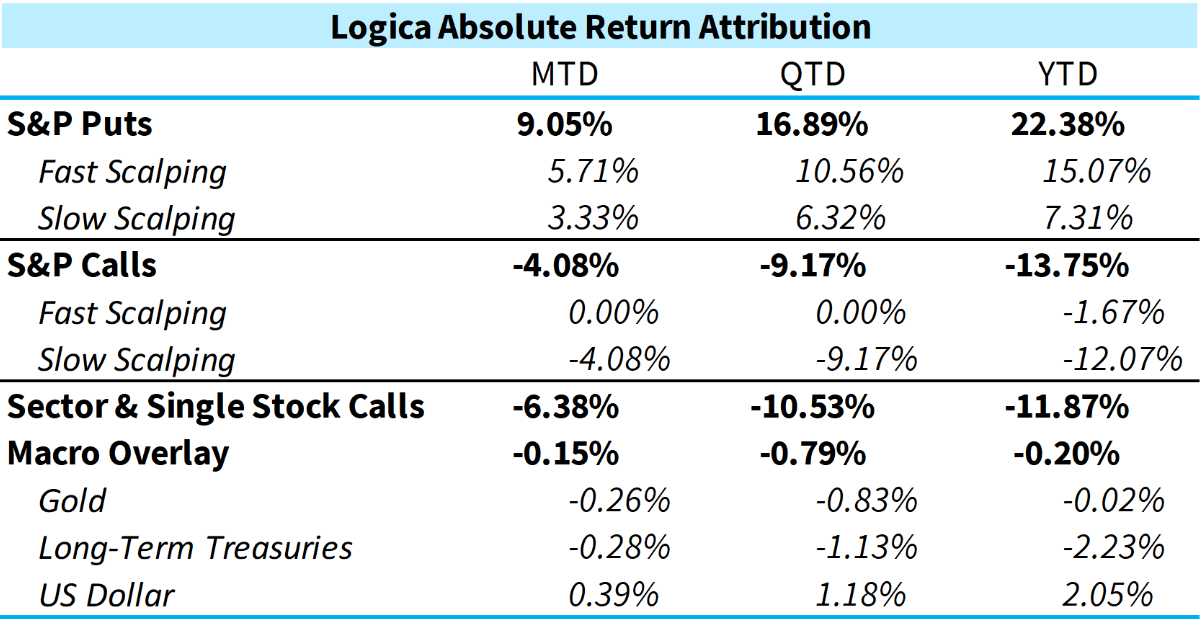
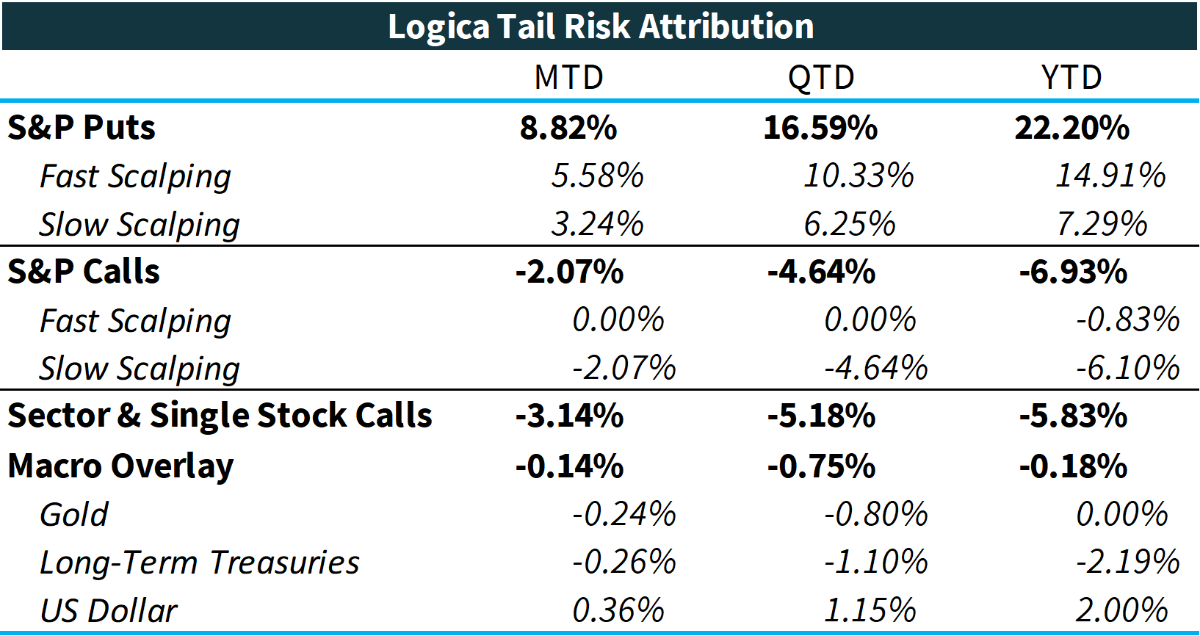
* For illustration purposes only. Attribution returns are composed of daily returns, gross of fees
Most of our modules performed about as expected in June, with neither under nor outperformance to note.
Sector & Single Stock calls were negative on the month, albeit continuing to outperform the S&P, with a more contained drawdown than the broader market for long only exposure. That said, we expect this basket to do even better (given its more stellar outperformance over the last 18 months) and are as confident as ever for S&P outperformance from this module going forward.
We continue to experience lack of contribution from our “risk-off” Macro Overlay bucket. While we have a significantly reduced positioning in Long-Term Treasuries, as discussed in several prior letters, curiously Gold is not performing as expected in this inflationary environment, and during a large broad market drawdown, where history has demonstrated quite the opposite for Gold. Simply, though Gold is nearly flat on the year, it has certainly not lived up to its billing as a “risk-off” asset where one would expect substantive profits in an environment like 2022.
“Theater has given me a different perspective on the way I approach films.” – Jake Gyllenhaal
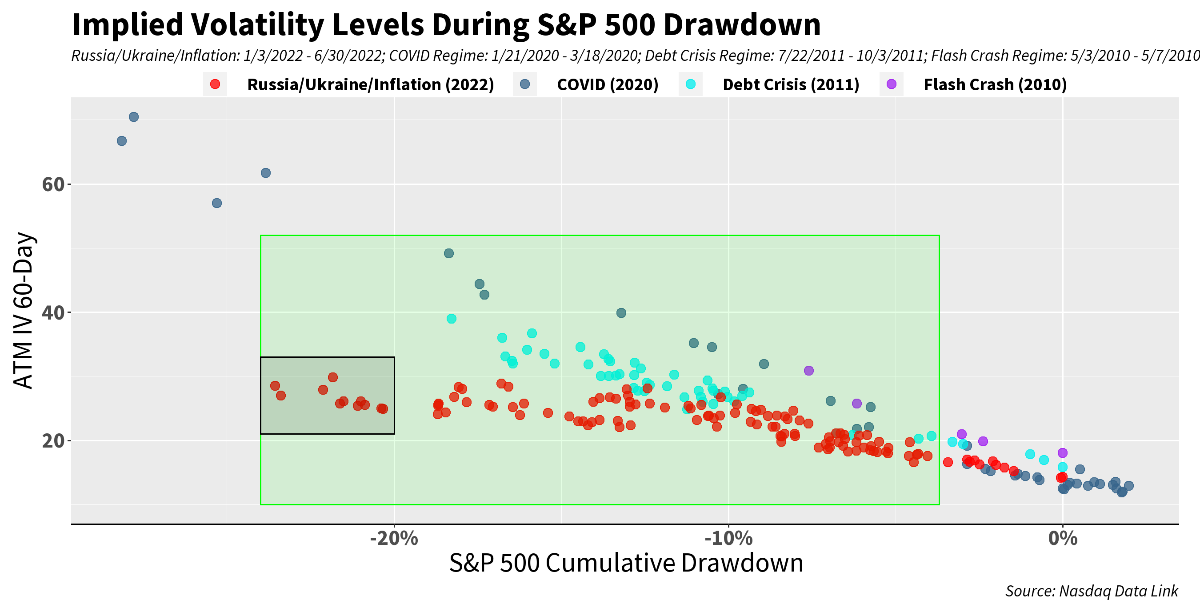
As we close the books on Q2 2022, a familiar theme echoes: implied volatility is simply not responding to moves in the broader market. While we have addressed this fact in numerous recent letters, at this point, we will take an even closer look at a wide landscape of implied volatility measurements, indices, and products to more fully flesh out this phenomenon.
First, we return to a familiar graphic – 60-day implied volatility (IV) relative to the cumulative drawdown of the S&P 500. Astonishingly, while IV remains elevated (and somewhat “expensive”), it simply is not moving as it has historically. As we can see in the chart below, we are getting similar levels of implied volatility from the -10% to -15% bucket of S&P cumulative drawdown as we do from the -20% to -25% bucket. Almost unbelievably, Implied Volatility has flat-lined – and to boot, in the face of further S&P decline!
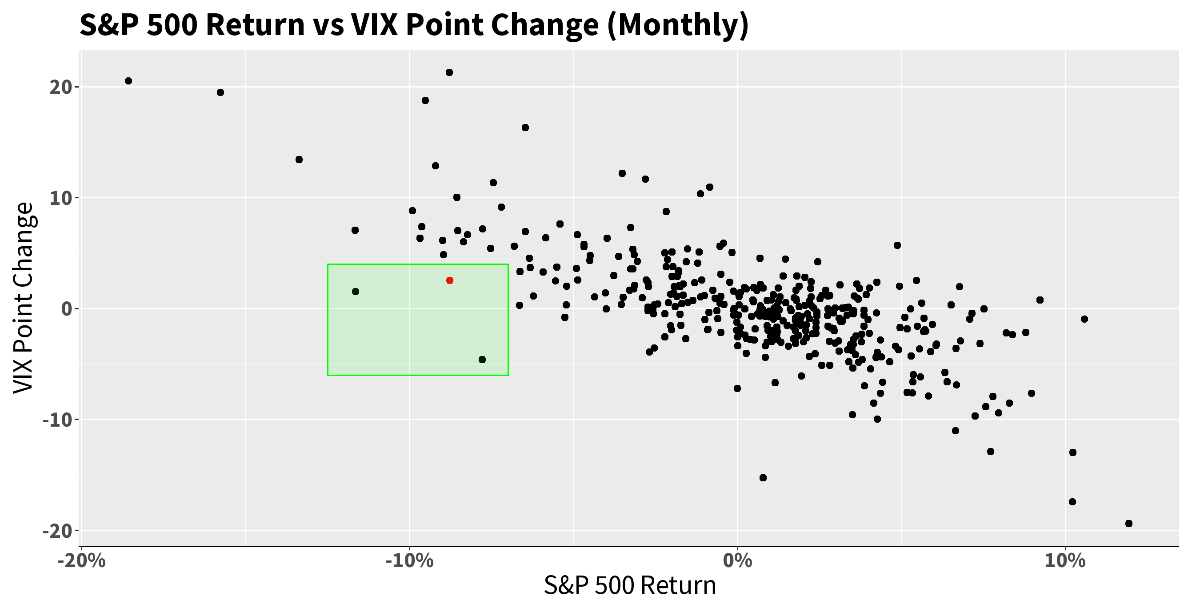
Similarly, we see much of the same when we look at the VIX in the chart below. The June outcome (red dot) was highly abnormal (S&P 500 down nearly -9% with VIX only +2.5 points). And what is even more incredible about June 2022, is the starting point of VIX going into the month, in stark contrast to the other 2 highlighted months, as detailed in the grid below.
One might have no problem believing that implied volatility/VIX would be unresponsive if IV/VIX were coming from an extremely, already elevated level – in simple terms, for implied volatility to continue increasing, the underlying index typically needs larger and larger moves. That becomes very difficult after major corrections, in which the daily movement of indices might be extremely large. Recall the size of the moves during 2008, and more recently in Q1 2020 – those are incredibly hard to sustain.
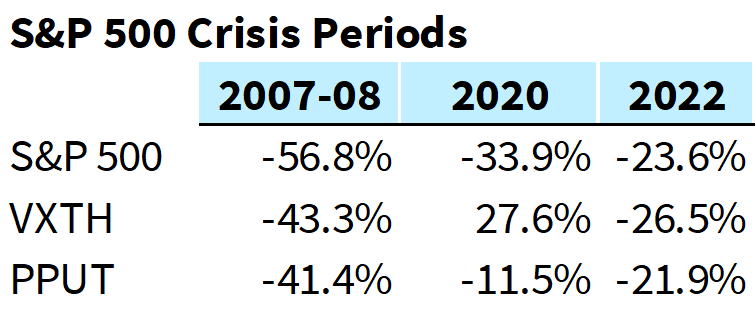
Here’s a summary of our 3 dots, with the added column indicating the prior VIX level:
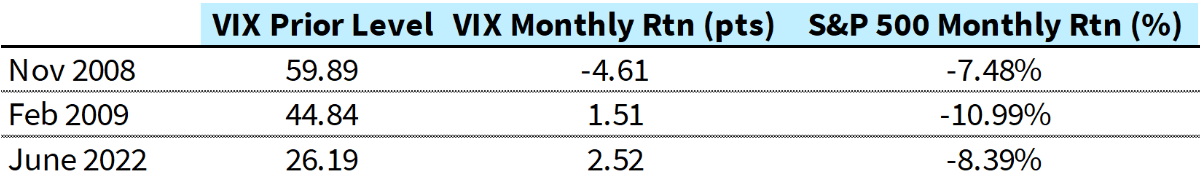
We clearly see how much more elevated VIX was prior to these comparable outliers. A vol trader expects “abnormal” vol behavior from levels elevated to the extent that they were in 2008 and 2009 (and several other similar times), but it is still rather unexpected, even if it must be considered as a potential outcome.“Have you ever felt like a phone call that’s been disconnected?” – Shannon Doherty
Looking at products/indices that use volatility as a hedge for a long position, we again see the major disconnect YTD for 2022.
VXTH
- Buys and holds the performance of the S&P 500 index (the total return index, with dividends reinvested), and
- Buys one-month 30-delta call options on the CBOE Volatility Index (VIX). New VIX calls are purchased monthly, a procedure known as the “roll.” The weight of the VIX calls in the portfolio varies at each roll and depends on the forward value of VIX, an indicator for the perceived probability of a “swan event”.
https://www.cboe.com/us/indices/dashboard/vxth/#vxth-overview
PPUT
- The CBOE S&P 500 5% Put Protection Index (PPUT) tracks the value of a hypothetical portfolio of securities (PPUT portfolio) designed to protect an investor from negative S&P 500 returns. The PPUT portfolio is composed of S&P 500 stocks and of a long position in a one-month 5% out-of-the-money put option on the S&P 500 (SPX put).
- The PPUT portfolio is rebalanced monthly, typically on the third Friday of the month, when the SPX put expires. A new SPX put is then bought.
https://www.cboe.com/us/indices/dashboard/pput/
If we look at a few major drawdowns, we see that VXTH provided a ton of value in 2020, and even in 2008 provided some value over just holding the S&P 500. However, the inclusion of OTM, 30-delta VIX calls alongside holding the S&P 500, in 2022, has — incredibly — been a drag on return!
This is fairly unintuitive that calls on the VIX would not be additive to a strategy, given that the VIX index is up more than +11 points YTD, but that is precisely the point — it illuminates just how difficult an environment this is for optionality (and further, how difficult an environment it has been for OTM options, whether calls on VIX or puts on the S&P 500 Index).
Similarly, PPUT provided some benefit in 2007-08, sizeable benefit in 2020, but basically none in 2022.
As an aside, both indices are undoubtedly subject to influences with respect to timing and rebalancing via their roll mechanism, (we can call this a certain kind of path dependency, which would be ideal to avoid if possible), but because the sample size of crisis events is, by definition, very small, we can only present the observed reality here. The stark difference between the performance during 2020 as compared to 2022 seems to be large enough that we can ignore the noise factor created by the “randomness” of the roll/rebalance timing.
“Compared with games, reality is disconnected.” – Jane McGonigal
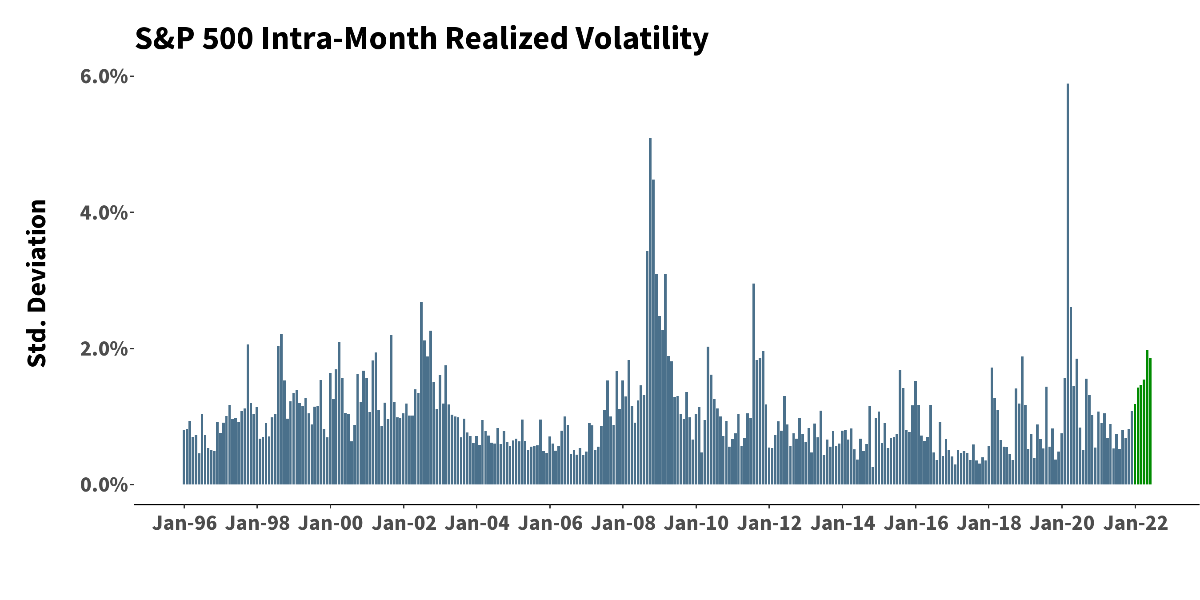
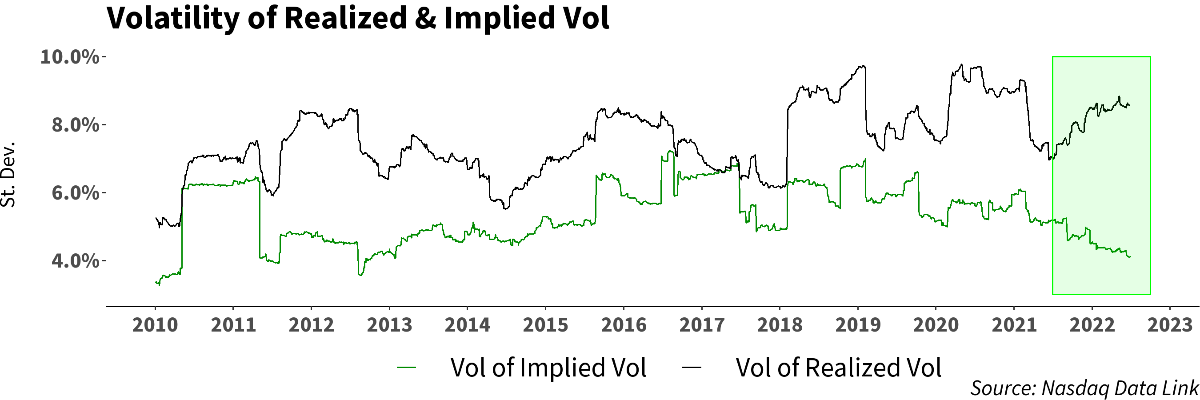
Still elsewhere, we see a powerful divergence between the volatility of implied vol (vol of ivol) and the volatility of realized vol (vol of vol). Essentially, this means that implied volatility has just not been responsive to moves in the underlying index relative to what one would expect of it based upon history. As the first step of this analysis, note the fact that both realized vol and the volatility of realized vol have been rising and/or remaining elevated over the course of 2022.
Then, with that context in mind, one can appreciate the massive divergence between vol of vol (the volatility of realized vol) and vol of ivol (the volatility of implied vol). The declining variance of implied vol while realized vol has been increasing in variance – literally, going in opposite directions! – enunciates how unresponsive implied vol has been to rising realized volatility. Simply, while the market is actually getting more volatile, the FEAR of it getting even worse is concurrently lessening.
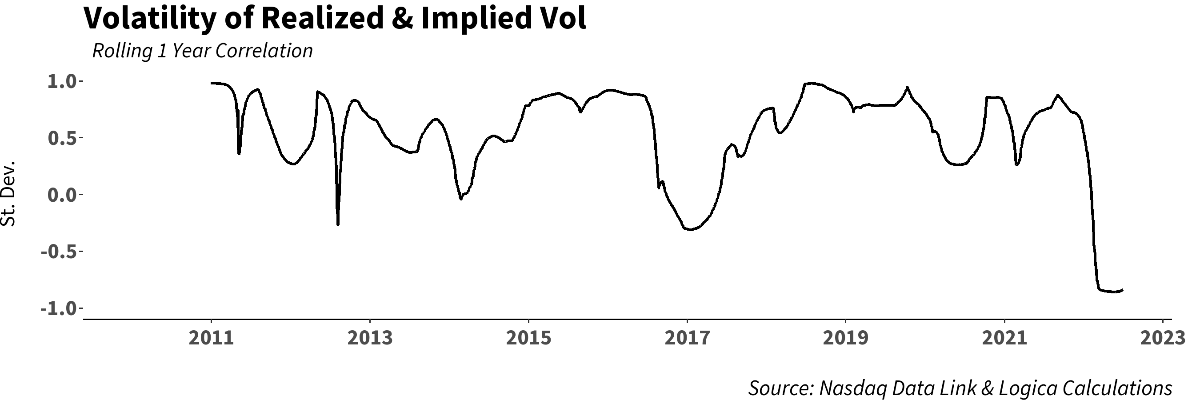
To further quantify this divergence: the historical correlation of the above 2 series is +0.42, while the correlation during 2022 has been -0.32. Here’s a look at 1-year rolling correlations between the two:
In looking elsewhere for this wild divergence, and noticing the absolute level of vol of ivol, we clearly see that we are at elevated volatility levels, and yet looking at the VVIX, which is an index that tracks the volatility of the VIX, we’ve reached lows not seen since before the pandemic!The data are pretty remarkable. Stepping back, it’s important to understand, of course, that an option holder does not get paid because implied volatility is high (or low). They get paid for the movement of implied volatility (which is to say, for the movement of the option price, of course).
What we have seen, as presented above, is that implied volatility has been relatively unresponsive to 1) Drawdown in the S&P 500 and 2) A rising/elevated realized volatility environment (as is usually the case during a drawdown).
I’m a great believer in our ability to come up with the ideas necessary to solve the big questions. I have less confidence that we’ll be able to find consensus about which ones are right without experiment.” – Leonard Susskind
So there’s the data. But what does this mean going forward? Why is this happening, and will it continue to occur? And some other ever-so-hard-to-tackle questions…
Though we don’t claim to have all the answers, we certainly have some theories. And while there are numerous potential contributors to Vol’s muted behavior, instead of discussing the variety of thoughts we have, we prefer to dig into the big influencers. What we would posit as the most influential contributor is the lack of shock or surprise in the stress event. Historically, we see that “surprise” (or the shock value of new information) is one of the primary drivers of investors scrambling to hedge. In a sense, the market’s inability to price in new information or data quickly is what creates the uncertainty that begets more hedging during the analytics and processing phase, e.g. let’s hedge, figure this stuff out, then react as we determine from the results of our deep dive. However, in this year’s market, there seems to be far more known/expected information about all that is going wrong.
Breaking news: inflation! And with that non-news news, there is an expected action of the Fed – raise rates – and to boot, at an expected level. And as we’ve seen thus far, the increases have been exactly in line with expectations (as priced into the bond market). In other words, had the Fed raised 100bps a few weeks ago, or else just 50bps, then the market would have had a SHOCK; what is it that we didn’t think about that the Fed is considering? But they’ve been right in line with consensus, leaving little surprise, and therefore no new data to process that would beget hurried portfolio decision-making.
Thus, the broad problem we have faced in 2022 is with slow economic change, and very few shock value days or events, alongside the generally slow output of numbers to consider that may or may not lead us into recession (unemployment, housing, CPI, Fed rate decision, etc..). And of course, in between these weeks/months of waiting for each number, markets have no new data to consider, and so no impending shock to hedge. And then when the numbers come out as expected, or even close to expected, as has been the norm this year (back to Fed decision of 75bps), then again, no shock value, just status quo of inflation pending, and Fed aiming to control in an anticipated way.
In fact, if we look at a few of the biggest IV days in recent months, it has only been on the “surprise” number release days (for example, when housing starts shocked with far below consensus, the market fell harder than usual, and IV actually spiked decently that day given the embedded uncertainty of the number, albeit to rapidly revert in the following days).
Following that broad theory, the second big influencer, as supported by the data, is that the market was already highly hedged, even over-hedged, coming into 2022, which appears to have actually started around June of 2021. The evidence for this is twofold: first, that from June of 2021, IV was rising/flat, and with some intermittent spikes, alongside an S&P that was concurrently rising, and even making new highs over the same period:
Looked at with a wider lens, and amazingly, by the end of 2021, implied vol was elevated above its pre-COVID level, even though the S&P 500 had appreciated nearly 50% from its pre-COVID level.
One could read this as the market somewhat already pricing in the correction to come, even though the underlying market took some time thereafter to actually break down. In this case, was implied vol a leading indicator that something was amiss?
The second piece of evidence is the behavior of IV/VIX over the course of 2022. When the first leg down in the S&P occurred in Jan, IV did not spike as expected (underperforming prior similar magnitude events), which can often be explained by holders selling into the spike, or said similarly, the unwinding of hedges that were alread on the books. And so not only did the next leg down not initiate an IV/VIX breakout (to 40, 50, etc…), but likely just furthered this premise. If January demonstrated that IV was not going to pay, then even more so, the next high should be used to further lighten up! And so with each new leg down in the market, the lackluster Vol reaction instigated further selling of existing hedges. This would clearly explain the lower highs in VIX with each next leg down in S&P; the opportunity to sell out of over-hedge became increasingly aggressive. In sum, the apparent feedback loop in the supply of volatility may have all started with too much inventory coming in.
To be fair, the above analysis certainly omits the possibility that market participants were already hedged in other/additional ways: e.g., cash, and more notably, CTAs and trend following strategies, which are having a good-to-great year, and which is to be expected in a market that slowly grinds in one direction. Of course, these strategies typically suffer in larger and quicker down events and/or volatile markets that whipsaw frequently, which is precisely where volatility exposure/trading comes in.
All that said, any answers to such questions are educated guesses and hypotheses. What we do know, given the lack of response in implied volatility, is that there is simply not much fear in the market as of June 2022. We are reminded every so often that it is possible for major market indices to experience meaningful declines without its participants believing that the sky is falling! As vol traders, we obviously lament the fact that (implied) vol has been fairly unresponsive, but if we can step back from this bias, it is usually the case that orderly, “healthy” corrections are just that: healthy, at least in the long run. And at the same time, we certainly continue to strongly believe that there are turning points, where if we see a decline of a certain magnitude, or a number or event with too much shock value, fear/implied vol should pick up dramatically.
Finally, taking a look at the movement of our strategies for the month, we see LTR with a nicely negative correlation, and LAR generally uncorrelated over time.