“Earnings don’t move the overall market; it’s the Federal Reserve Board…
Focus on the central banks and focus on the movement of liquidity…
Most people in the market are looking for earnings and conventional measures.
It’s liquidity that moves markets.” (Emphasis added.)
Stan Druckenmiller
Let’s start today with a look back at the major world market indexes’ performance since October 2007 (the last bull market peak) and also the performance since March 2009 panic low. A tale of two different stories. The first was expensive, leveraged and featured a Fed raising rates. The second was relatively inexpensive and the beginning of unprecedented central bank liquidity. If you are curious, like me, it looks like this:
2007 Bull Market High to November 27, 2017:
- First place: India up 82.5% (cumulative gain over the period)
- Second place: S&P 500 Index up 65%
- Third place: Japan up 29%

Source: Advisor Perspectives
2009 Bear Market Low to November 27, 2017:
- First place: India up 313.3% (cumulative gain over the period)
- Second place: S&P 500 Index up 284.54%
- Third place: Japan up 217.5%
Source: Advisor Perspectives
Point is: your initial starting conditions matter. Yesterday, the Dow crossed 24,000 and the S&P 500 Index is above 2,650. Simply awesome. As you’ll see in the Trade Signals charts (link below), the trend for equities remains bullish…. risk-on. This despite the aged and overvalued nature of the current run. The “trend is your friend…” as the saying goes.
With that said, let’s keep in mind that investor behavior is fickle. On October 19, 1987, I was on a Merrill Lynch trip to Maui. Asleep. At 3:00 am, my hotel room phone rang and my assistant put one of my clients on the phone. The market crashed. It was pure panic. He was not alone. After fielding one emergency call after another, I was left in a state of disbelief. At 9:00 am, my manager called me demanding I get on the next plane home.
Fear ruled reason and everyone wanted out. 1998 and 1999 were different. That manic bull run made everyone a believer in all things tech. And that’s where the liquidity flowed. March 2000 set a record for the month with the greatest money flows into stocks. The market peaked that month and tech went on to gift the frenzied with a 75% decline. It bottomed in October 2002. A cool $1 million turned into just $250,000. The S&P 500 Index lost over 50%; however, most of the money was concentrated into tech stocks.
If you witnessed it first-hand, you know what I mean. Behavior in 2008-09 looked more like 1987 than 2002, yet fear is fear and people panic. I don’t think that will change.
If you are a younger advisor in the business, I encourage you to speak with a few old dogs. Perhaps the best single piece of advice I received came from the great Sir John Templeton. In 1985, he told the crowd of more than 250 wannabe great young brokers including me, “The secret to my success is I buy when everyone else is selling and I sell when everyone else is buying.” He said few will be able to do it. I hung on to his every word.
You can get information from book to head but true knowing comes from experience. No shortcuts. What I’m saying is investor fear behavior will be as extreme in the next dislocation as it was in 1987, 1991, 2002 and 2008-09. And greed no different than 1928, 1999, 2007 and may I dare say… today. More buyers than sellers and markets move higher. More sellers than buyers and markets move lower. To me, it feels like 1999 all over again.
From this old dog to the young advisors, here is my advice: help your client know the difference between speculator and investor. Either is OK but your client can’t have it both ways. If they’re an investor, broadly diversify your bets and make sure you have stop-loss triggers set in place. If they’re a speculator, concentrate to just a few big bets. But in both cases, seek growth opportunities but always in a way that allows you to maintain a high level of protection against bear markets.
If you have read On My Radar and follow Trade Signals each week, you know I continue to lean bullish. The trend is favorable and we likely go higher. But stay alert, disciplined and nimble.
In a chart, the emotional roller coaster looks like this:
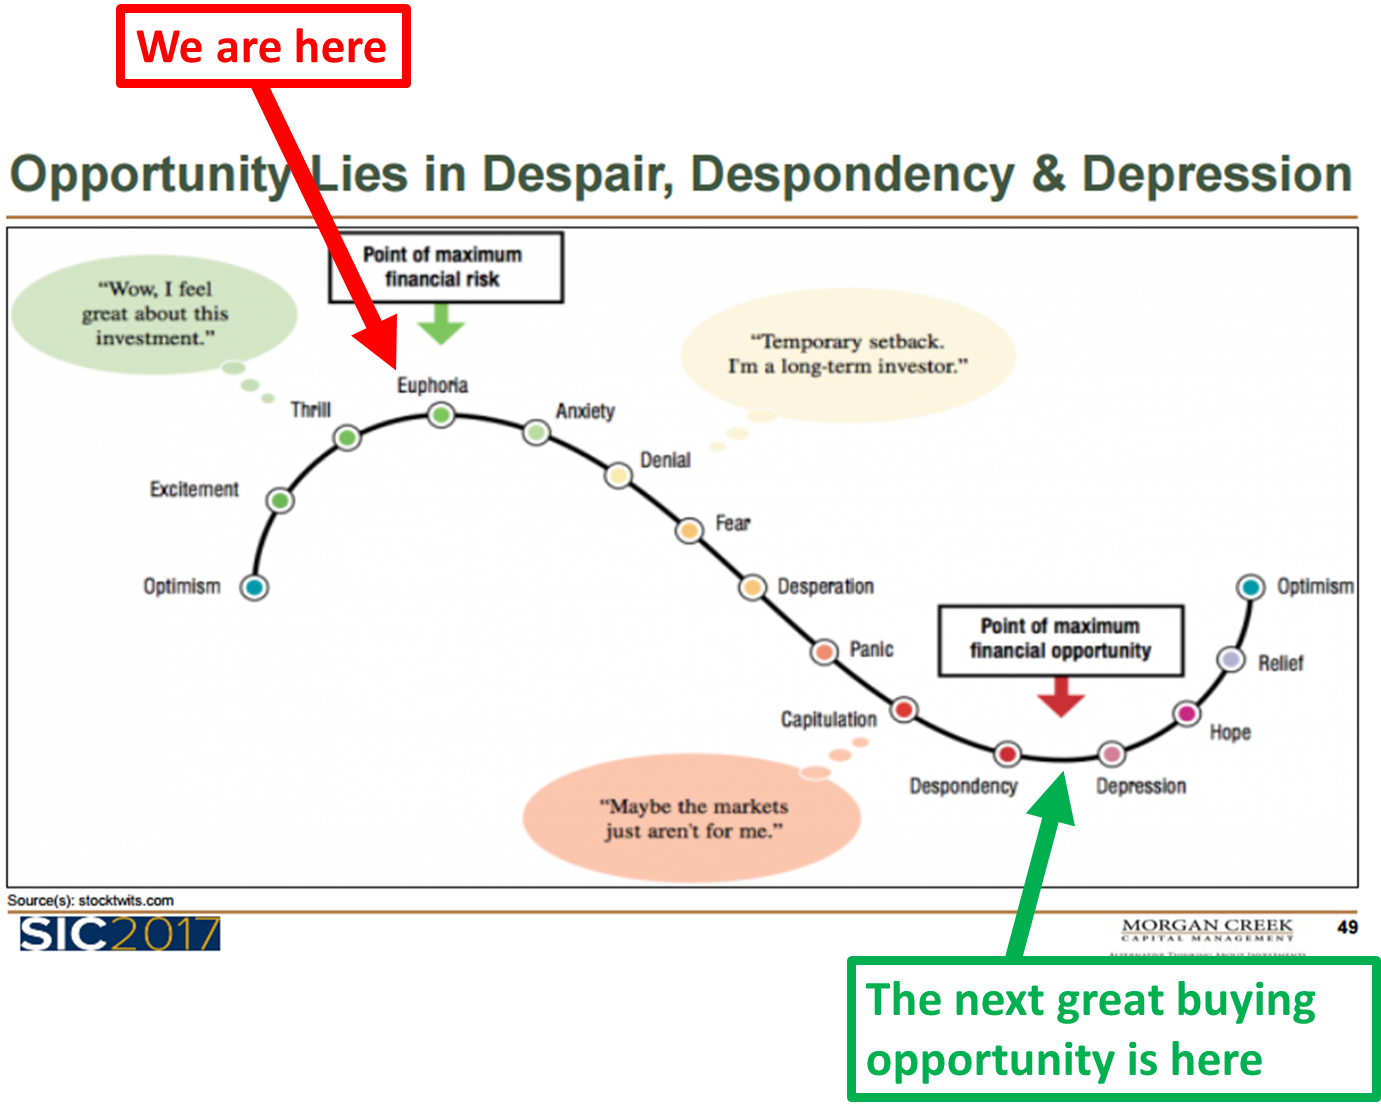
Source: Morgan Creek Capital Management; stocktwits.com
Play more defense now so you can play more offense later. Seek growth and protect. Be prepared to significantly overweight equities when we get to the green arrow. Everything cycles, we’ll get that opportunity. My best guess is within a year or two.
In late 2008, I wrote a piece called, “It’s So Bad It’s Good.” Readers thought I was nuts. In the next cycle, when we get near the green arrow, I envision a future piece called, “It’s So Bad It’s Great.” How will you know when is when? Keep a close eye on the recession watch charts (not shared today but I will post as odds increase) and the trend charts posted each week in Trade Signals. Let’s get to that opportunity in good shape.
Here’s the good news. The economy is solid, global growth is better and there is little sign of recession in the next six to nine months. Global liquidity remains mostly favorable though the Fed is reversing gears. So we’ll keep our eyes on what Stan said, “It is liquidity that moves markets.”
Grab a coffee and find your favorite chair. As you read on today, I share a few behavioral ideas with you. The charts below show how badly investors behave at market tops and bottoms. You’ll also find an outstanding video from Dr. John Hussman called, “Myths about tax cuts and truth about growth.” He, like many of us, is disgusted at what is coming out of Washington. An economist and investor’s view on how the tax proposals impact the economic machine. Listen to it while you’re exercising or taking a walk. Hint: If you are a large “C” corporation or small business manufacturer, you win the big prize. A big win for corporate lobbyists, a miss for most of the rest of us. We’ll know the full extent of the bill any moment. Assuming it passes.
Corporations will likely boost share buy backs, increase dividends and acquisitions. That’s good news for the market trend. However, it is small business that is the engine of our economy’s growth and this legislation will get us little guys just enough extra money to buy your kid a new Xbox. That’s it. A big miss. Oh, the bill will also increase our national debt by an estimated $1.5 trillion on top of the already unimaginable $20 trillion we owe. Explain that to your kids. Not such great fun after the Xbox fun wears off.
OK, you can see I’m a bit fired up. Tomorrow, Susan and I are heading to Mexico for a week. Our hope is to decompress, read and enjoy the sand and water. And maybe an IPA here and there. There will be no On My Radar post next week. Thanks for reading and do have a great weekend.
Follow me on Twitter @SBlumenthalCMG.
Included in this week’s On My Radar:
- Investor Behavior Signals
- Hussman – Myths about tax cuts and truth about growth
- Alan Simpson and Erskine Bowles: A Moment of Truth for Our Country’s Financial Future (November 29, 2017)
- Trade Signals – Party On Garth, Party On Wayne (Extreme Optimism)
- Personal Note – Didn’t Get the “W”
Investor Behavior Signals
“Most people in the market are looking for earnings and conventional measures. It’s liquidity that moves markets.”
– Stan Druckenmiller
I shared the next few charts at advisor conferences in St. Louis this week. A kind of what we can look for in terms of seeing opportunity. As you view the charts, keep in the back of your mind “green is good, red is bad.”
To give you a sense for what that looks like behaviorally, this next chart tells the story. The point I’m trying to make is that investors behave poorly. They sell when they should be buying and they buy when they should be selling.
Here is how you read the chart:
- Ned Davis Research (NDR) tracks the percentage of total household assets individuals have invested in stocks.
- Green is good, red is bad.
- Of course, investors own bonds, cash and other assets as well. But what I’m showing here is how much is allocated to stocks: when high, much capital has been used to bid prices up. There is less potential capital to invest in stocks to drive prices higher. When low, there is more potential buying power to drive prices higher.
- The best buying opportunities occurred when the percentage allocated to stocks was below the average over the last 66 years (1951-present). See green boxes and arrows.
- The worst buying opportunities were when the percentage of stock ownership is high. Investors are largely “all-in” – less fuel available to bid prices higher.
- Some of the decline from 2000 to 2002 was due to market loss, but much of it was due to investors selling at the wrong time. Same in 2008-09.
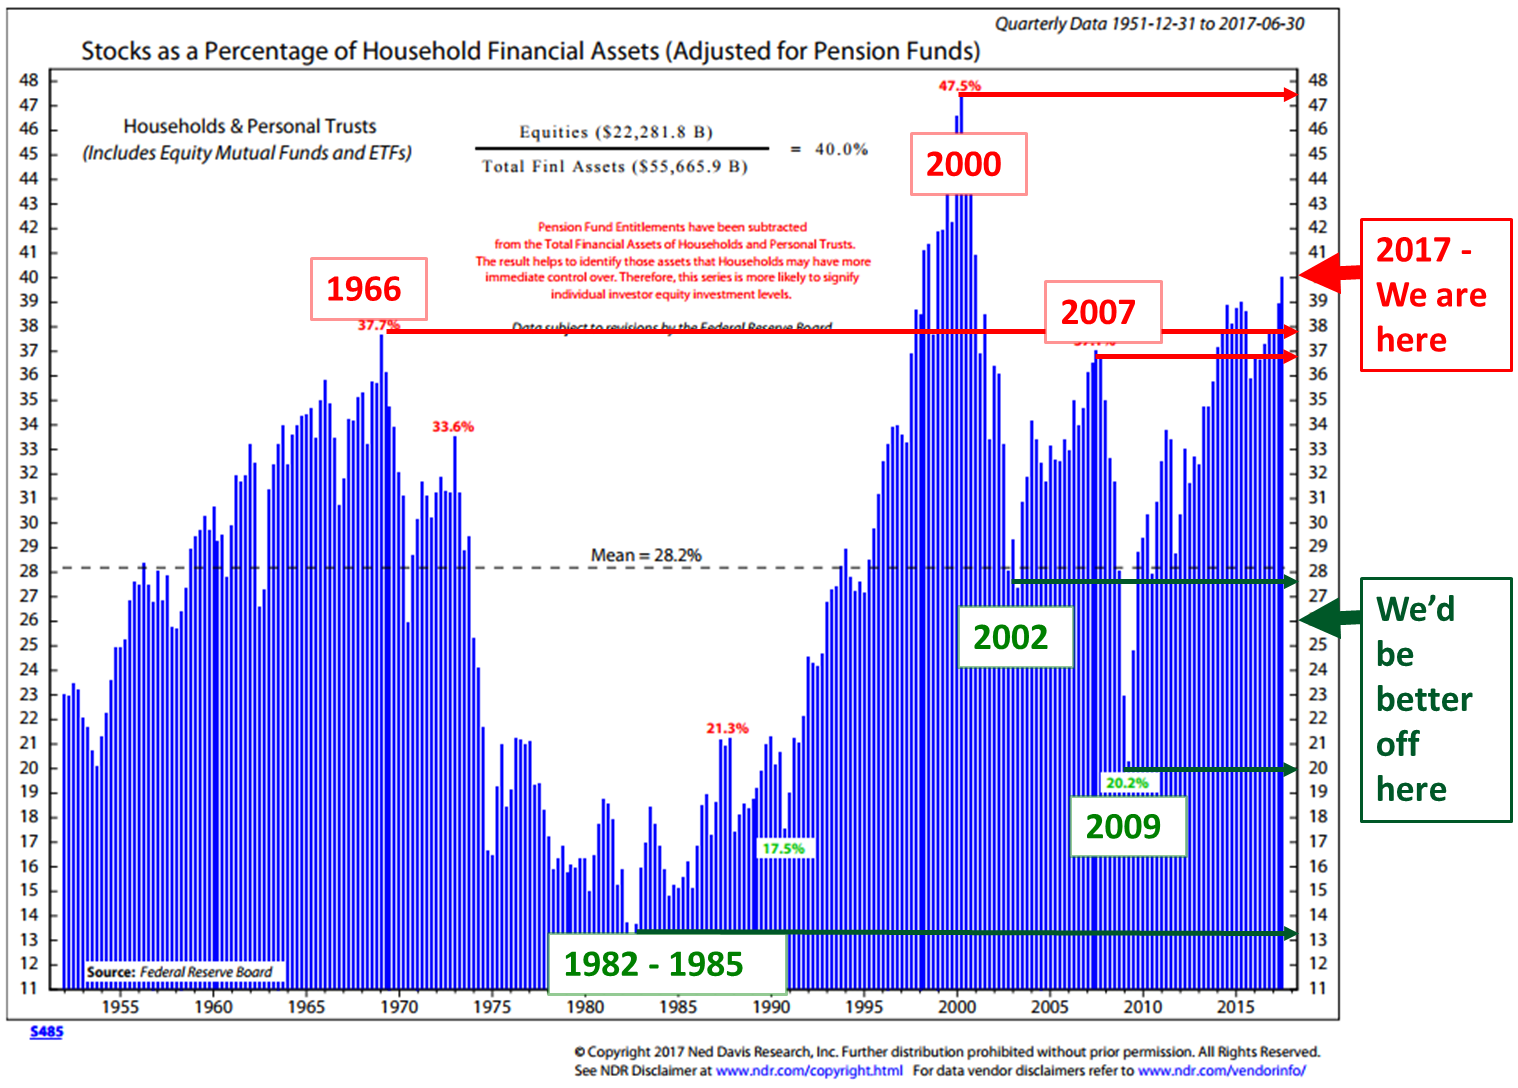
Source: Ned Davis Research
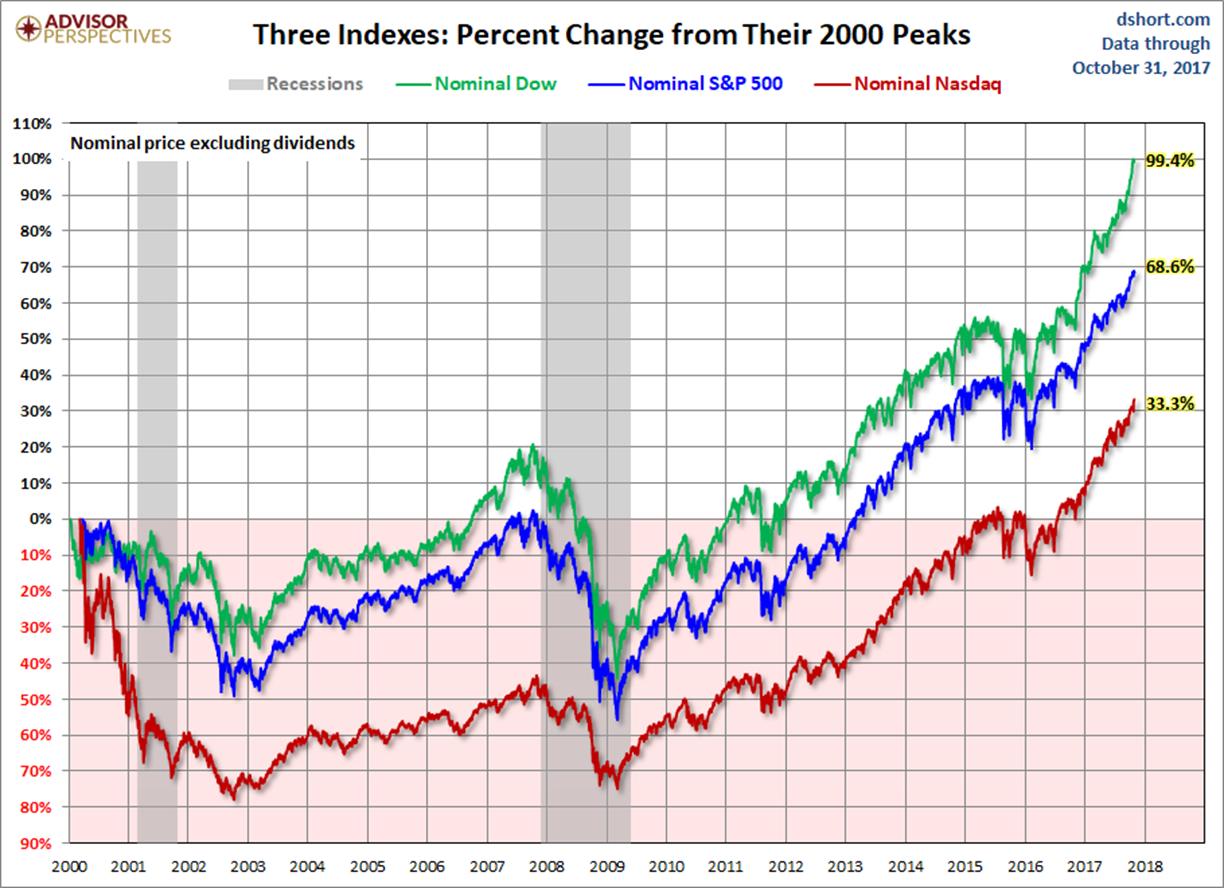
If we think about where we were in 2000, and then look at the returns from then to now (assuming an investor stayed invested that entire time, which we know from the above evidence many did not), we can see that the S&P 500 did not do so well.
Here is how to read the chart:
- First place: India
- Second place: China
- Third place: S&P 500 Index
Notable:
- S&P 500 gained a cumulative 78.8%. That works out to about 3.5% annualized for 17 years.
Source: dshort.com
My point is initial conditions matter. Also, the best opportunities come when valuations are attractive — not in the 97% percentile of most expensive. My point is the best opportunities come in despair, not euphoria.
Finally, consider the lost years of return.
Source: Advisor Perspectives
And if you factor inflation in, as we should, it looks like this:
I told the group that 75% of all the investable money will be in the hands of pre-retirees and retirees in two short years. We are all 17 years older than we were in 2000. Can that money afford even 10 years of flat returns? Certainly not if you need to live off your portfolio.
This next chart is one of my all-time favorites. It compares household equity percentage vs. subsequent rolling 10-year S & P 500 Index total return. Here is how you read the chart:
- The blue line tracks the percentage households have in stocks.
- When it is high, the idea is that there is less money available to buy more stocks and push prices higher. When low, there is plenty of money to buy stocks.
- More buyers than sellers, prices go up. More sellers than buyers, prices go down. As Stan said, “It’s liquidity that moves markets.”
- The black dotted line tracks the 10-year actual return of the S&P 500 Index. It stops in late 2007 because that is the last known 10-year annualized return number.
- Point to note is how closely the black line tracks the blue line. Not perfect but pretty darn good.
- I noted several periods in red and several periods in green. Red produced bad returns and green good returns. Meaning, when investors are aggressively allocated to stocks, returns are low (red arrows point to outcomes).
- Note the panic periods in 2002 and 2009. Green is good. Is it any wonder we are having mid-teens S&P 500 Index returns? That’s what we are looking for… that’s the opportunity that “buy when everyone is selling” creates.
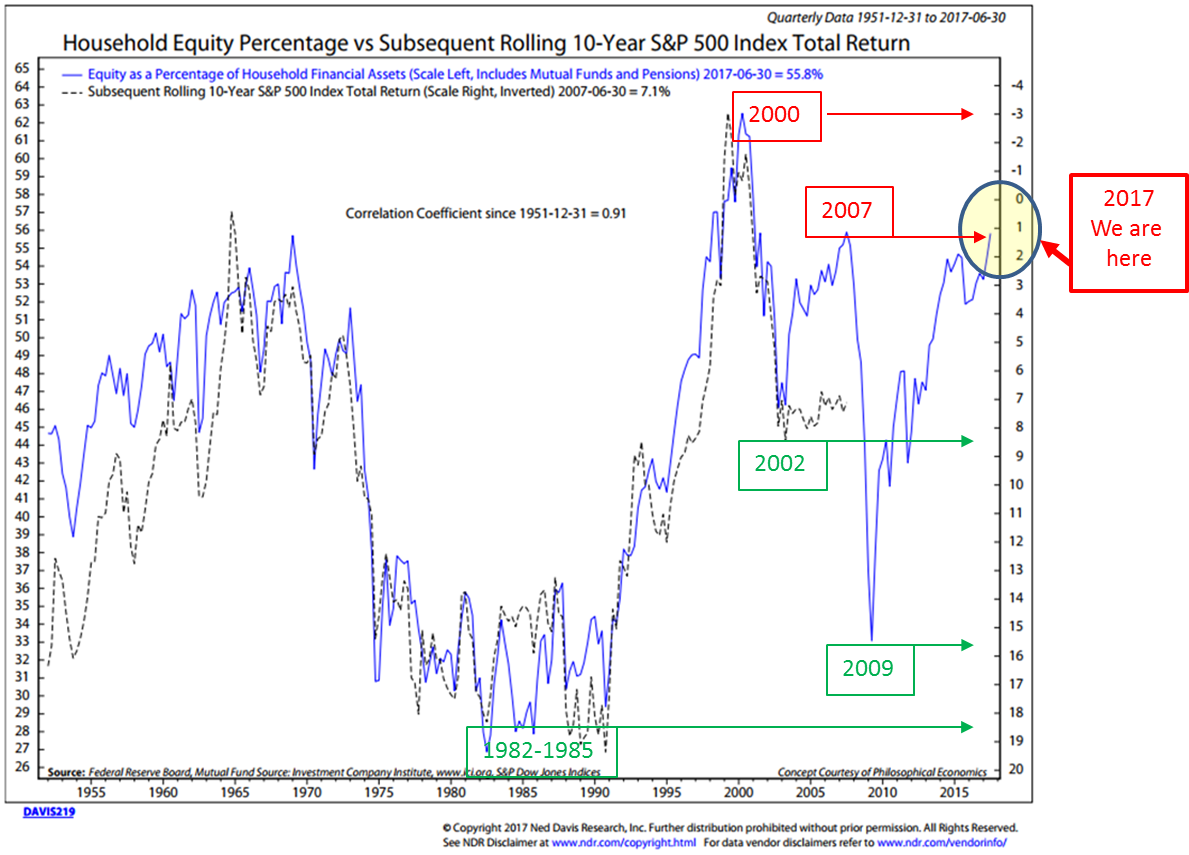
Source: Ned Davis Research
My two cents:
- If your client is a moderate investor, I continue to favor 30% to equities (allocated to strategies that allow you to take advantage of growth opportunities while maintaining a level of protection in down markets), 30% to fixed income (tactically managed due to today’s ultra-low yields) and 40% to liquid alternatives (diversify to ETF trading strategies and a small position in gold). The next major dislocation will drive valuations lower and return opportunities higher. Then, strategically increase and overweight equites. That opportunity likely presents in the next recession. Until then, participate and protect… more defense than offense.
- If your client is an aggressive investor, then allocate the majority of the portfolio to equities yet with a focus on growth while maintaining a process for downside protection.
Important note: Not a recommendation for you to buy or sell any security. For information purposes only. If you are an individual investor, please consult your advisor about needs, goals, time horizon and risk tolerances.
We have no idea as to what the next few years will look like return-wise. 2017 has surprised to the upside. All good. But I do believe we can get pretty zeroed in on what the coming 7- and 10-year returns look like. As I shared a few weeks ago in On My Radar: “Global Macro Outlook & Probable 7-, 10- and 12-Year Equity Market Returns,” we are looking at -2% to plus 2% and not the 10% investors are expecting.
Hussman – Myths about tax cuts and truth about growth
Alan Simpson and Erskine Bowles: A Moment of Truth for Our Country’s Financial Future
Senator Alan Simpson and Erskine Bowles, board members of the Committee for a Responsible Federal Budget and former co-chairs of the National Commission on Fiscal Responsibility and Reform, published the following Op-Ed in the Washington Post:
Seven years and almost $7 trillion in new debt ago, we released a bipartisan package of tax and spending reforms as co-chairs of the National Commission on Fiscal Responsibility and Reform. At the time, we declared that the era of deficit denial was over. Sadly, the debate on tax reform in the House and Senate suggests deficit denial is not only back but also stronger than ever. Yet the fundamental fiscal challenges we identified in 2010 remain.
We said then and believe now that Congress and the president should come together on a balanced plan that reduces deficits and promotes growth. We called for fundamental tax reform that would cut tax breaks to reduce tax rates and — rather than add to the debt — generate new revenue.
We called for a more internationally competitive corporate tax code, but also pressed for continued investment in education, infrastructure and high-value-added research so that the United States can compete effectively in the knowledge-based global economy. We also said tax reform should raise $1 trillion in revenue for debt reduction and be paired with spending cuts and reforms of entitlement programs to bring spending growth under control.
Unfortunately, the tax plan currently under discussion in Congress ignores nearly all the hard choices we proposed — incorporating only the “goodies.” It reads as if it were developed for a country whose debt problems have been solved, when in reality debt is the highest it has ever been other than around World War II.
When this tax reform discussion started, House Speaker Paul D. Ryan (R-Wis.) and Senate Majority Leader Mitch McConnell (R-Ky.) called for revenue-neutral tax reform. While ultimately more revenue is needed, deficit neutrality is likely the best that can be expected in the current political environment.
Yet Congress abandoned even this minimum standard of fiscal responsibility and decided to proceed with a $1.5 trillion tax cut instead. With debt already twice as high as its historical average, financing tax cuts with even more borrowing is reckless.
And the actual bills in the House and Senate are even worse than the $1.5 trillion sticker price — because both include about a half-trillion dollars in phony savings from artificial “sunsets” and other gimmicks. With interest, that means these tax cuts could add $2.2 trillion to the debt.
When we released our fiscal commission report, we were worried about keeping deficits below $500 billion per year and debt below 70 percent of gross domestic product. But if the tax cuts in the current bill are adopted, deficits would exceed $1 trillion by 2020 and debt would exceed 99 percent of GDP by 2027.
Economic growth isn’t going to wash away this debt. Real tax reform can provide a boost to the economy, but higher debt works in the opposite direction. According to the dynamic models from the Wharton School at the University of Pennsylvania, the House and Senate tax bills will increase the growth rate by only 0.03 to 0.09 percentage points per year — and that growth will cut their costs by only one-eighth or less.
This country cannot afford another debt-busting tax cut. Luckily, there is another way. The current tax code will give away roughly $18 trillion of tax breaks over the next decade. Our commission called for repealing most of them to pay for lower rates and reduce deficits, adding back only the most-needed ones and only in the most efficient way. By comparison, the latest Senate bill cuts only $3.7 trillion of tax breaks. Most of the largest tax expenditures — including the tax-free treatment of employer-sponsored health care, the mortgage-interest deduction and tax-free bonds — are virtually untouched.
This country critically needs tax reform to improve economic growth. But higher levels of debt will crowd out productive investment, slow wage growth and ultimately undo any gains from reform.
Bringing our debt under control will require reforming and slowing the growth of health and retirement entitlements. Enacting debt-financed tax cuts will make that harder, both substantively and politically. Substantively, because by worsening the debt situation, it will entail more painful changes; politically, because Democrats will be less likely to agree to entitlement reforms if Republicans won’t allow for sufficient revenue.
Many members of Congress have privately told us they would be willing to make the tough votes for ambitious tax and spending reforms as part of a substantive fiscal plan but only if members on the other side jump in the canoe at the same time.
This is the moment of truth for lawmakers who share our concern about our nation’s fiscal future. They can return to the era of deficit denial, or they can stand up for future generations.
Trade Signals — Party On Garth, Party On Wayne (Extreme Optimism)
S&P 500 Index — 2,627 (11-29-2017)
Notable this week:
The overall trend evidence remains bullish for equities. Sentiment, as you’ll see in the charts this week, has reached extreme optimism. That reading suggests near-term caution; but trend trumps sentiment and I’d score the weight of evidence as moderately bullish. My advice: Continue to seek growth while following a process that allows you to maintain a level of protection in down markets.
Click here for the latest Trade Signals.
Important note: Not a recommendation for you to buy or sell any security. For information purposes only. Please talk with your advisor about needs, goals, time horizon and risk tolerances.
Personal Note — Didn’t Get the “W”
Last week I mentioned the Stonewall Annual Black Friday golf tournament. Brianna, Matthew, me and Stevie Oh shot a respectable 7 under and finished just out of the money (well, pro shop credits). The winners were 11 under. We finished fourth. But what a super fun time it was.
I spent several days in St. Louis this week presenting at an advisor’s client event. Time well spent. It really is nice to connect with people and I particularly enjoyed connecting with On My Radar reader and Philadelphia Eagles fan, Gary. Gary’s father, like mine, was from Philadelphia and we share mostly emotional agony due to far too many heartbreaks over the Eagles for so many years. But it is in the blood and boy, do we have hope this year.
Next week finds me in Mexico with Susan. Just the two of us and I can’t wait. There will be no OMR next week… perhaps a picture from the beach with chilled margaritas in hand. Or knowing Susan, an IPA.
But I will be taking a break from vacation on December 6 to do a one-hour webinar hosted by VanEck and ETF Trends to review how the Ned Davis Research CMG U.S. Large Cap Long/Flat Index works. If you are an advisor, you can register here.
If you are an individual investor, please send me an email and I’ll notify you when we’ve finalized a date.
Have a great weekend.
With kind regards,
Steve
Stephen B. Blumenthal
Executive Chairman & CIO
CMG Capital Management Group, Inc.


