HomeBusinessIndividual Houses: 754,000 In 1988 vs 657,000 Today
Advertisement Disclosure: When you purchase through our sponsored links, we may earn a commission from our partners. By using this website you agree to our T&Cs.
Individual Houses: 754,000 In 1988 vs 657,000 Today
“Davidson” submits:
754,000 April 1988 vs. 657,000 June 2015?
There are ~100,000 fewer individuals building houses today than there were in April 1988 yet the US population at 320 million in 2015 is 31% larger than the 244.5 million in April 1988. This says volumes about the current state of our economy, what has happened to home lending, what our perceptions are about income equality, US Real GDP and the next few years of SP500 price performance.
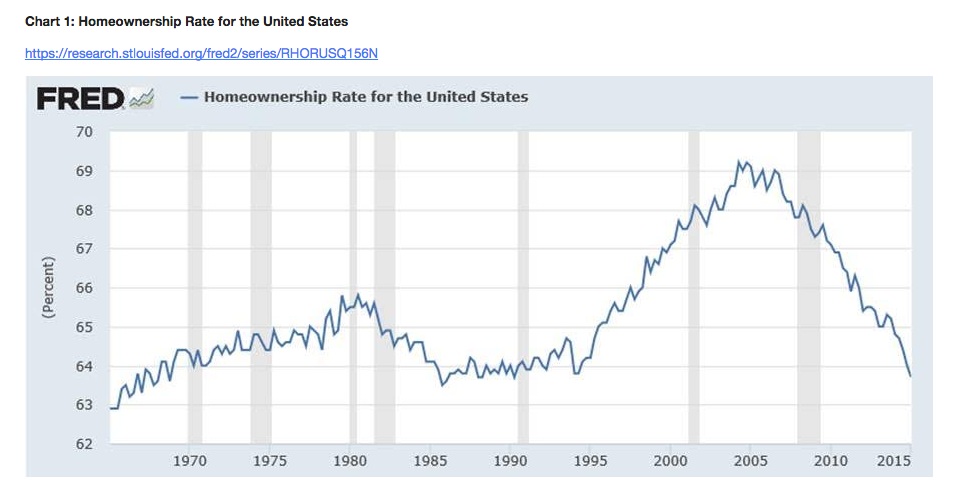
We went through a crazy housing period after the passage of the Community Reinvestment Act in 1995. Government pushed lending institutions into lending to sub-prime individuals in the quest to provide everyone one access to housing ownership. Government has a long history of periodically embracing a largess mentality of ‘a chicken in every pot!’. The homeownership level rose from 63-64% where it had averaged since 1965 to just over 69% at its peak-see Chart 1: Homeownership Rate for the United States. The correction beginning in 2005 through today is simply a normalization of homeownership and a response to stringent lending regulation put in place in response to the sub-prime lending financial collapse. What has also been typical has been government and the media response that ‘The Banks did it!!’ when looking for reasons for the craziness since 1995. Just as government loosened lending standards in the late 1990s, it has in turn tightened them and blamed Wall Street for the excess even in the face of multiple studies which clearly define this as a period of government manipulation of the financial system to achieve socially motivated ends. The ‘ends justifies the means’ until it blows-up in your face and then you blame someone else. Buy the way the ‘Great Inflation” of the 1970s was blamed on ‘individuals not spending enough’ to keep union members employed as inflationary and not on the ‘Great Society’. Bizarre!
houses
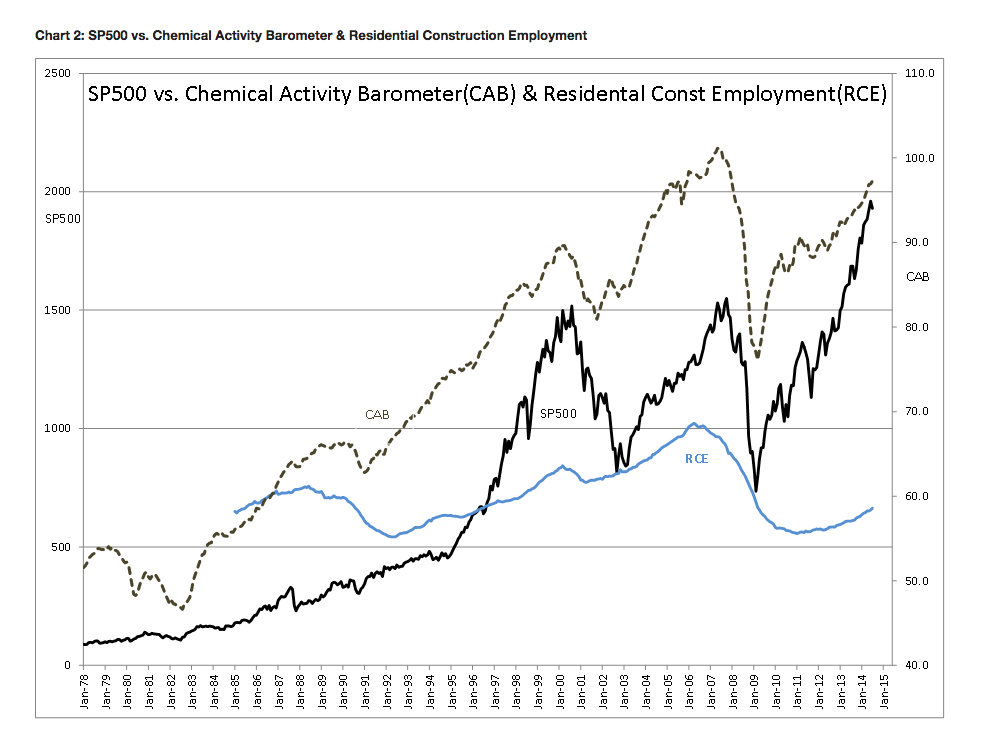
Lending standards which have been described as significantly tighter than what we have witnessed historically have caused a significant portion of the US economy to recover far more slowly than in previous periods. This portion is namely the financial and housing sectors. The Mortgage Credit Availability Index(MCAI) sits at 122 today when it can be argued that 300-400 is where it should be-(contact me for the latest report on MCAI). Specifically we can see that housing construction is employing ~100,000 fewer individuals than what we saw in April 1988-see Chart 2: SP500 ($SPY) vs. Chemical Activity Barometer & Residential Construction Employment. One can argue that we have brought greater efficiencies to home building just as we have elsewhere in the economy, but the counter-argument is we also have a population which is 31% larger and one would expect the average need for housing to not have changed much. Clearly, the Chemical Activity Barometer(CAB-shown) and Light Vehicle Sales (not shown but at record levels over 17mil SAAR) show us that the US economy is performing well in other sectors. The single laggards have been financial and housing sectors. Housing and general construction are important entry points for unskilled workers for the US economy. Construction is where many learn basic skills with which they can earn a middleclass wage. It is in the construction sector where we lag in employment and wage growth. The Fed has kept mortgage-lending rates low and impeded the housing and employment needs of our economy. I believe that markets are likely to force mtg rates higher and that a historical housing cycle should play out. My expectation is that Residential Construction Employment levels should rise to over 1mil before this economic cycle peaks-unless of course the Fed acts in ways it has not acted in the past.
houses
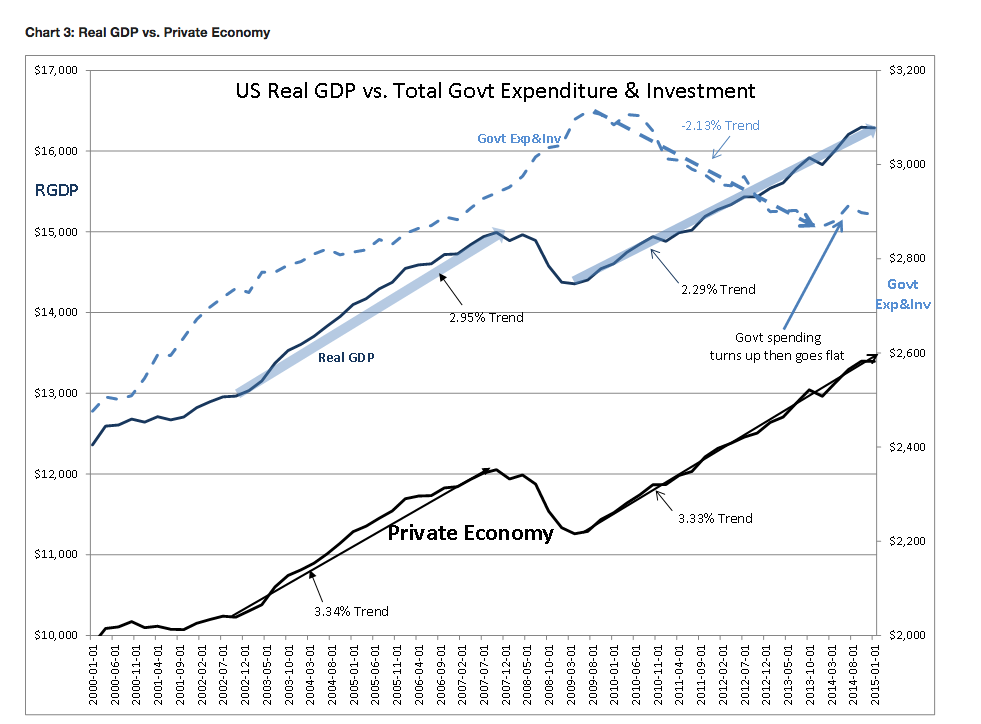
Chart 3: Real GDP vs. Private Economy shows the US Real GDP broken down into components of the Private Economy and the portion attributed to Government Spending. These are Real(inflation adjusted) numbers. Our Real GDP is growing at 2.29% compared to 2.95% in the 2002-2007 recovery. Many have decried this as slow economic growth. But, subtracting the impact of Government Expediture&Investment give us the Private Economy which has a 3.33% Trend vs. the 2002-2007 3.34% Trend. The underperformance of US Real GDP is not from the Private Economy but comes directly from slowing US Government spending. What this tells us is that in spite of the drop in Government spending and the underperformance of our financial and housing sectors, the Private Economy is still performing well.
To repeat: In spite of the drop in Government spending and the underperformance of our financial and housing sectors, the Private Economy is still performing well!
Every economy has multiple moving parts with governments trying to guide policy towards socially acceptable ends. In the final analysis it is individuals who make the ultimate decisions to improve their standards of living, to buy homes and to provide for their families. It is my expectation that individual demand for housing should cause mtg rates to rise and that the housing cycle should continue as financial institutions find it more profitable. This activity will add to future economic expansion. Mtg lending is like multiple shots of vitamin B-12 to any economy. Mtg lending lets individuals spend today a portion of earnings they will not have till 20yrs in the future. My expectation is for higher equity markets as mtg lending expands.
I continue to recommend LgCap Equities Domestic and International as the better asset classes as well as a holding in NatResources. Contact me for details.
At ValueWalk, we’re committed to providing accurate, research-backed information. Our editors go above and beyond to ensure our content is trustworthy and transparent.
Todd Sullivan is a Massachusetts-based value investor and a General Partner in Rand Strategic Partners. He looks for investments he believes are selling for a discount to their intrinsic value given their current situation and future prospects. He holds them until that value is realized or the fundamentals change in a way that no longer support his thesis. His blog features his various ideas and commentary and he updates readers on their progress in a timely fashion. His commentary has been seen in the online versions of the Wall St. Journal, New York Times, CNN Money, Business Week, Crain’s NY,…
Todd Sullivan is a Massachusetts-based value investor and a General Partner in Rand Strategic Partners. He looks for investments he believes are selling for a discount to their intrinsic value given their current situation and future prospects. He holds them until that value is realized or the fundamentals change in a way that no longer support his thesis. His blog features his various ideas and commentary and he updates readers on their progress in a timely fashion. His commentary has been seen in the online versions of the Wall St. Journal, New York Times, CNN Money, Business Week, Crain’s NY,…
Also, the 3 sectors that Wall Street analysts are most bullish about. The usual suspects dominated in 2025 as both the Communication Services and Information Technology sectors helped boost the...