
Summary
Home builders are cyclical companies. As such they should be screened based on their performance over the Housing Starts cycle. But Housing Starts cycles differ in duration and peak-to-trough magnitude.
One way to screen for such companies is to estimate the expected ROE and Margin of Safety. This takes into account the probabilities and values of the metrics over the pessimistic and optimistic cycles.
Q2 2022 hedge fund letters, conferences and more
At the same time, there is no long-term growth in the average annual Housing Starts. As such the Margin of Safety should be based on the Earnings Power Value over the cycle.
Screening the top 5 home builders based on the above, I identified Pulte Group Inc as the best.
Housing Starts
The US Housing Starts in July 2022 were reported to be 8.1 % below the July 2021 rate. The debate then is whether this confirms the downtrend in the current Housing Starts or whether this is just volatility. In other words, the uptrend in the Housing Starts that began in 2010/11 is still intact.
You can imagine the impact of investing in home builders. If the uptrend is still intact, you would opine that most of the home builders are currently cheap. But if you believe it is the start of the downtrend, you may think twice about investing in them.
I think that the debate misses the point. It does not matter where we are in the Housing Starts cycle.
This is a cyclical sector and the fortunes of home builders are tied to the Housing Start cycle. Look at the 2007 to 2021 correlation between the Housing Starts and the revenue of the top 5 home builders as illustrated in Table 1. The correlations are well over 85 %.
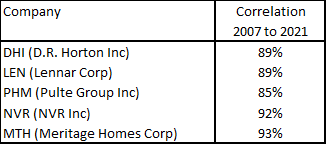
Table 1: Correlation
Note: The top 5 were based on the Construction Dive article on the top 10 in 2021. No 5 was Taylor Morrison where I could not get the data going back to 2007. As such, I replaced it with MTH which was ranked No 6.
The key to analyzing cyclical companies is not to worry about where they are in the cycle, but to look at their performance over the cycle.
“…the biggest problem we face in valuing (cyclical) companies… is that the earnings and cash flows reported in the most recent year are a function of where we are in the cycle, and extrapolating those numbers into the future can result in serious mis-valuations…trying to forecast the next cycle is not only futile but dangerous and that it is far better to normalize earnings and cash flows across the cycle.” Damodaran
But there are 2 characteristics of the US Housing Starts that should be considered when valuing home builders. Referring to Chart 1:
- There does not seem to be any long-term growth.
- The trough of the current cycle is exceptionally lower compared to the previous troughs
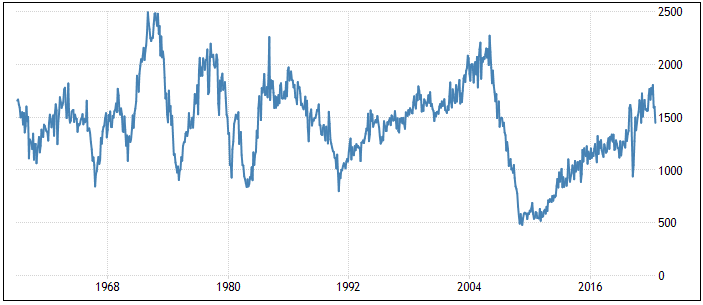
Chart 1: Housing Starts Cycle
Source: Tradingeconomic.com
No-Growth Pattern
When you compare the pattern in Chart 1 with those in Chart 2, you can see that the Housing Starts pattern is more similar to that shown in Blue in Chart 2. This is the no-growth cyclical pattern. The cyclical pattern with long-term growth is shown in Green in Chart 2.
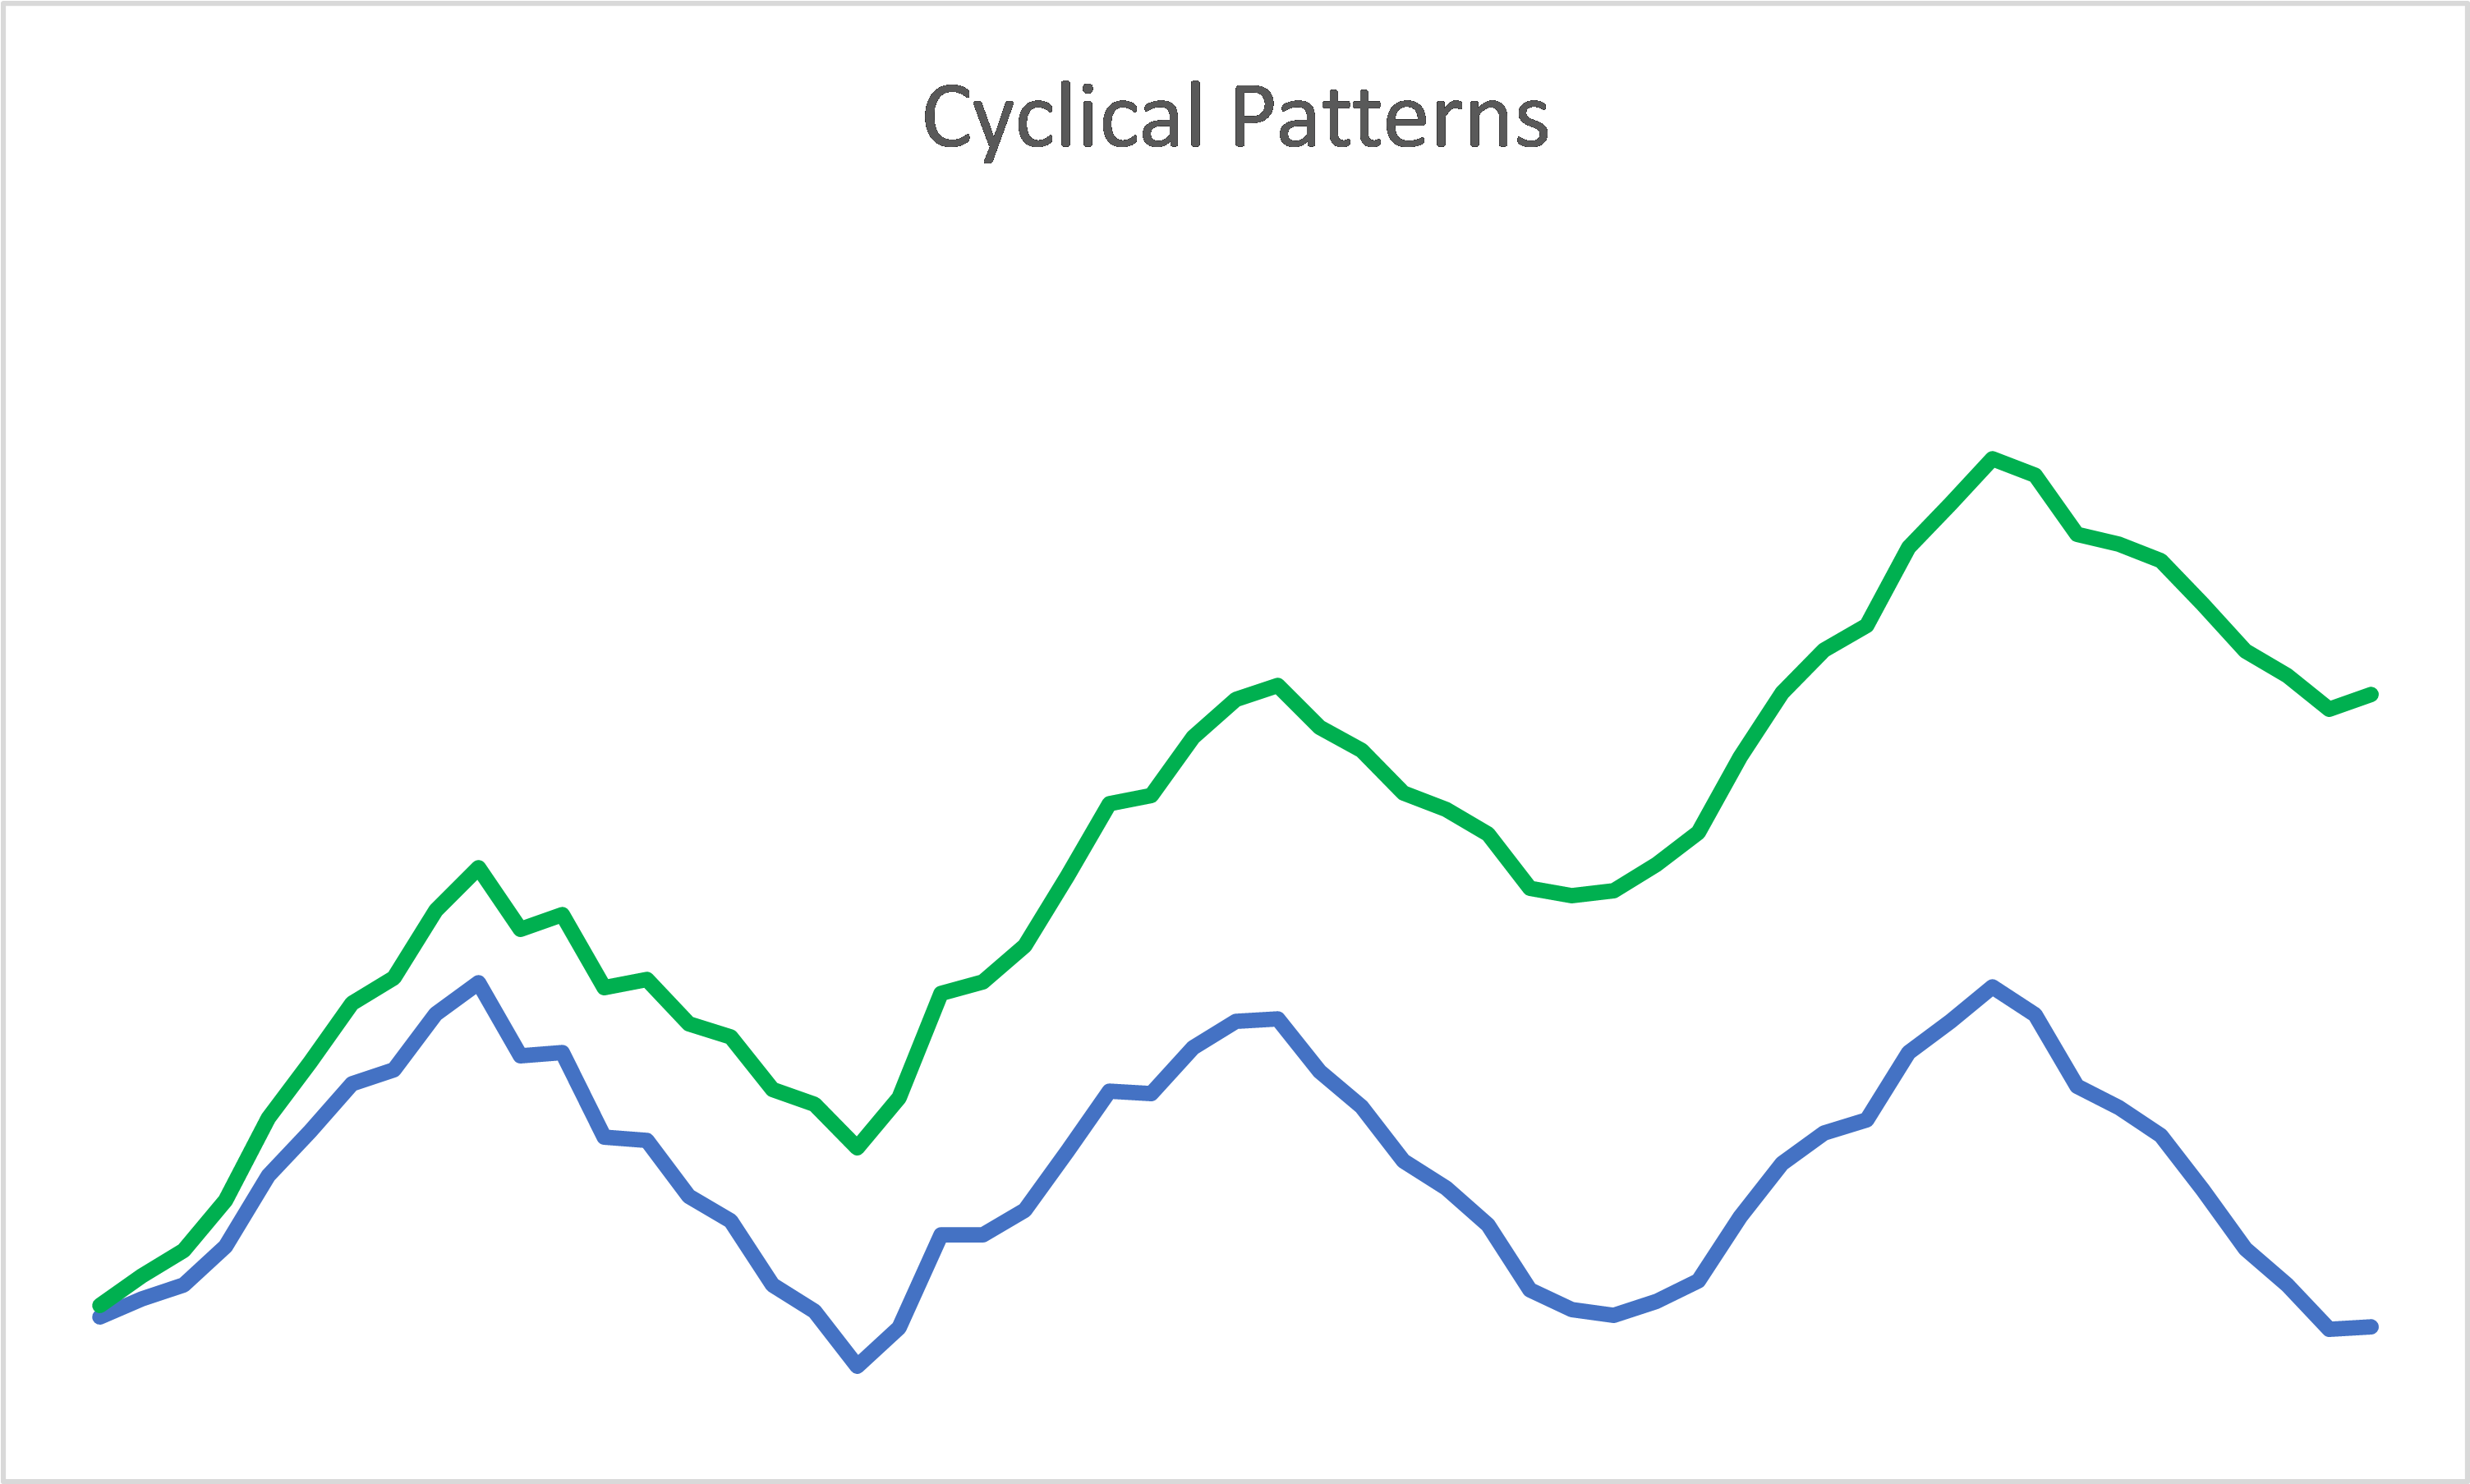
Chart 2: Types of Cyclical Patterns
Source: Author
The implications of the no-growth characteristic are then:
- The long-term average annual Housing Starts is about 1.5 million units. In valuing home builders, we should be looking at their normalized revenue based on 1.5 million units.
- If there does not appear to be any growth, focusing on Earnings Power Value (EPV) makes more sense.
Different Cycle Depth And Duration
Each Housing Starts cycle’s duration and the range (peak to trough) are not the same. As shown in Chart 1:
- The 2007 to 2021 cycle is 14 years long and the peak to trough is about 1.8 million units.
- The 1972 to 1977 cycle is 5 years long with a peak to trough of about 1.6 million units.
The performance of a company over a cycle would vary depending on the duration and the peak to trough values.
- During the downtrend part of a cycle, there could be impairment of assets. A longer duration could make this worse.
- Gross profit margins and SGA margins would probably be different during the downtrend compared to the uptrend.
The challenge then is how do you normalize the performance over the cycle if there is no consistent cycle pattern? One way is to compute the expected scenario based on the probability and performance of a pessimistic scenario and an optimistic one.
- The conservative view is to take the values over the 2007 to 2021 cycle.
- The optimistic view is to peg the normalized values to the year when the Housing Starts was at the long-term average of 1.5 million units. This is about the 2019 and 2020 performances.
Normalized Screens
I used two metrics to screen for the companies – the normalized ROE and the normalized margin of safety.
For the conservative scenario, I normalized the metrics based on the average 2007 to 2021 annual values. For the optimistic scenario, the normalized metrics were based on the average of the 2019 and 2020 values.
To illustrate the results of such screens, I compared the performance of the top 5 home builders as illustrated in Tables 3 and 4.
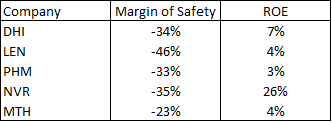
Table 2: Conservative Screen
Notes: The Margins of Safety were obtained by comparing the market prices on 2 Sep 2022 with the respective EPV.
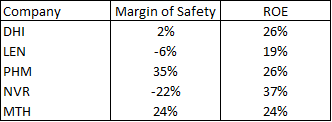
Table 3: Optimistic Screen
As can be seen, there is no Margin of Safety based on the conservative scenario. Based on the optimistic scenario, DHI, PHM and MTH passed the screen in terms of both positive ROE and Margins of Safety.
These are extreme views. It is possible to assign some probabilities to each scenario and then compute the expected ROE and Margins of Safety.
One way of estimating the probabilities is to look at the historical performance as per Chart 1. Out of the 8 cycles, there was only one where the trough reached 0.5 million units. On such a basis, I estimated the probability of the conservative scenario to be 0.125 (ie 1/8) and the optimistic case to be 0.875. Based on these, I obtained the expected ROE and the expected Margin of Safety.
I have plotted the results as shown in Chart 3. In the chart
- The vertical axis represents the ROE
- The horizontal axis represents the Margin of Safety. I defined the Margin of Safety = Price / EPV.
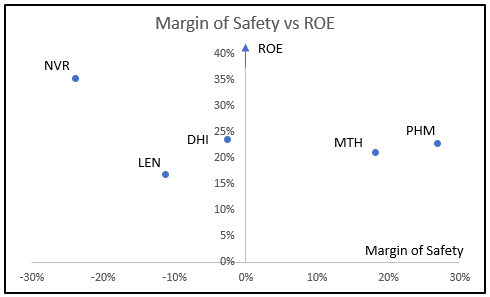
Chart 3: Screen based on expected values over the cycle
The results of the screen suggest that you should focus your fundamental analysis on Pulte.
If you based the analysis on the LTM values, you have all 5 companies having good Margins of Safety and ROE as shown in Table 4. This is the danger warned by Damodaran.
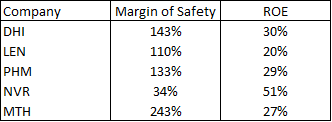
Table 4: LTM Screen
Valuation
My Margins of Safety are dependent on how I obtained the EPV. I valued the homebuilders based on the single-stage Free Cash Flow to the Firm model where:
Firm Value = FCFF / WACC
EPV = Firm Value + Non-Operating Assets – Minority Interests – Debt
FCFF = Free Cash Flow to the Firm = EBIT X (1 – t)
EBIT = Gross Profit – SGA
Gross Profit = Revenue X Gross Profit margin
SGA = Revenue X SGA margin
The respective Gross Profit margins and SGA margins are as per Table 5.
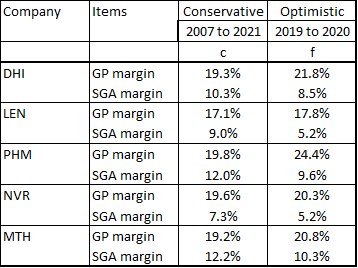
Table 5: GP margins and SGA margins assumptions
t = nominal tax rate assumed to be 21 %
Revenue = Respective long-term revenue. This is assumed to be the 2021 Revenue X (1.5 / 1.7) where 1.5 represents the long-term average Housing Starts and 1.7 is the Housing Starts for 2021.
WACC = derived as per Damodaran approach. I assumed a risk-free rate of 2.52 % based on the 2007 to 2021 average 10 years treasury rates. Unlevered Beta = 1.59. Equity risk premium = 4.24 %
The Non-Operating Assets, Minority Interest, and Debt are assumed to be the 2021 values.
Conclusion
Home builders are cyclical companies. When analyzing them, the advice is that you should look at the performance over the cycle. The challenge is that the duration and the peak-to-trough magnitude of the cycles are not consistent.
To get around this problem, I estimated the expected ROE and Margin of Safety. The expected values were based on the probabilities and values of the pessimistic and optimistic metrics over the cycle.
Screening the top 5 home builders on such a basis, I identified Pulte Group as the one for further analysis. I hasten to add that this is not an investment thesis. There is still further analysis – financial position, potential impairments, and management. Still, the results suggest that it is a good candidate for further analysis.

Editor’s Note: The article is from H.C. Eu who blogs at Investing for Value. He is a self-taught value investor and has been investing in Bursa Malaysia and SGX companies for more than 15 years. He has recently published a value investing book “Do you really want to master value investing” on Amazon. This is going to be available for free download on 13 Sept 2022, Pacific Date Time.


