During a bear market, stocks tend to rise sharply and lose steam, putter around and then collapse back down. A buy-the-dip strategy works in a bull market, but it can be detrimental in a bear market as the collapses progressively take the stock to lower lows. Ultimately, you can end up a bagholder as the fundamentals get worse and the stock remains depressed as it falls out of favor with Wall Street.
Q2 2022 hedge fund letters, conferences and more
Find A Qualified Financial Advisor
Finding a qualified financial advisor doesn’t have to be hard. SmartAsset’s free tool matches you with up to 3 fiduciary financial advisors in your area in 5 minutes. Each advisor has been vetted by SmartAsset and is held to a fiduciary standard to act in your best interests. If you’re ready to be matched with local advisors that can help you achieve your financial goals, get started now.
In other words, many stocks just shouldn’t be averaged into with a long-term horizon, so it helps to be selective. We will cover which stocks are worth dollar-cost averaging into in a future article. For now, we will assume you have the stocks in mind that you wish to have exposure in. The best position in a bear market is cash because it enables you to wait for stocks to fall to your desired price levels. In this case, the best offense in a bear market is a good defense (and patience). It’s also important to have a list of stocks in hand so you aren’t limited to just focusing and wishing on a single stock and possible getting FOMO’ed into chasing a bounce because you didn’t get shares on a pullback.
Plan Ahead
The difference between throwing good money after bad and strategically scaling into a position is in the planning. Don’t mistake desperately adding to a losing position in a falling knife as dollar-cost-averaging. A game plan must be created prior to taking a position.
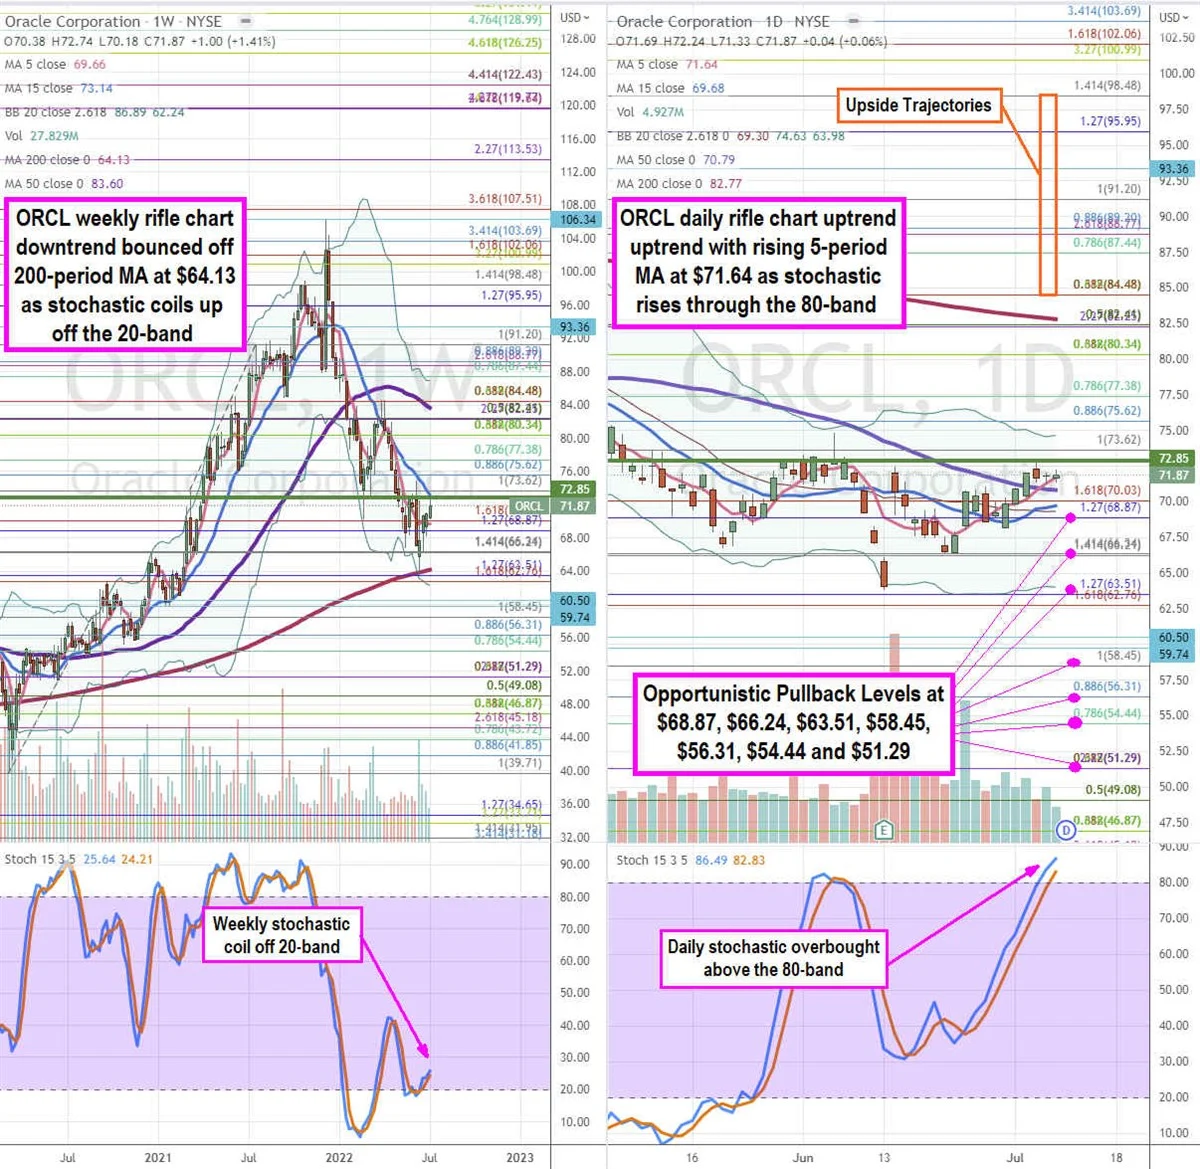
Determine Opportunistic Pullback Levels
Using the rifle charts on the weekly and daily chart enable us to gauge a complete view on the price action from mid to longer time horizon holding periods for Oracle Corporation (NYSE:ORCL) shares. The weekly rifle chart is used to gauge a wider time frame which encompasses a wider price range levels as well. The weekly chart originally bottomed out near the $63.53 Fibonacci (fib) level before staging a rally up through the weekly 5-period moving average (MA) resistance at $69.66 towards the 15-period MA at $73.14. The weekly 200-period MA support is rising at $64.13. The weekly lower Bollinger Bands (BBs) represent the bottom of the trading range at $62.24. The weekly stochastic fell below the 20-band oversold level and bounced to peak out at the 40-band before turning back down to bounce off the 20-band level. Stocks bouncing up through or off the 20-band at good levels to scale into on pullbacks. The weekly market structure low (MSL) buy triggers on a $72.85 breakout. The daily rifle chart is used to actually spots the pullback levels to consider dollar cost averaging into. The daily rifle chart bounced to form an uptrend with a rising 5-period MA support at $71.64 followed by the 15-period MA at $69.68. The weekly 50-period MA sits at $70.79 and 200-period MA at $82.77. The daily stochastic indicates an overbought condition as it has risen through the 80-band. It’s prudent to wait for the daily stochastic to turn back down and patiently wait for pullbacks so as not to chase an overbought stock. The daily BBs are still compressed. This is the time to spot opportunistic pullback levels at the $68.87 fib, $66.24 fib, $63.51 fib, $58.45 fib, $56.31 fib, $54.44 fib, and the $51.29 fib level. Upside trajectories range from the $84.48 fib level up towards the $98.48 fib level.
Dollar Cost Average Scaling Methods
Once you’ve determined the price levels to average in at, it’s time to be patient. For ORCL, there are seven pullback level spots from $68.87 down to $51.29. Determine what your final position size will be and then allocate to each price level. For example, if you decide to add 200 shares per level, your end up 1,400 share position would have an average price of $59.87 or value of $83,818. This would mean the stock would have to bounce 14.8% from $51 to get to breakeven. Another way to dollar cost average is the pyramid format where you start with light size positions and gradually add heavier size as the stock falls further. You can opt to take lower pullback levels or a size ratio at each level or opt just for entry at the overlapping fib levels. Using a simple pyramid scaling on a six level dollar cost averaging composed off 100 shares for the initial entry at the $66.24 fib, then 200 share for the next two entries and 300 shares for the next three entries results in an average price of $56.90 or $79,660, which requires only a 10.9% rise to get to breakeven from the $51 level. Also, if you decide by dollar value as opposed to stock price, then this method enables you to add an extra $4,158 of stock compared to the first method. The calculations can be done quickly using a stock price conversion calculator that quickly determines the average price.
Don’t Average Into These Types Of Stocks
Remember, not all stocks are worth dollar cost averaging into. Be selective at filtering for stocks that have strong tailwinds or secular trends. Avoid averaging into meme or momentum stocks that have rocketed triple digits in a matter of days. Try to stick to widely traded top tier stocks that are included in the major benchmark indexes like the S&P 500.
Article by Jea Yu, MarketBeat


