Gold stocks declined by about 31.5%, which perfectly fits my previous analogy to 2008. If history is to rhyme, we can expect a corrective upswing soon.
2008, Is That You Again?
History tends to repeat itself. Not to the letter, but in general. The reason is that while economic circumstances change and technology advances, the decisions to buy and sell are still mostly based on two key emotions: fear and greed. They don’t change, and once similar things happen, people’s emotions emerge in similar ways, thus making specific historical events repeat themselves to a certain extent.
For example, right now, gold stocks are declining similarly to how they did in 2008 and in 2012-2013.
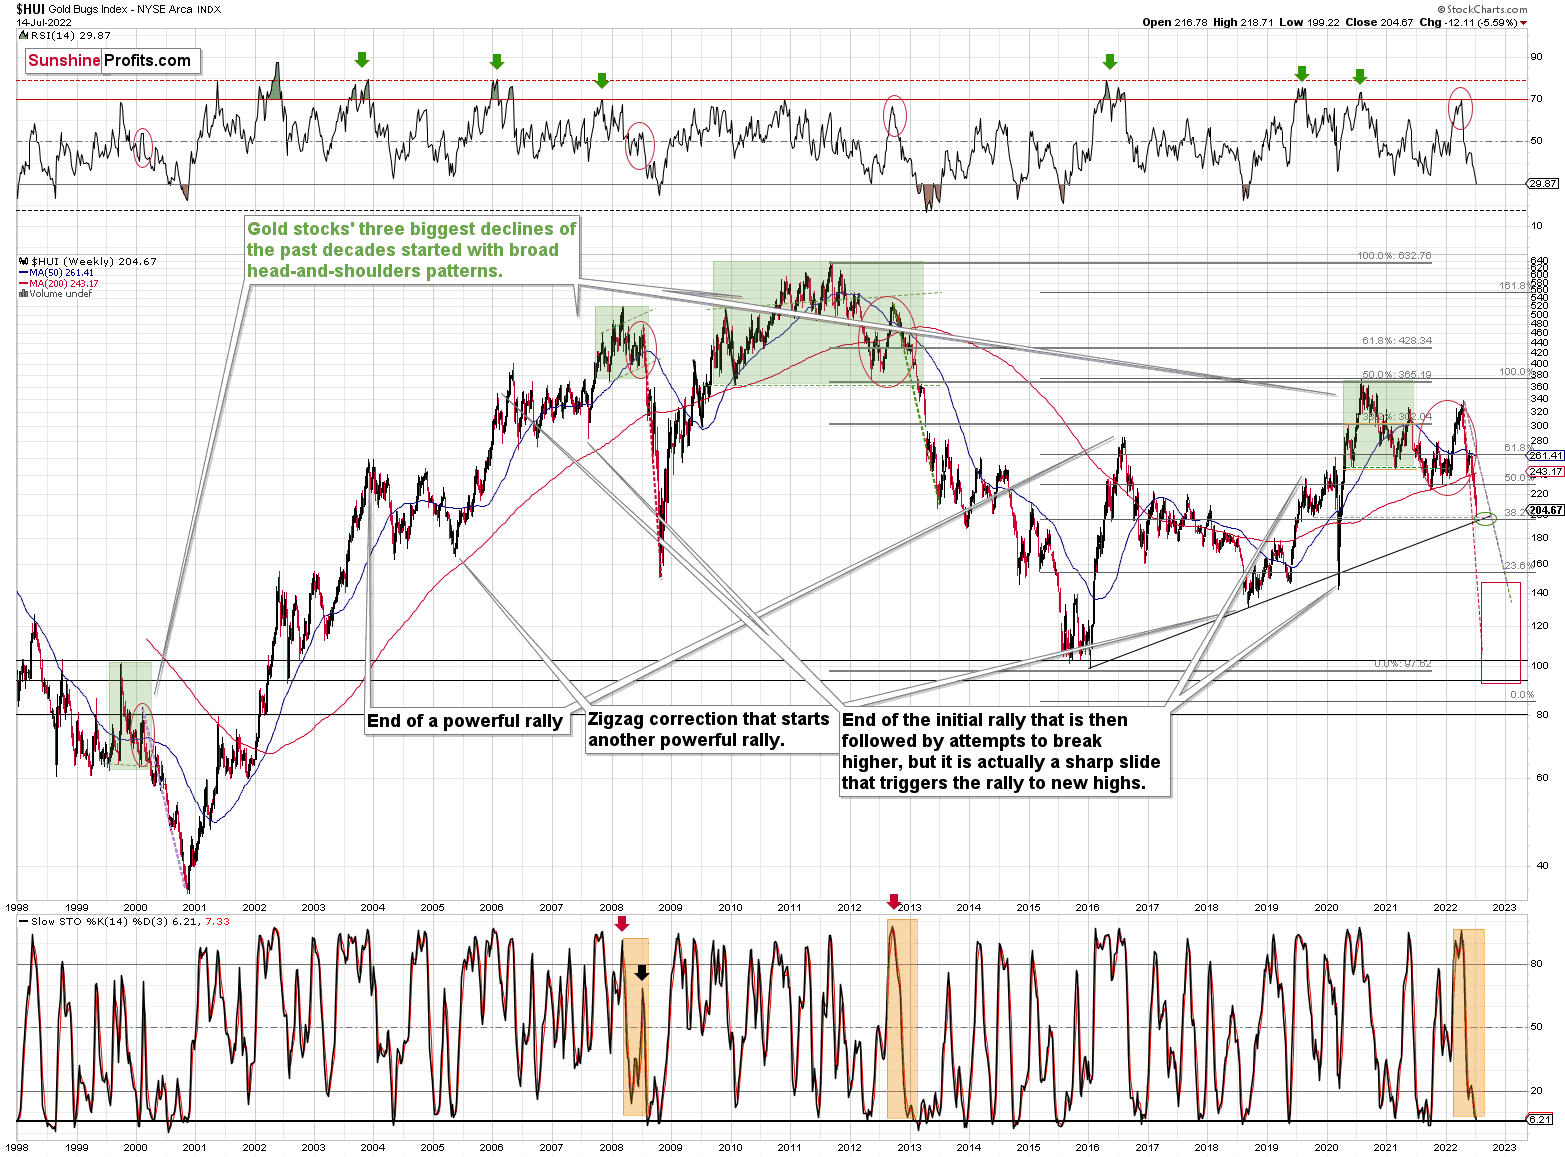
The Russian invasion triggered a rally, which was already more than erased, and if it wasn’t for it, the self-similarity would be very clear (note the head-and-shoulders patterns marked with green). Since the latter happened, it’s not as clear, but it seems that it’s still present. At least that’s what the pace of the current decline suggests.
I used a red dashed line to represent the 2008 decline, and I copied it to the current situation. They are very similar. We even saw a corrective upswing from more or less the 200-week moving average (red line), just like what happened in 2008.
We saw a breakdown to new short-term lows, which means that the volatile part of the slide is likely already underway.
Moreover, last week, I commented on the above chart in the following way:
On a short-term basis, we see a short-term (only) downside target of around 200. That’s about 10% below yesterday’s (Thursday’s) closing price. There are several reasons for it:
- It’s a round number, and those tend to be more important psychologically than other numbers.
- That’s where we have the rising medium-term support line based on the 2016 and 2018 lows. The temporary move below this line triggered a massive rally in 2020.
- That’s where we have the 61.8% Fibonacci retracement level based on the entire 2016-2020 rally.
Not Every Fall Must Be Bearish
The 200 target was just reached yesterday. In fact, what happened was even more bullish than that – we saw a tiny move below this level – to 199.22, and then a comeback and a close visibly above 200 – at 204.67.
Ultimately, the HUI Index moved lower yesterday, and many will view this simple fact as something bearish. However, doing that would be a “rookie mistake” – after all, major bottoms can only form after declines, right? My point is that a move higher or lower is not bullish or bearish by itself. It’s the context that adds meaning to a certain price move. In this case, a major support level was reached while the HUI Index was already heavily oversold.
In fact, based on the RSI, the gold stocks are even more oversold than they were at their 2020 bottom!
Consequently, a rebound here is a likely short-term outcome.
All right, let’s zoom in and see how mining stocks declined in 2008.
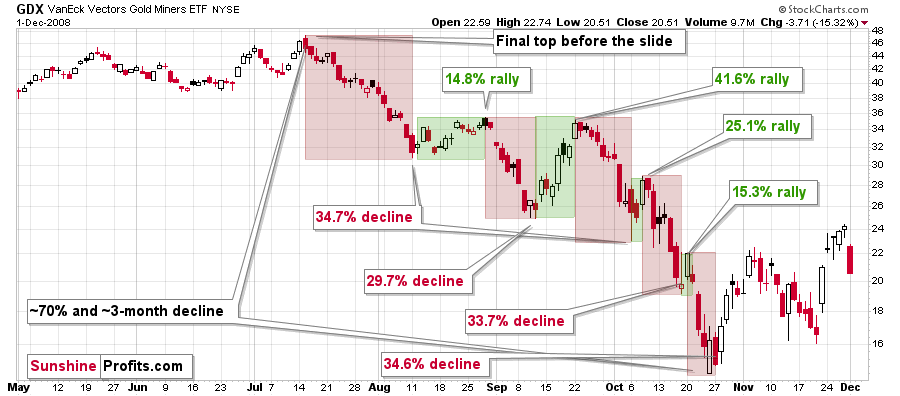
Back then, the GDXJ ETF was not yet trading, so I’m using the GDX ETF as a short-term proxy here.
The decline took about 3 months, and it erased about 70% of the miners’ value. The biggest part of the decline happened in the final month, though.
However, the really interesting thing about that decline – that might also be very useful this time – is that there were five very short-term declines that took the GDX about 30% lower.
I marked those declines with red rectangles. After that, a corrective upswing started. During those corrective upswings, the GDX rallied by 14.8-41.6%. The biggest corrective upswing (where GDX rallied by 41.6%) was triggered by a huge rally in gold, and since I don’t expect to see anything similar this year, it could be the case that this correction size is an outlier. Not paying attention to the outlier, we get corrections of between 14.8% and 25.1%.
The interesting thing was that each corrective upswing was shorter (faster) than the preceding one.
The first one took 12 trading days. The second one took seven trading days. The third one took 2 trading days, and the fourth and final one took just 1 trading day.
Fast forward to the current situation. Let’s take a look at the GDXJ ETF.
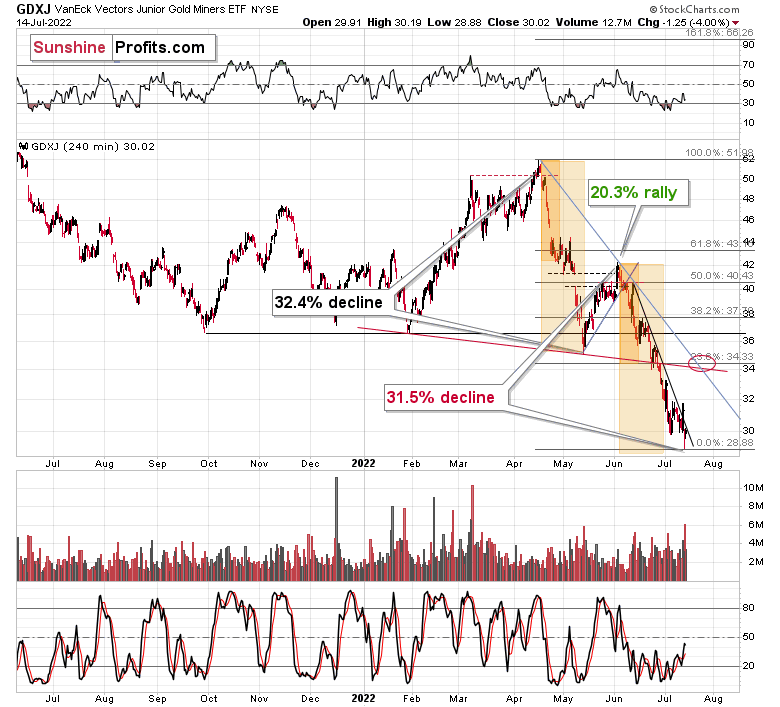
The GDXJ ETF declined by 32.4% and then corrected – it rallied by about 20.3%. The corrective upswing took 14 trading days.
Now, it has declined by about 31.5%.
The above is in perfect tune with the previous patterns seen in the GDX during the 2008 slide.
I previously wrote the following:
What does it tell us? It indicates that history can be rhymed, and while it will not be identical, we should pay attention to the indicators that worked in 2008. The next corrective upswing (a notable one, that is) might start when the GDXJ ETF declines by about 29-35% from its recent top. To clarify, I don’t claim that the above technique would be able to detect all corrective upswings, or that I aim to trade all of them. For instance, in my view, it was a good idea to enter a long position on May 12 and switch to a short position on May 26, but I wasn’t aiming to catch the intraday moves.
Again, yesterday’s bottom formed about 31.5% below the recent high, which perfectly fits my previous estimate and the analogy to 2008.
Based on how long the corrective upswings took in 2008 and how long the recent one took, the upcoming corrective upswing is likely to take between 5 and 10 trading days. If the bottom formed yesterday, which seems likely as the GDXJ ETF is already up by over 1% in today’s London trading, then we can expect the next local top to form within 1-2 weeks. In other words, it seems that the corrective upswing is likely to end in the next part of July – probably in its final week.
Back in 2008, the counter-trend rallies varied greatly in their magnitude, but please keep in mind that back then, the decline was very much news-based – Lehman Brothers’ collapse, etc. This time, the decline is more measured, so declines and corrections are more measured as well.
While back in 2008, during the first correction, the GDX gained only 14.8% and during the second one it gained a sizable 41.6%, this time the first rally provided a measured 20.3% increase. If the upcoming correction is also measured, then the GDXJ might also rally by about 20%.
If yesterday’s intraday low was indeed the final bottom, then the starting price would be $28.88 and a price 20% higher is ~$34.66, which fits my target area for the upcoming correction.
Naturally, the above is up-to-date only at the moment of writing these words (Friday, July 15th), but I’ll keep my subscribers informed with regard to any changes.
Thank you for reading our free analysis today. Please note that the above is just a small fraction of today’s all-encompassing Gold & Silver Trading Alert. The latter includes multiple premium details such as the targets for gold and mining stocks that could be reached in the next few weeks. If you’d like to read those premium details, we have good news for you. As soon as you sign up for our free gold newsletter, you’ll get a free 7-day no-obligation trial access to our premium Gold & Silver Trading Alerts. It’s really free – sign up today.
Przemyslaw Radomski, CFA
Founder, Editor-in-chief
Sunshine Profits: Effective Investment through Diligence & Care
All essays, research and information found above represent analyses and opinions of Przemyslaw Radomski, CFA and Sunshine Profits’ associates only. As such, it may prove wrong and be subject to change without notice. Opinions and analyses are based on data available to authors of respective essays at the time of writing. Although the information provided above is based on careful research and sources that are deemed to be accurate, Przemyslaw Radomski, CFA and his associates do not guarantee the accuracy or thoroughness of the data or information reported. The opinions published above are neither an offer nor a recommendation to purchase or sell any securities. Mr. Radomski is not a Registered Securities Advisor. By reading Przemyslaw Radomski’s, CFA reports you fully agree that he will not be held responsible or liable for any decisions you make regarding any information provided in these reports. Investing, trading and speculation in any financial markets may involve high risk of loss. Przemyslaw Radomski, CFA, Sunshine Profits’ employees and affiliates as well as members of their families may have a short or long position in any securities, including those mentioned in any of the reports or essays, and may make additional purchases and/or sales of those securities without notice.


