
ETFGI reports that assets invested in Smart Beta ETFs and ETPs listed globally increased by 32.3% during 2017 to reach a new high of US$658.35 Bn
[REITs]LONDON — January 26, 2018 — ETFGI, a leading independent research and consultancy firm on trends in the global ETF/ETP ecosystem, reported today that assets invested in Smart Beta ETFs and ETPs listed globally increased by 32.3% during 2017 to reach a new high of US$658.35 Bn at the end of December. (All dollar values in USD unless otherwise noted.)
Highlights
- Assets invested in Smart Beta ETFs/ETPs listed globally increased by a record $ 160.61 billion during the year, to reach a new high of $658.35 billion
- Year-to-date, through end of December 2017, Smart Beta ETFs and ETPs listed globally saw net inflows of $71.75 Bn.
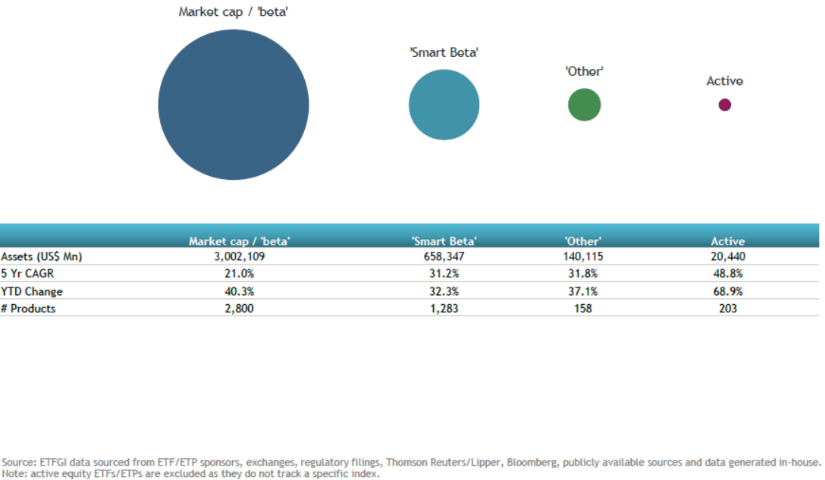
- Assets in market cap ETFs increased by 40.3% in 2017 which is significantly more than the 32.3% increase in Smart Beta assets.
According to ETFGI’s December 2017 Global Smart Beta ETF and ETP industry insights report, an annual paid-for research subscription service, assets invested in Smart Beta ETFs/ETPs listed globally grew by a record US$160.61 Bn during 2017, almost double the previous record of US$87.41 Bn set in 2016. The increase of 32.3%, from US$497.74 Bn at the end of 2016, also represents the greatest growth in assets since 2009 when markets recovered following the 2008 financial crisis.
This record was achieved on the eve of another milestone for the ETF industry: the 25th anniversary of the listing of the first ETF in the US, the venerable SPDR S&P 500 ETF (SPY US), on 22nd January 1993. At the end of 2017, SPY on its own accounted for assets of US$271.39 Bn.
December 2017 marked the 23rd consecutive month of net inflows into Smart Beta ETFs/ETPs listed globally, with US$8.45 Bn gathered during the month. During 2017 Smart Beta ETFs/ETPs listed globally saw net inflows of US$71.75 Bn; 33.2% more than net inflows for 2016.
The majority of these flows can be attributed to the top 20 Smart Beta ETFs by net new assets, which collectively gathered US$30.92 Bn during 2017. The Vanguard Value ETF (VTV US) on its own accounted for net inflows of US$5.08 Bn.
Top 20 Smart Beta ETFs by net new assets: Global
| Name | Ticker | Assets (US$ Mn) Dec-17 |
ADV (US$ Mn) Dec-17 |
NNA (US$ Mn) YTD 2017 |
| Vanguard Value ETF | VTV US | 36,532 | 128.6 | 5,075 |
| iShares MSCI USA Momentum Factor ETF | MTUM US | 5,427 | 39.6 | 3,341 |
| Vanguard Growth ETF | VUG US | 31,403 | 89.7 | 2,179 |
| iShares MSCI USA Minimum Volatility ETF | USMV US | 15,076 | 55.1 | 1,539 |
| Vanguard Small-Cap Value ETF | VBR US | 12,639 | 35.5 | 1,463 |
| Schwab Fundamental US Large Company Index ETF | FNDX US | 3,761 | 9.5 | 1,462 |
| Schwab Fundamental International Large Company Index ETF | FNDF US | 3,463 | 9.9 | 1,365 |
| iShares MSCI EAFE Minimum Volatility ETF | EFAV US | 8,364 | 40.0 | 1,327 |
| iShares Core Dividend Growth ETF | DGRO US | 2,653 | 13.7 | 1,284 |
| iShares MSCI EAFE Value ETF | EFV US | 6,401 | 31.7 | 1,278 |
| Schwab US Dividend Equity ETF | SCHD US | 7,131 | 29.4 | 1,223 |
| iShares Automation& Robotics UCITS ETF | RBTX LN | 1,484 | 18.0 | 1,171 |
| Guggenheim S&P 500 Equal Weight ETF | RSP US | 14,993 | 43.8 | 1,115 |
| iShares International Select Dividend ETF | IDV US | 4,888 | 14.8 | 1,108 |
| Schwab Fundamental US Small Company Index ETF | FNDA US | 2,672 | 6.9 | 1,096 |
| iShares Edge MSCI Europe Value Factor UCITS ETF | IEFV LN | 1,762 | 5.4 | 1,040 |
| iShares Edge MSCI USA Value Factor UCITS ETF | IUVL LN | 1,320 | 4.9 | 985 |
| Vanguard Mid-Cap Value ETF | VOE US | 8,349 | 23.0 | 962 |
| First Trust Value Line Dividend Index Fund | FVD US | 4,195 | 10.2 | 953 |
| First Trust Nasdaq Bank ETF | FTXO US | 1,212 | 1.9 | 953 |
Similarly, the top 10 ETPs by net new assets collectively gathered US$661.56 Mn year-to-date during 2017.
Top 10 Smart Beta ETPs by net new assets: Global
| Name | Ticker | Assets (US$ Mn) Dec-17 |
ADV (US$ Mn) Dec-17 |
NNA (US$ Mn) YTD 2017 |
| FI Enhanced Global High Yield ETN | FIHD US | 1,134 | 3.3 | 357 |
| Psagot Sal Europe WisdomTree Export Oriented (NTR) ILS (40a) | PSGT304 IT | 113 | 0.3 | 101 |
| TACHLIT S&P AERO & DEFENSE | TCSP145 IT | 53 | 0.2 | 44 |
| Barclays ETN+ Shiller CAPE ETN | CAPE US | 95 | 0.3 | 39 |
| Psagot Sal Japan WisdomTree (NTR) ILS (40a) | PSGT306 IT | 233 | 0.4 | 25 |
| ETRACS Monthly Pay 2xLeveraged U.S. Small Cap High Dividend ETN | SMHD US | 44 | 0.5 | 21 |
| Harel Sal S&P 500 Low Volatility | HRSPL82 IT | 79 | 0.1 | 20 |
| NEXT NOTES Japan Equity High Beta Select 30 Net Total Return ETN | 2068 JP | 23 | 0.1 | 19 |
| NEXT NOTES Japan Equity Low Beta Select 50 Net Total Return ETN | 2069 JP | 21 | 0.2 | 19 |
| NEXT NOTES AI Companies 70 Net Total Return ETN | 2067 JP | 32 | 0.9 | 18 |
Value Factor ETFs/ETPs listed globally saw net inflows of US$2.63 Bn in December, growing net inflows for 2017 to US$16.66 Bn. Multi Factor ETFs and ETPs gathered net inflows of US$1.41 Bn in December, bringing net inflows for 2017 to US$12.85 Bn.
To conclude, investors have tended to invest in lower cost and Value Factor ETFs in 2017 with the Vanguard Value ETF (VTV US) accumulating net inflows of US$1.40 Bn and a TER of 6bp.
Please contact [email protected] if you would like to discuss the cost to subscribe to any of ETFGI’s research or consulting services.


