
With investors discrediting fundamentals to follow the FED’s instruction, it seems everything relies now on a few people’s say-so.
Q1 2021 hedge fund letters, conferences and more
It’s a Bird, It’s a Plane, It’s the FED
With Jerome Powell, Chairman of the U.S. Federal Reserve (FED), donning his cape like Superman and his monetary crew akin to The Avengers, investors’ faith in the FED was on full display on Jun. 10. Case in point: with the headline Consumer Price Index (CPI) surging by 4.93% year-over-year (YoY) – the highest YoY percentage increase since 2008 – the bond, stock and currency markets barely flinched.
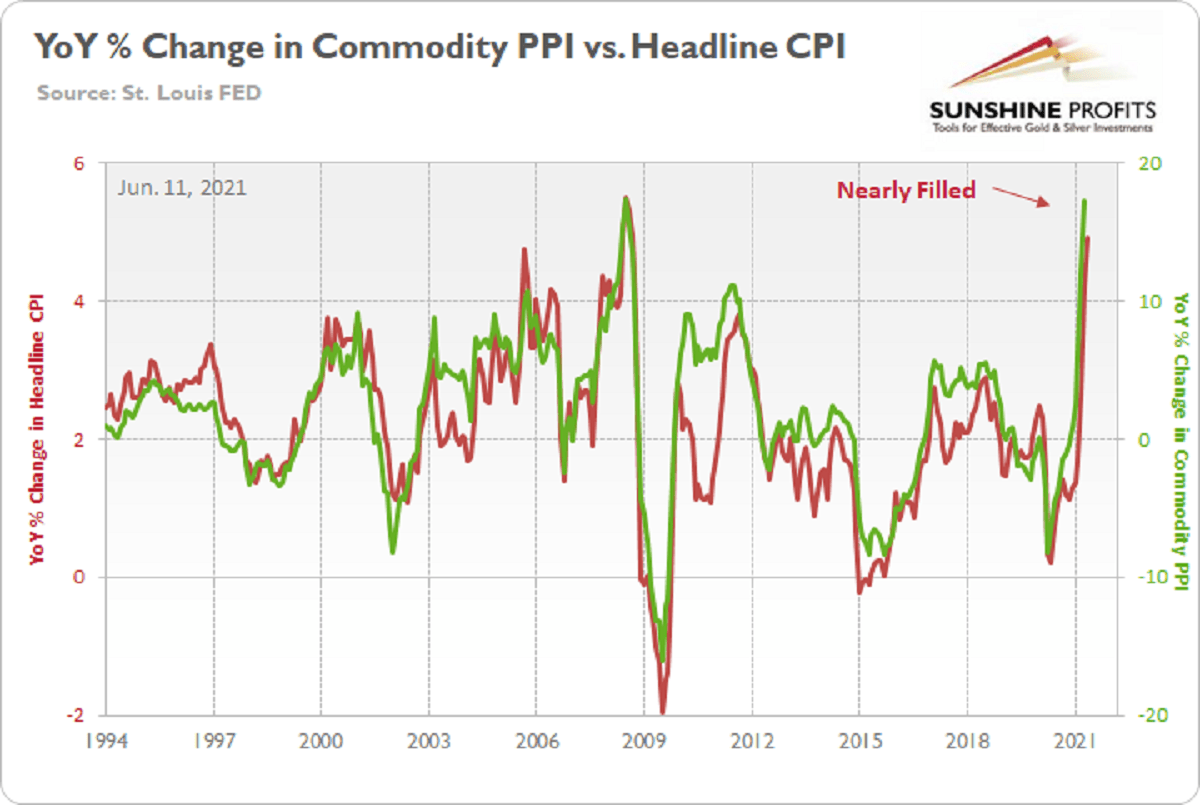
The commodity PPI surged by 17.25% YoY in April. And if you exclude the 17.36% YoY jump in July 2008, it was the largest YoY percentage increase since December 1974. For context, the commodity PPI often leads the headline CPI and that’s why tracking the former’s movement is so important. Moreover, reconnecting with the green line implies a ~5.50% YoY percentage increase in the headline CPI.
Please see below:
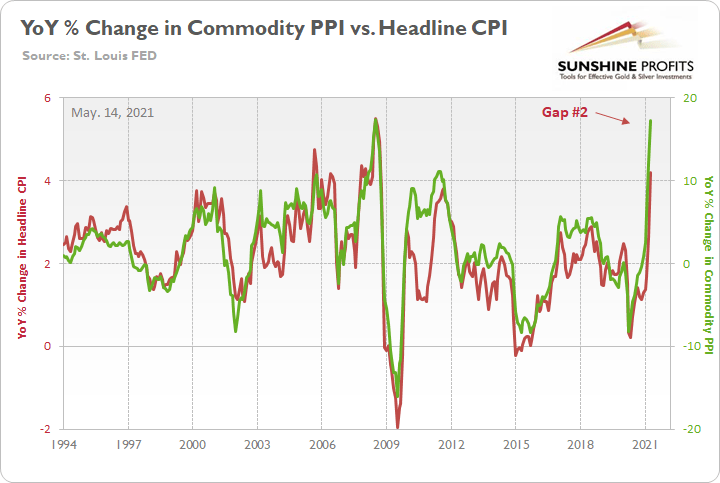
And with the indicator proving quite prescient once again, the gap on the right side of the chart was nearly filled on Jun. 10.
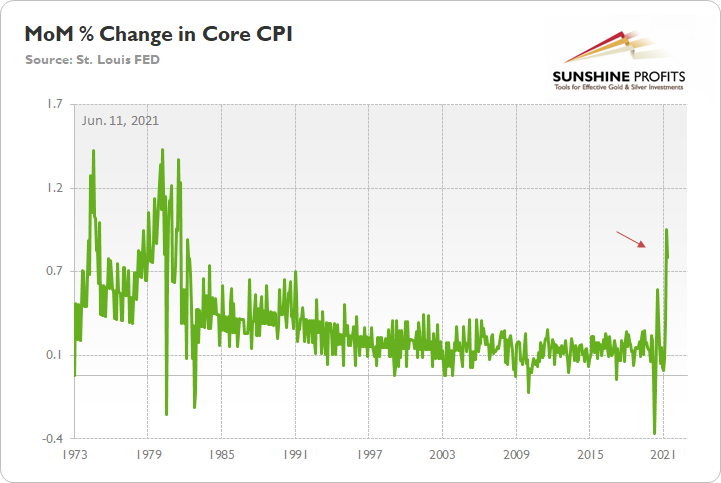
Furthermore, while investors continue to see the world through the FED’s X – Ray Vision, “base effects” are now the primary defense among the superhero’s supporters. However, as I’ve mentioned on several occasions, it’s important to remember that the core CPI increased by 0.74% month-over-month (MoM). And if you exclude April’s rise of 0.92% (which was only one month ago), it was the highest MoM percentage increase since 1982.
Please see below:
The FED Has Become Independent Thought’s Kryptonite
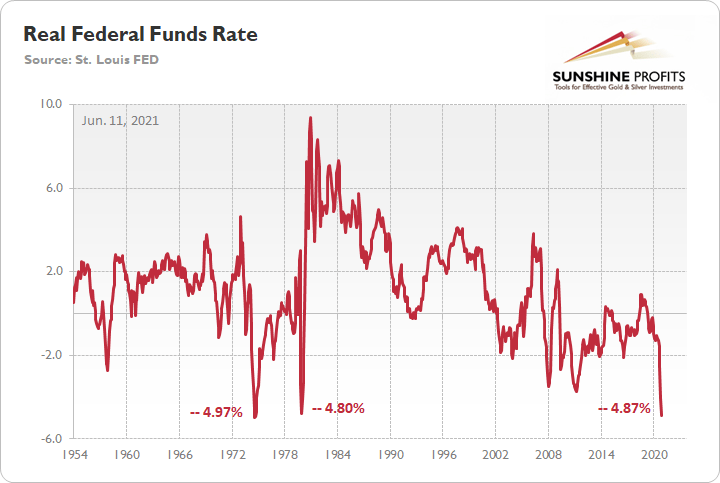
On top of that, with the YoY percentage change in the headline CPI running extremely hot, the real federal funds rate is now at its second-lowest level ever . For context, the federal funds rate is the overnight lending rate set by the FOMC, while the real federal funds rate is adjusted for inflation by subtracting the YoY percentage change in the headline CPI.
Please see below:
So how can we explain investors’ lack of prudence?
Well, as Bloomberg eloquently put it on Jun. 10…
Source: Bloomberg
Thus, with the FED mesmerizing investors and keeping them under its spell, market participants have determined that it’s easier to follow the FED rather than fight it. However, when screaming fundamentals are dismissed as irrelevant, it often ends badly for those who fail to heed the warnings. To that point, while the Producer Price Index (PPI) – which will be released on Jun. 15 – will provide important clues on the inflationary trajectory, Nordea’s trend model signals that YoY CPI prints still have plenty of room to run.
Please see below:
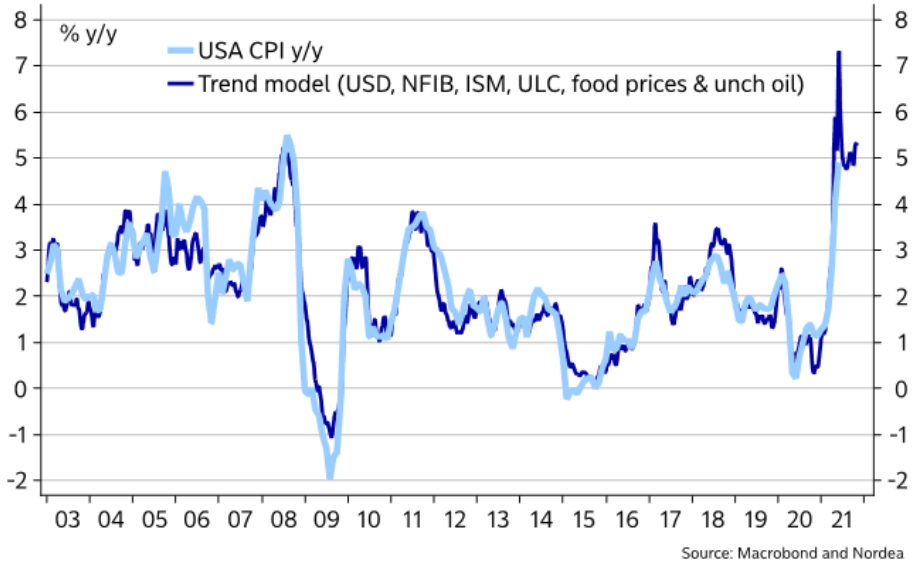
To explain, the light blue line above tracks the YoY percentage change in the headline CPI, while the dark blue line above tracks the projected YoY percentage change in Nordea’s trend model. If you analyze the right side of the chart, you can see that April and May’s prints were accurately forecasted. More importantly, though, with the dark blue line signaling that the headline CPI should rise by more than 7% YoY in the coming months, investors’ faith in the FED will be put to the test over the medium term.
Likewise, even though the FED has become independent thought’s kryptonite, if investors dismiss the scorching inflationary summer, they’ll likely incur deeper burns in the fall.
To explain, I wrote on Jun. 10:
With the Jun. 15/16 policy meeting not leaving enough time for FED officials to “communicate very early, very often what we’re going to do” (spoken by Philadelphia FED President Patrick Harker) and the Jul. 27/28 policy meeting excluding a summary of the FED’s economic projections, either the Jackson Hole Economic Symposium (late August) or the Sep. 21/22 policy meeting is when the fireworks will likely begin.
With the U.S. Bureau of Labor Statistics (BLS) revealing on Jun. 8 that U.S. job openings surged to an all-time high of 9.286 million – and came in well above the consensus estimate of 8.300 million – the only thing depressing the U.S. labor market are ill-advised enhanced unemployment benefits.
Please see below:
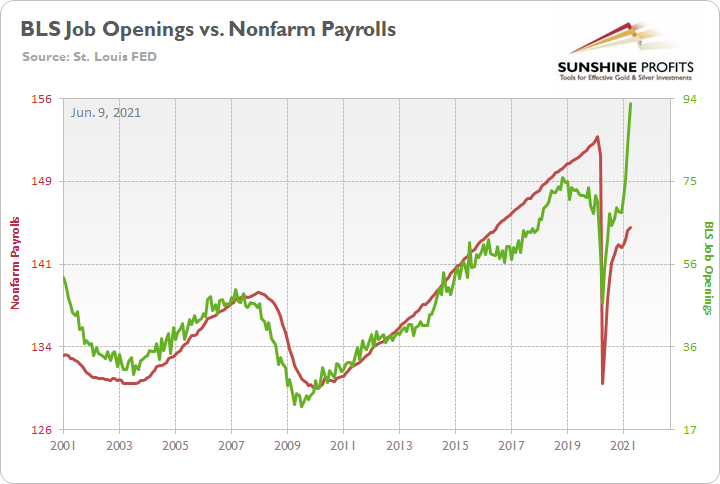
To explain, the red line above tracks U.S. nonfarm payrolls, while the green line above tracks U.S. job openings. If you analyze the relationship, you can see that the latter is often a strong predictor of the former. However, with enhanced unemployment benefits still in effect until mid-to-late June or early July (across ~25 states) – and nationwide until Sep. 6 (expected) – the shift likely won’t occur overnight. But once the benefits expire, U.S. nonfarm payrolls will likely spike in August (reflecting July’s data) and September (reflecting August’s data) and lift the U.S. 10-Year Treasury yield and the USD Index in the process.
The bottom line? With a potential spike in the Shelter CPI likely to coincide with a major resurgence in the U.S. labor force, September has all of the necessary ingredients to force the FED’s hand .
The ECB Is Not Reducing Anything
On top of that, I warned that prophecies of the European Central Bank (ECB) reducing its bond-buying program in June were much more semblance than substance.
I wrote on Apr. 27 :
Recent whispers of the ECB tapering its bond-buying program are extremely premature. With the European economy still drastically underperforming the U.S., it’s actually more likely that the ECB increases the pace of its bond-buying program.
And after the ECB released its monetary policy decision on Jun. 10, what was clear before now is the reality.
Please see below:
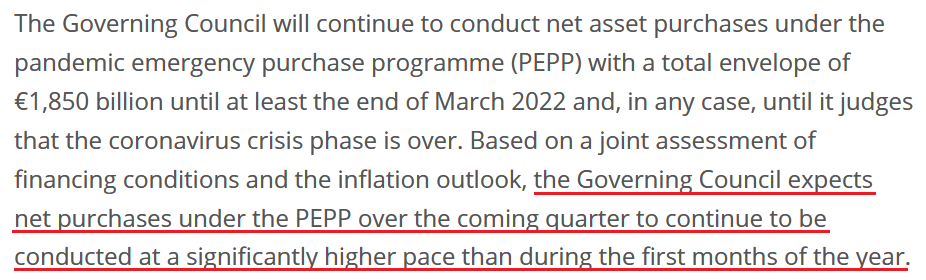
Source: ECB
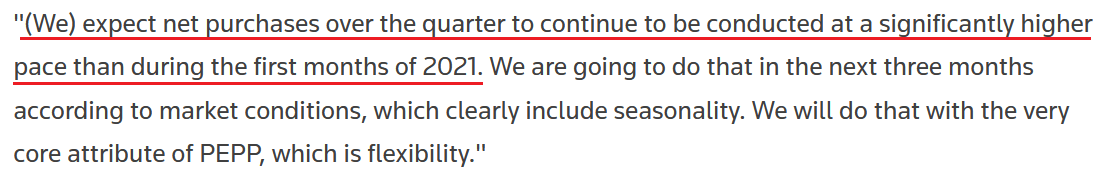
In addition, ECB President Christine Lagarde said the following during her press conference:
- “The U.S. economic situation and the Euro Area economic situation are very different stories. The two economies are at different points in the recovery cycle. “
- “Any discussion about exit from the PEPP would be premature, too early, and it will come in due course, but certainly, for the moment it is too early and premature – simple as that.”
- “Any kind of transition, exit, whatever you call it, has not been discussed”
And although the ECB increased its Eurozone GDP growth, as well as inflation expectations, and Lagarde even said that “there was [a] debate on the pace of the purchase, on some of the analytical aspects of the use of our instruments,” she reiterated:
Source: Reuters
The bottom line?
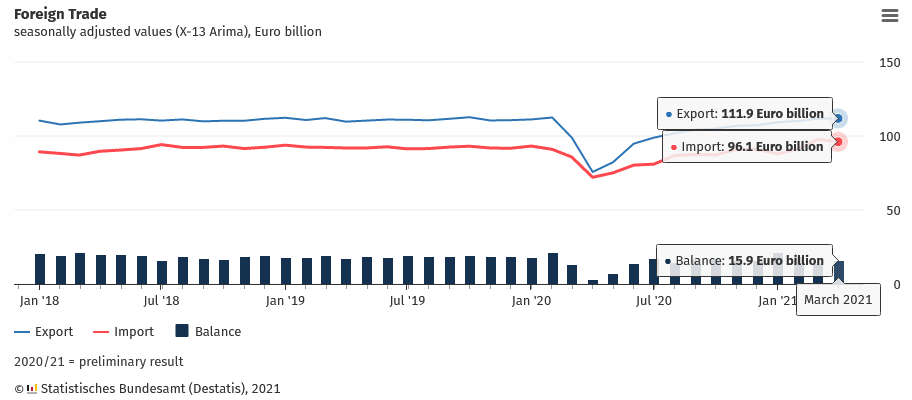
While the EUR/USD remains materially overvalued, the ECB’s policy is not the only fundamental data point that supports this thesis. Case in point: it was a trifecta for Germany (Europe’s largest economy) on Jun. 9, with imports, exports, and consequently the German trade balance, all missing economists’ consensus estimate. To explain, exports rose by 0.30% MoM versus 0.5% expected, imports fell by 1.7% MoM versus a decline of 1.1% expected and the trade balance came in at €15.9 billion versus €16.3 billion expected.
Please see below:
The S&P 500 Is Losing Momentum
Finally, while it may not be visible on the surface, the S&P 500’s momentum continues to decelerate. Even though the U.S. equity benchmark followed the ‘ don’t fight the FED’ mantra to another all-time high on Jun. 10, optimism is waning. Case in point: while the YoY percentage change in the FED’s balance sheet (released on Jun. 10) was roughly flat this week, the YoY percentage change in the S&P 500 continues to move lower. And with a summertime soirée likely the last “hurrah!” for the S&P 500 and the FED’s balance sheet – with all signs pointing to the latter tightening in September – a move lower for both variables will likely occur over the medium term.
Please see below:
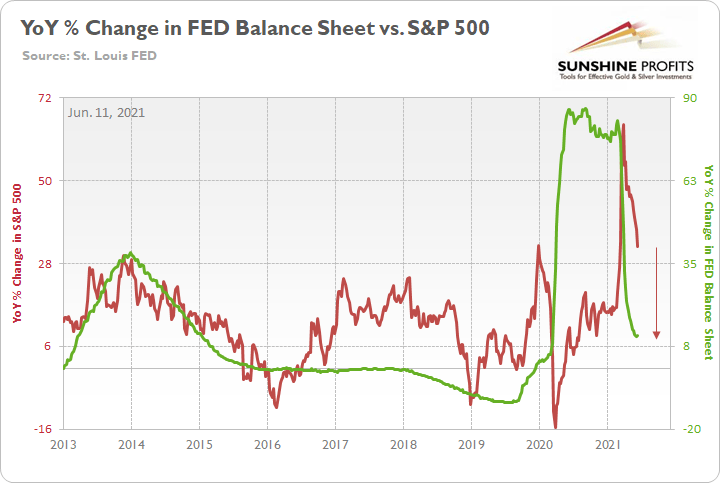
The red line above tracks the YoY percentage change in the S&P 500, while the green line above tracks the YoY percentage change in the FED’s balance sheet. If you analyze the relationship, you can see that investors’ optimism often rises and falls with the pace of the FED’s asset purchases. To that point, the FED’s YoY rate of expansion of its balance sheet peaked (for good) during the third week of February and has been in free fall ever since. Similarly, the S&P 500’s YoY rate of expansion peaked during the third week of March and has declined substantially.
The bottom line? With the weekly metric hitting a 2021 low on Jun. 3 and a reduction of the FED’s bond-buying program poised to push the YoY percentage change into negative territory in the coming months (again, likely in September), the S&P 500 is slowly running out of gas.
In conclusion, the FED has mesmerized the investing public once again, and saving the day doesn’t even require the central bank to do anything anymore. However, with reality undefeated and a major regime shift likely to occur in September, there are only a few hours left until the clock strikes midnight. Moreover, with bond market imbalances at or near their all-time highs, the PMs will likely detest the forthcoming climax. Think about it: if the PMs can only muster tepid rallies when the fundamentals are historically (though synthetically) tilted in their favor, the price action could get ugly once the sanity finally prevails.
Thank you for reading our free analysis today. Please note that the above is just a small fraction of today’s all-encompassing Gold & Silver Trading Alert. The latter includes multiple premium details such as the targets for gold and mining stocks that could be reached in the next few weeks. If you’d like to read those premium details, we have good news for you. As soon as you sign up for our free gold newsletter, you’ll get a free 7-day no-obligation trial access to our premium Gold & Silver Trading Alerts. It’s really free – sign up today.
Przemyslaw Radomski, CFA
Founder, Editor-in-chief
Sunshine Profits: Effective Investment through Diligence & Care
All essays, research and information found above represent analyses and opinions of Przemyslaw Radomski, CFA and Sunshine Profits’ associates only. As such, it may prove wrong and be subject to change without notice. Opinions and analyses are based on data available to authors of respective essays at the time of writing. Although the information provided above is based on careful research and sources that are deemed to be accurate, Przemyslaw Radomski, CFA and his associates do not guarantee the accuracy or thoroughness of the data or information reported. The opinions published above are neither an offer nor a recommendation to purchase or sell any securities. Mr. Radomski is not a Registered Securities Advisor. By reading Przemyslaw Radomski’s, CFA reports you fully agree that he will not be held responsible or liable for any decisions you make regarding any information provided in these reports. Investing, trading and speculation in any financial markets may involve high risk of loss. Przemyslaw Radomski, CFA, Sunshine Profits’ employees and affiliates as well as members of their families may have a short or long position in any securities, including those mentioned in any of the reports or essays, and may make additional purchases and/or sales of those securities without notice.


