Buying a stock is a lot like buying a house: sure, you want to check the exterior paint, but more important is the foundation – the house needs to be stable to make your investment worthwhile in the long run. But, while it’s easy to tell if your house needs a new coat of paint, what do you know about foundations? The same principle is true of stocks:
Q1 hedge fund letters, conference, scoops etc, Also read Lear Capital: Financial Products You Should Avoid?
Whether you’re a seasoned investor or just testing the waters of the market, the fact is that it’s extremely difficult to accurately predict whether a company is a sound investment or not. The amount of information out there to make this decision is overwhelming, just like assessing a house’s foundation takes expertise. Luckily, while there’s no 100% accurate way to predict a stock’s performance, focusing on the underlying fundamentals of a business’ true value makes the process much easier – but you need to know what you’re looking for. This is where value investing comes in.
Value investing is an investment strategy where investors look for stocks they believe the market has undervalued – i.e., trading for less than their intrinsic value. The general concept behind value investing is that if you estimate the true value of something you only buy it when it is at a discount. In the specific case of equities, this would mean investing in good businesses that are priced cheap and posed to outperform the market over the long term. There are some figures and trends to watch out for as you’re trying to make a decision in whether or not to invest in these businesses. We look at financial ratios to determine if they are sound, profitability margins to see if they are at adequate levels and debt levels to see if they are manageable.
However, how do we determine that financial ratios and profit margins are adequate? How do we determine that debt levels are reasonable? What do we compare against? If we compare the numbers of Apple Inc. and British Petroleum we are looking at two very different animals. Companies in different industries can have very different financials. What we would need to do is to compare apples with apples – that is, compare figures between companies that are actually comparable; for example, Apple Inc. and Samsung. This method of valuation is called a comparable companies valuation.
Here is a practical example. If Apple Inc. is trading at a lower Price/Earnings Ratio (P/E) than Samsung trades at, there must be a logical reason for this. Trading at a lower P/E would mean that Apple’s market capitalization, as a multiple of its earnings, is lower than Samsung’s. This could be explained by many factors. If Samsung’s revenue is growing at a faster rate, if its profit margins are higher and if its debt levels are lower than Apple’s, it may be justifiable that Samsung trade at a higher P/E. However, if earnings growth, profit margins and debt of both companies are at similar levels; but trading ratios, such as P/E, show significant differences, there may be an investment opportunity. In the latter scenario Apple would clearly appear to be undervalued.
There are a lot of tools that can help us quickly evaluate fundamentals. Many free websites (screeners) allow us to filter stocks according to certain criteria, such as stocks with a certain P/E ratio. These screeners can help us come up with a broad list of stocks that we might want to research further. Our recently launched equity research tool, StockPitch, takes it one step further. StockPitch runs a comparable company valuation and a DCF valuation and allows us to customize the valuations to our own preferences with the click of a button. Let’s take a look at an actual company on the StockPitch platform: Facebook, Inc. (NasdaqGS:FB).
If we jump back to our house/stock analogy for a second, Facebook’s once-fresh coat of paint has been chipping and peeling rather badly in the last few years. Notably, it’s recently been under fire due in part to the Cambridge Analytica scandal, in which a voter-profiling company improperly accessed and used the data of at least 50 million Facebook users. Such an unsightly paint job might turn off superficial investors. But what about its foundation? As it turns out, Facebook’s fundamentals are quite sound.
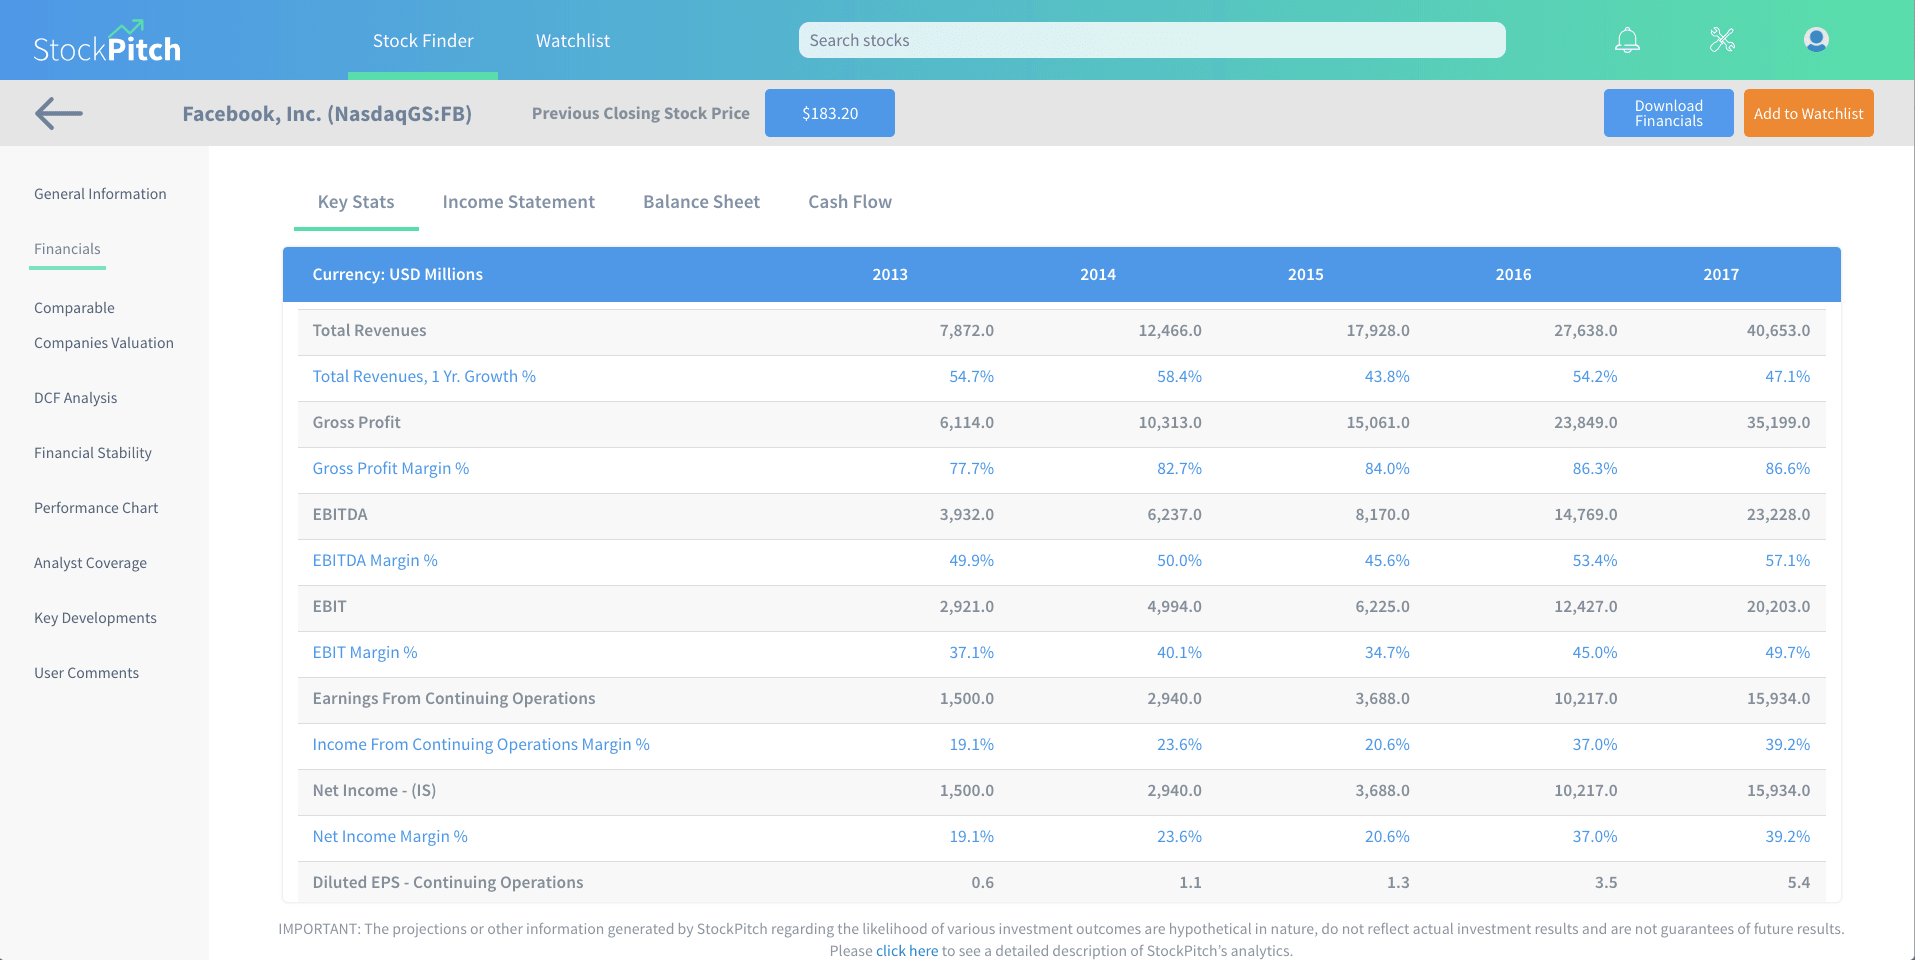
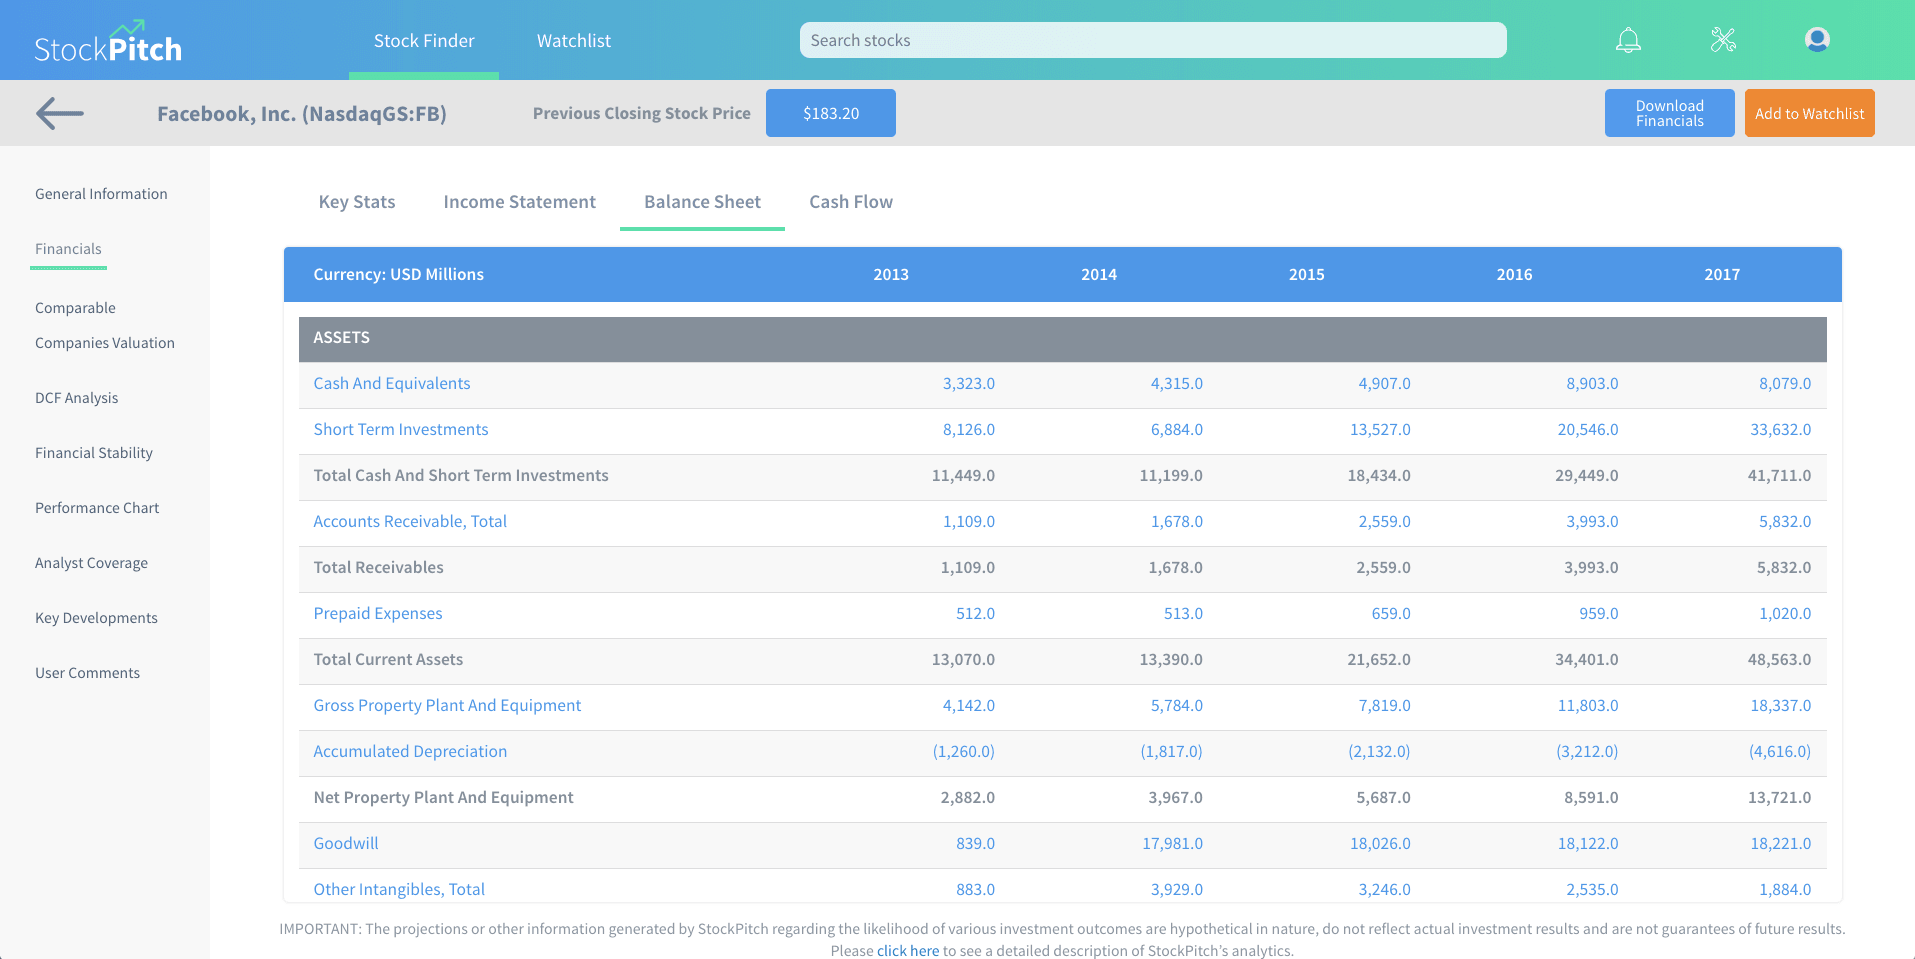
Revenue continues to increase at an impressive level while EBITDA Margin and Net Margin continue to rise as well. The company does not report any debt and has considerable cash holdings.
Financial analysts forecast an average target price of USD$217.84 within the next 12 to 18 months, with an overwhelming number of buy recommendations.
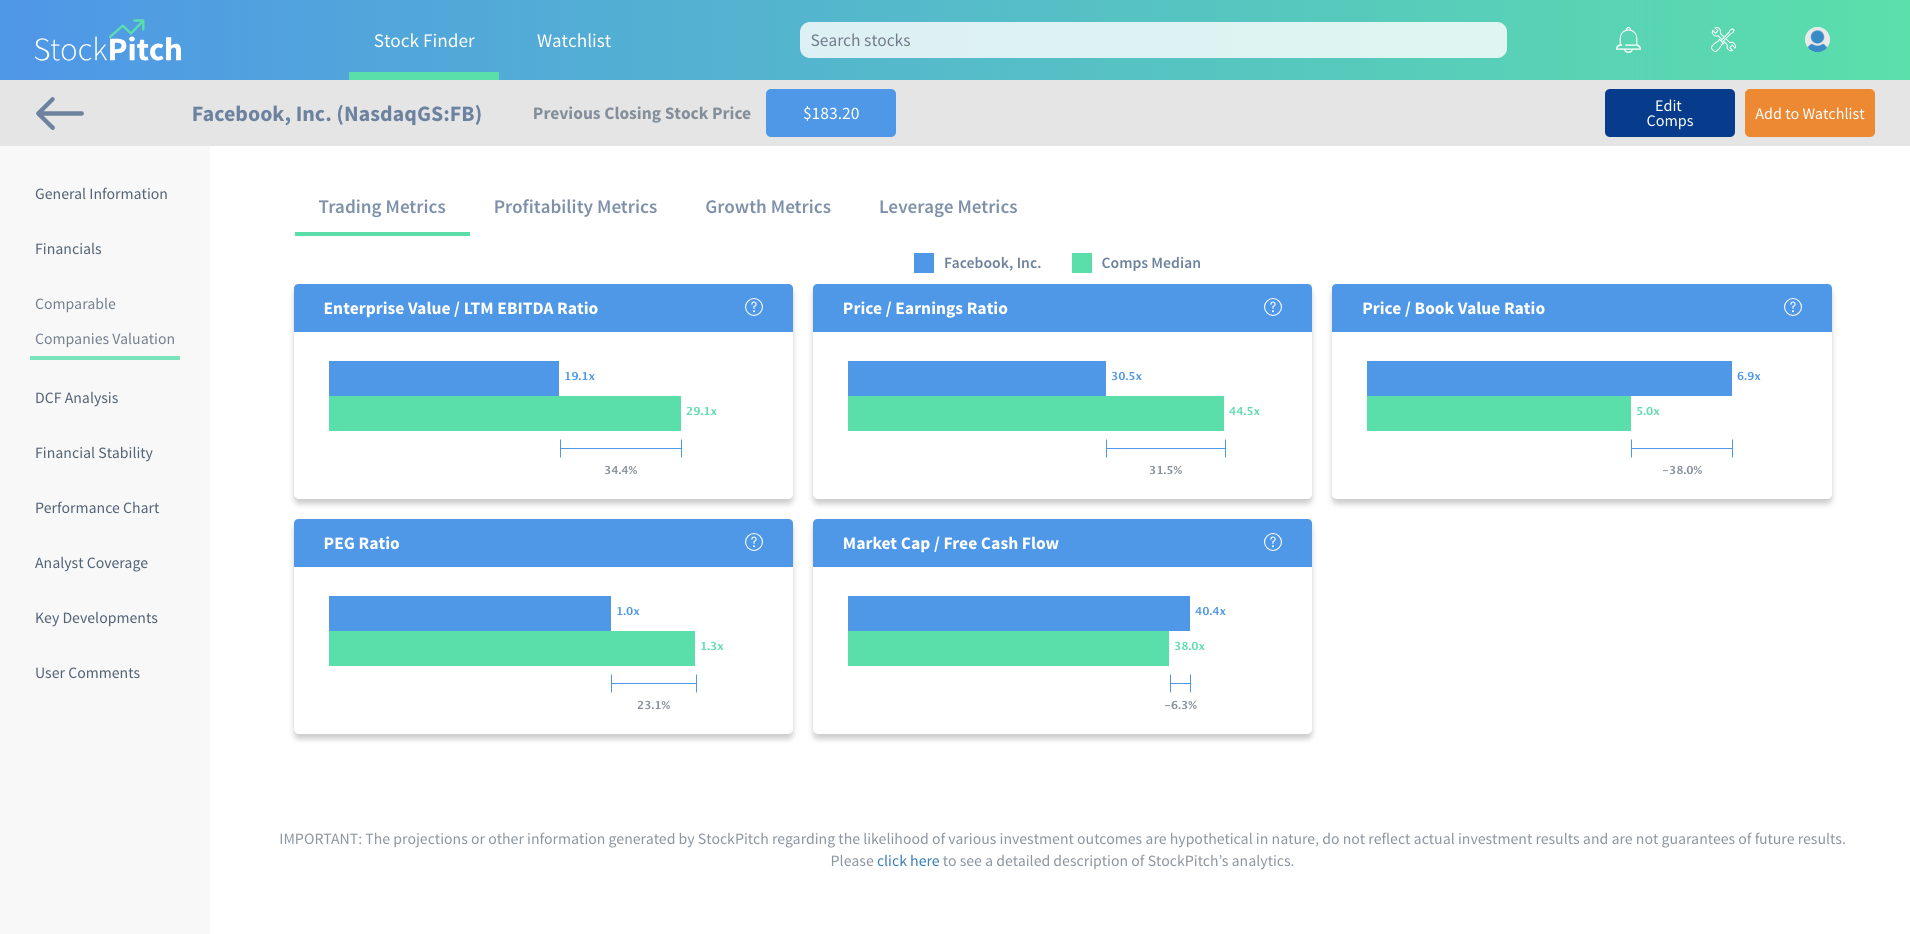
Moving into more sophisticated fundamental analysis, if we compare FB’s financial ratios to those of comparable companies, we see promising figures. FB is currently trading at a significant discount versus its comparables in TEV/EBITDA Ratio and P/E Ratio. It has a slight discount in Market Cap/Free Cash Flow Ratio, but has a considerable premium in Price/Book Value Ratio.
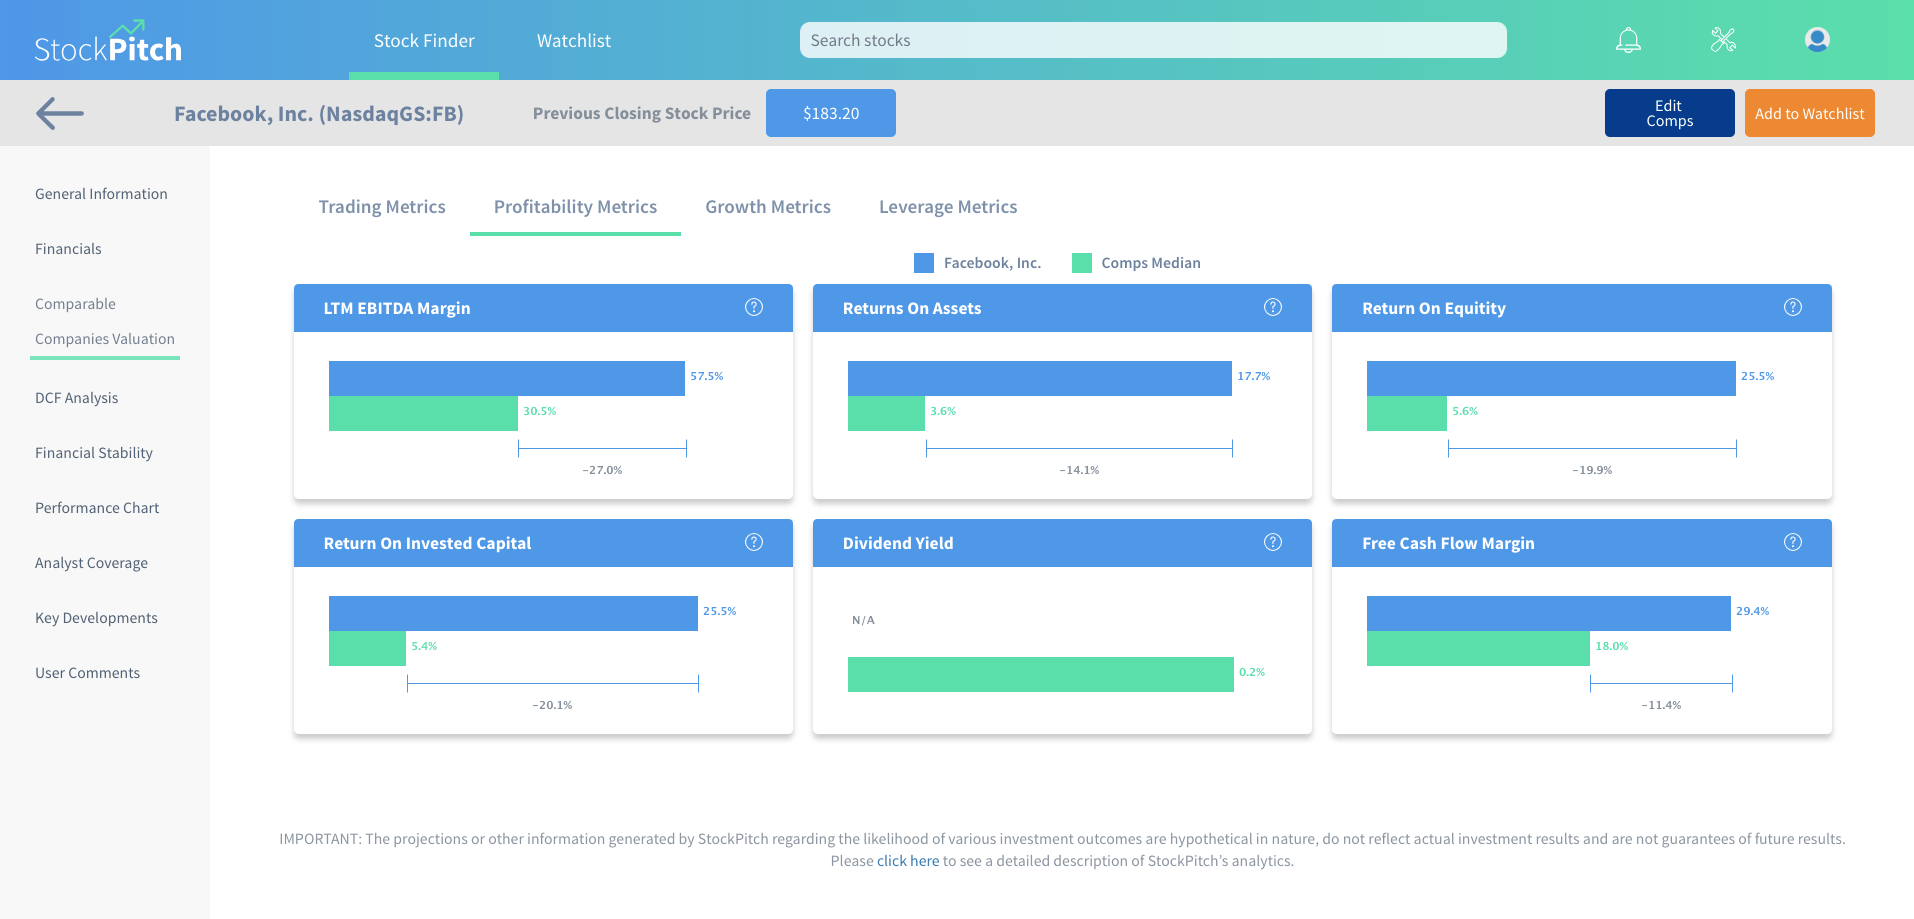
Moving on to profitability metrics, FB is performing better than its comparables practically across the board. It has a much higher EBITDA Margin, ROA, and ROE, ROIC and Free Cash Flow Margin.
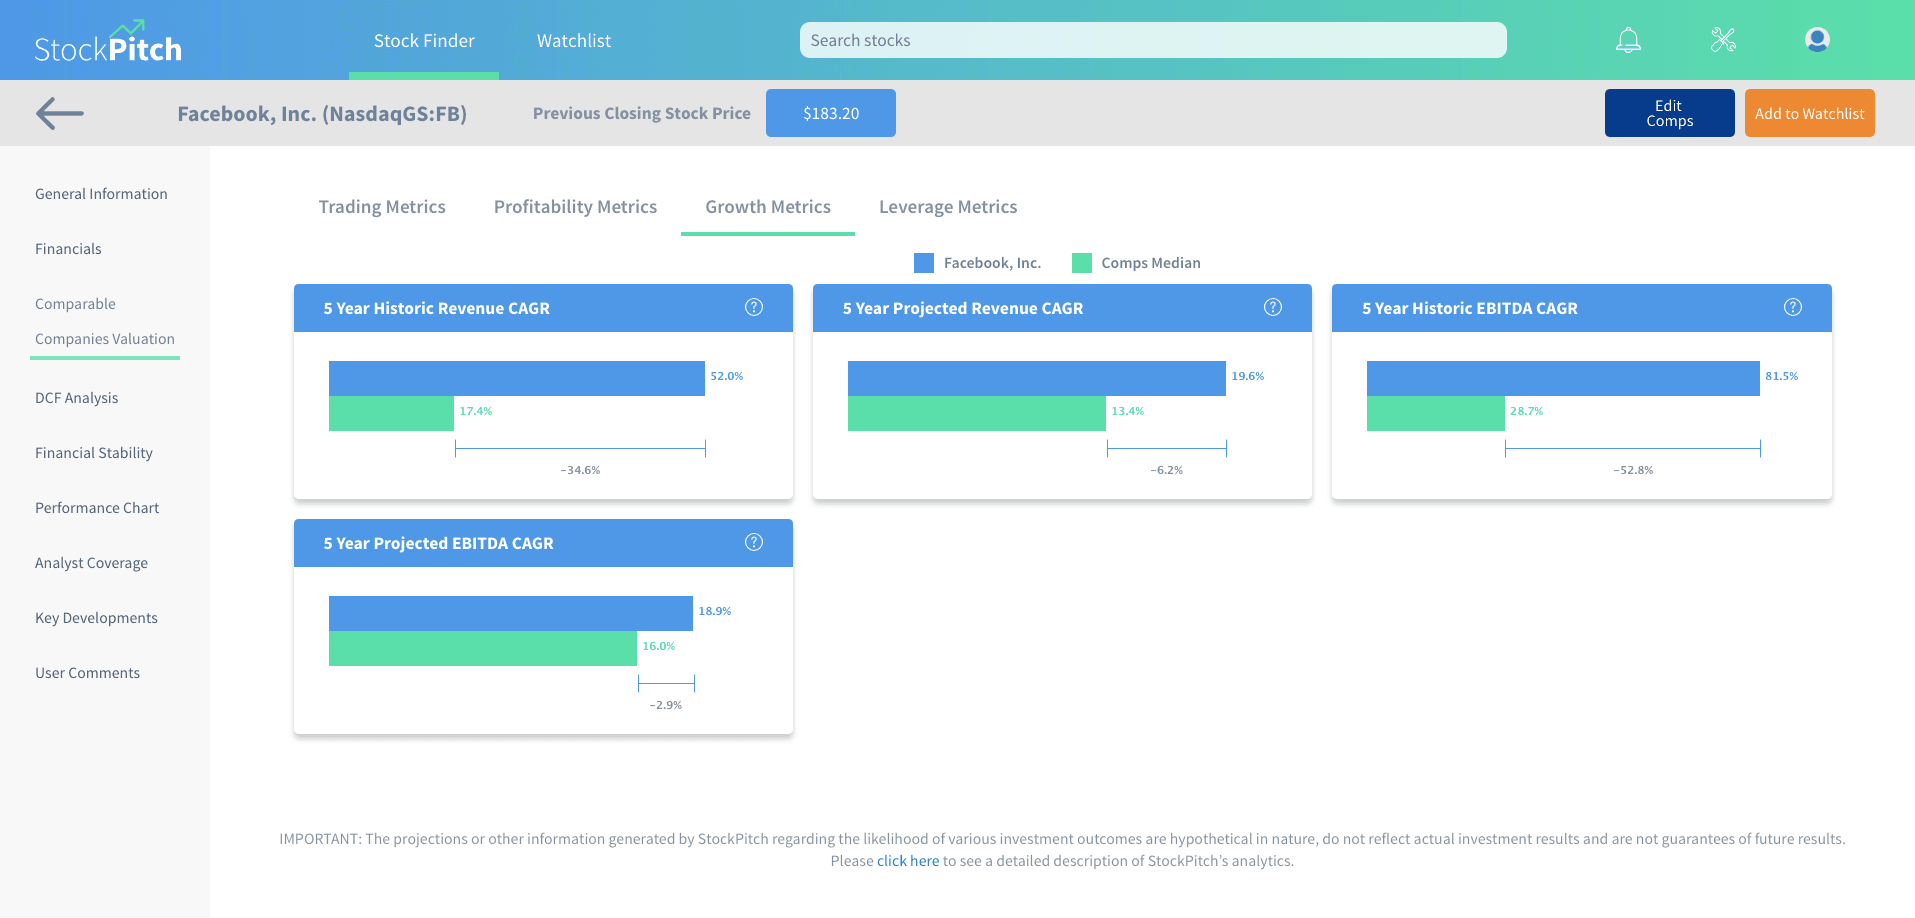
Looking at growth levels, the company has grown considerably faster than its comparables in Revenue and EBITDA, and is expected to continue to grow at a faster pace.
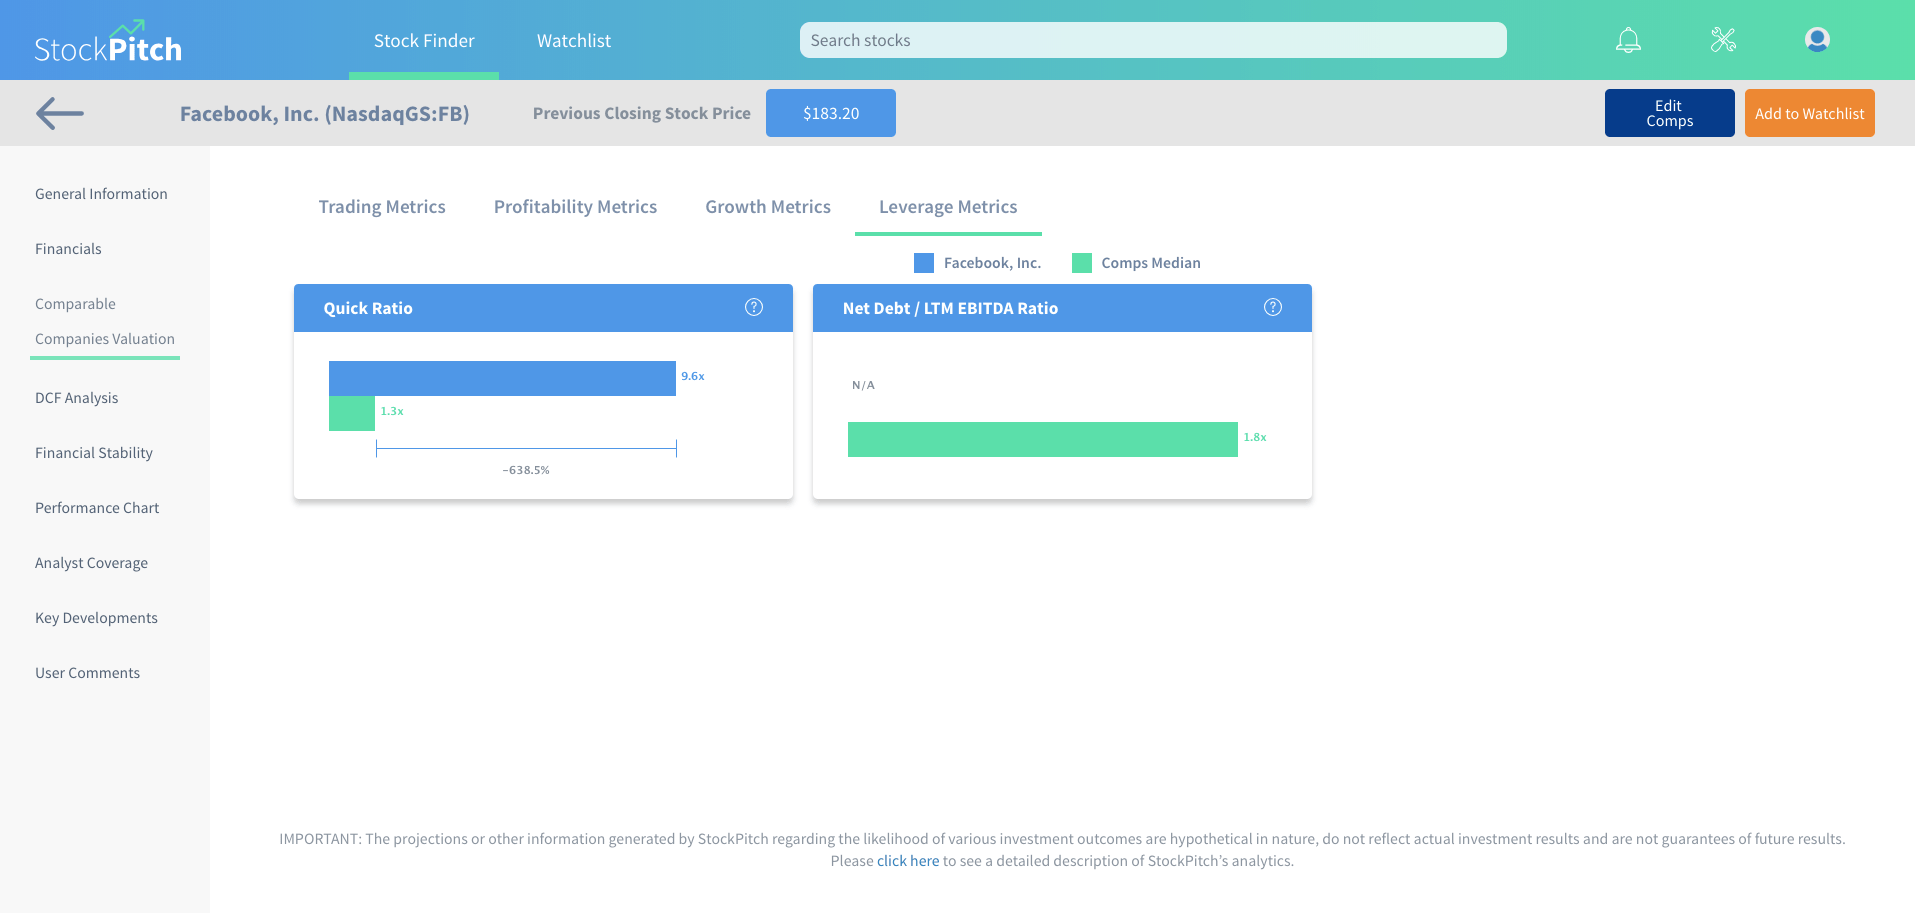
Finally, looking at metrics related to debt we see promising data as well. The company’s Quick Ratio is multiple times higher than that of comparables. Additionally, the company does not report any debt holdings, while comparable companies have a median Net Debt/EBITDA Ratio of almost 2.0x.
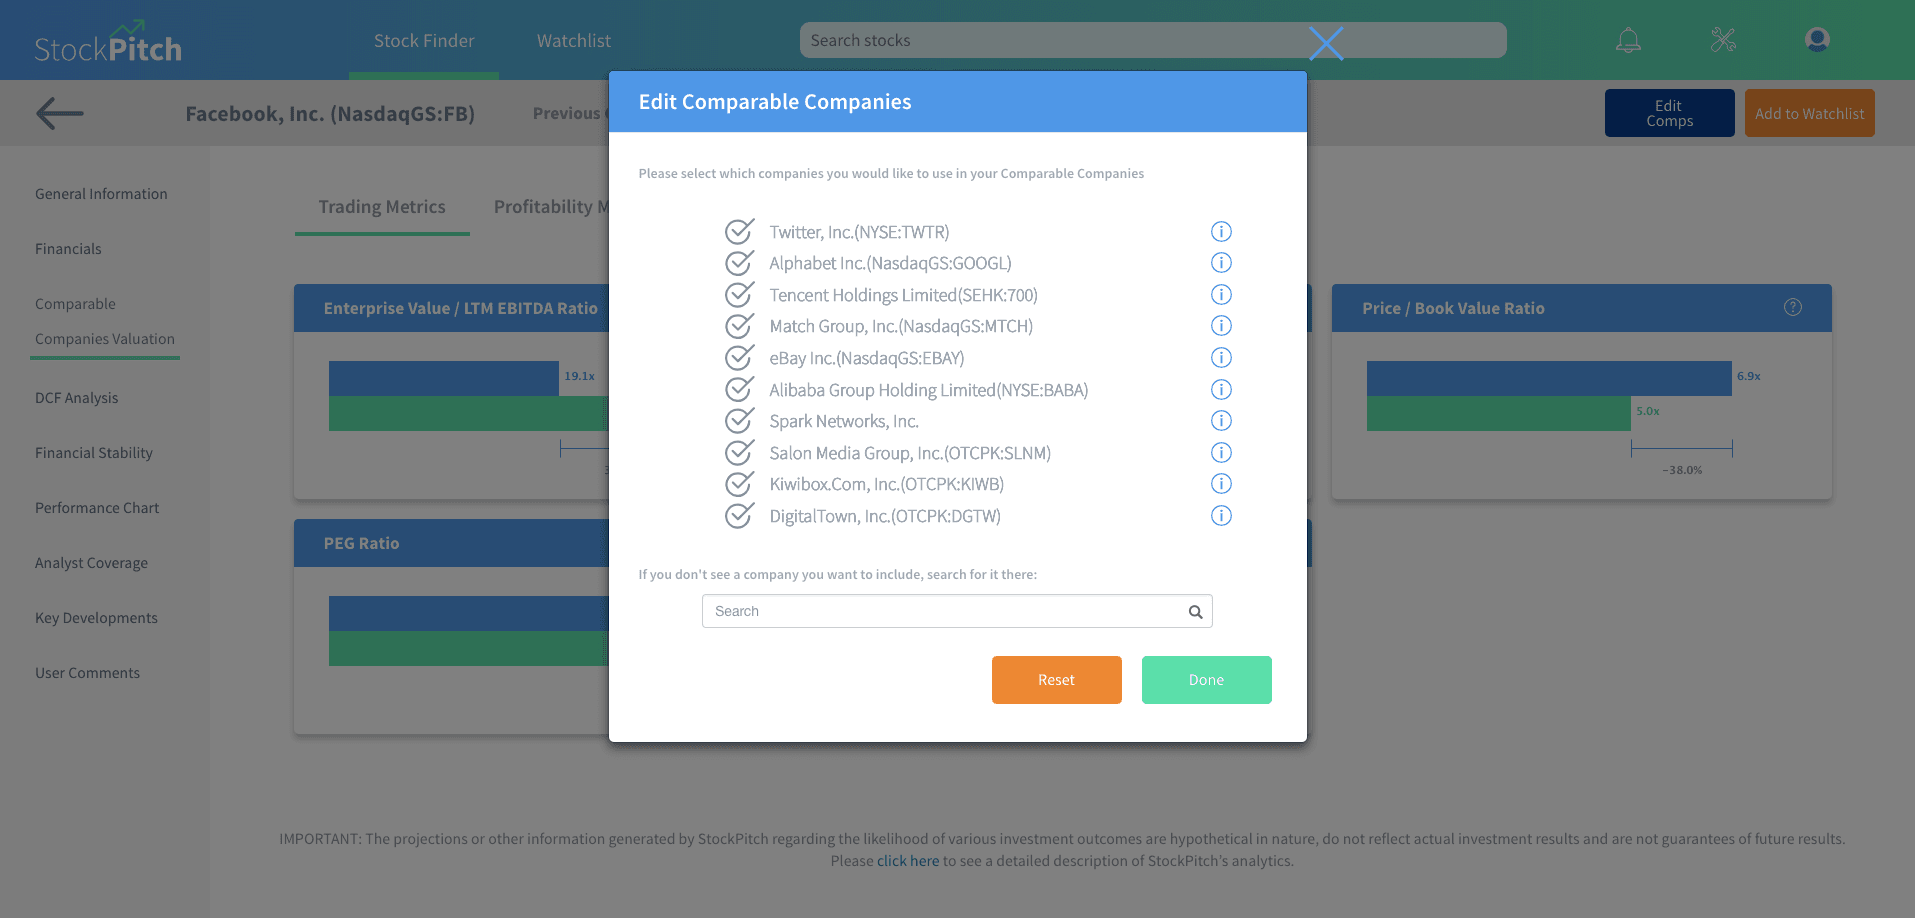
The above data is promising, but it is important to consider what companies StockPitch is actually comparing FB to. In the image below you can see the set of comparable companies that StockPitch uses for FB. It is important to highlight that StockPitch has customization features that allow us to manipulate the platform’s base valuations according to our preferences. In this case we can easily decide to remove any of the companies that StockPitch considers comparable and add others that we would like to include. We can even do a one-on-one comparison. This process is as easy as a click of a button and StockPitch automatically re-calculates all figures for us in seconds.
In summary, FB seems to present an interesting investment opportunity. But how can we find other companies with these characteristics? StockPitch’s Stock Finder feature is a great guide as well.
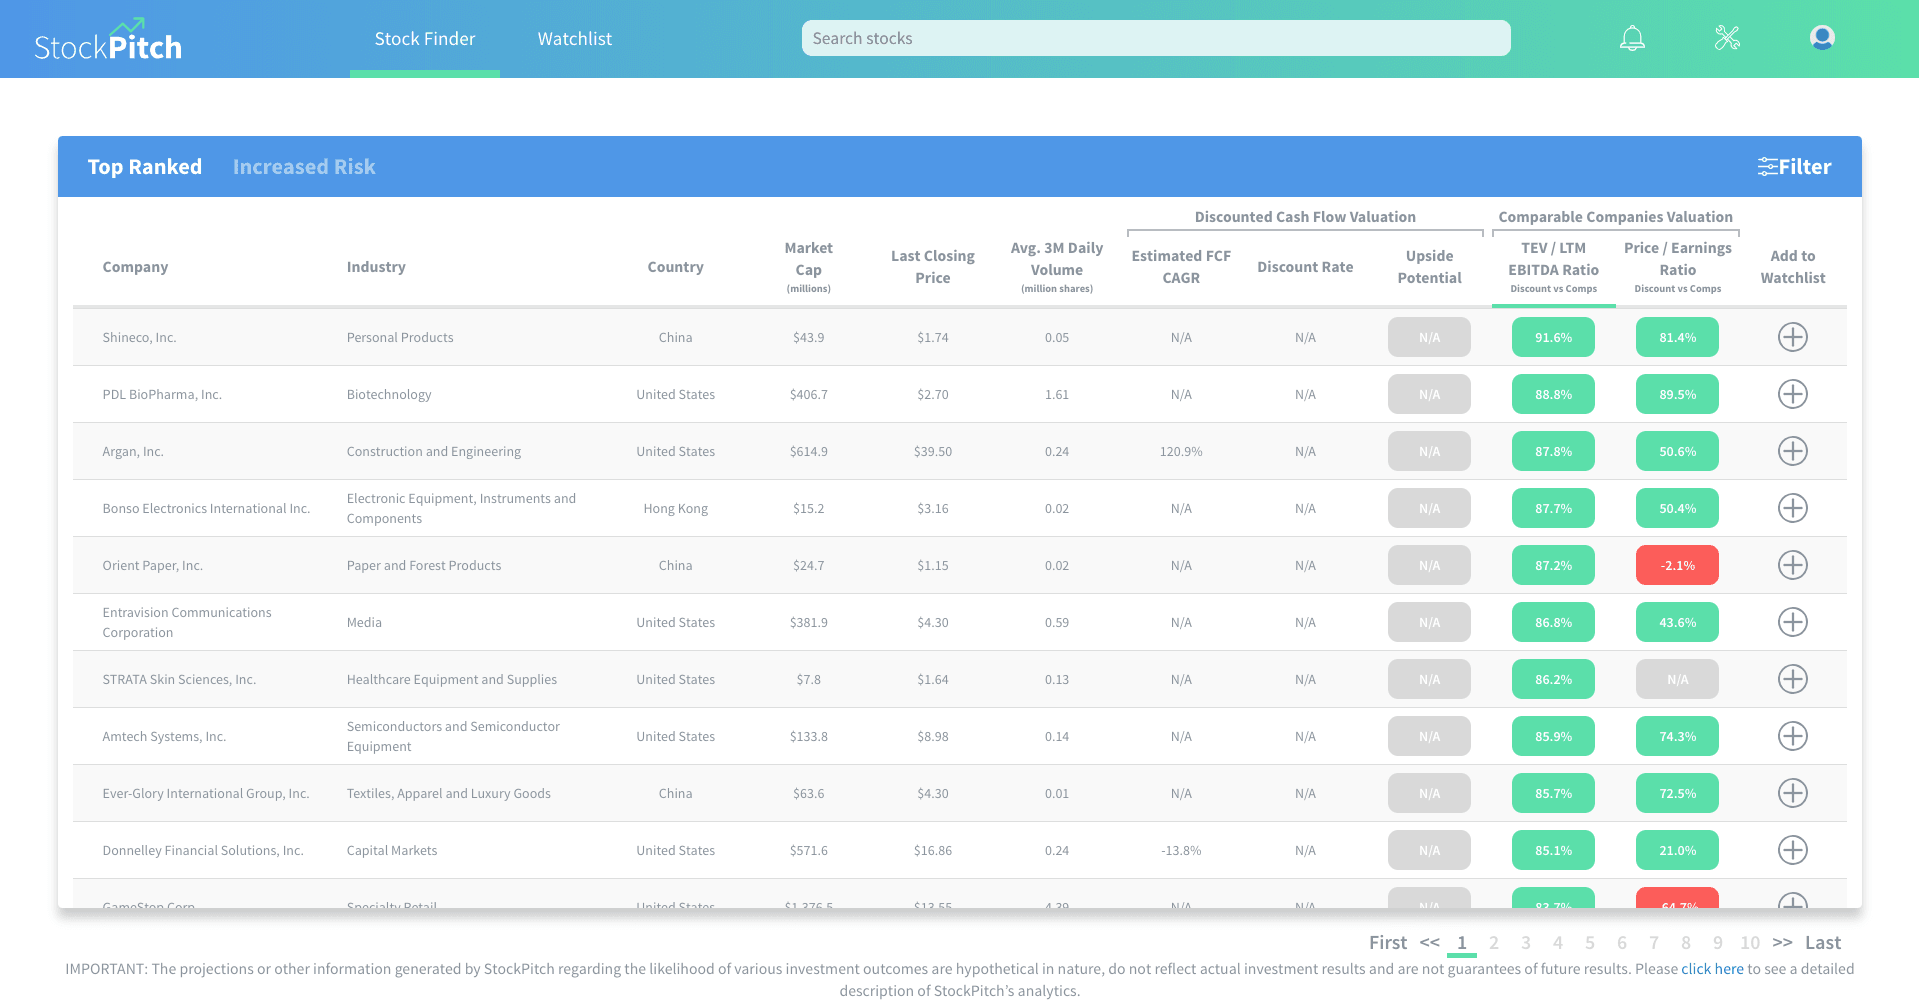
StockPitch’s Stock Finder works as a filter, but also ranks companies according to the fundamental valuation metrics that the platform’s valuations result in. On this page we see a summarized version of StockPitch’s analytics in order to determine what companies we invest more time into. With this tool there is less fishing in the dark. For the novice investor StockPitch is an incredible tool to get involved in the market. It removes the intimidation behind the financial analysis that goes into choosing which company to invest in. For the existing retail investor StockPitch is an efficient tool that will save loads of analysis time.
A comprehensive walkthrough and a free demo with limited functionality are available on StockPitch’s website: www.stockpitch.com.
Always remember that it is wise to invest in companies that you understand – companies in industries you have worked in or that sell consumer goods that you are familiar with. And if you’re buying a house, hire an accredited inspector to check out the foundation.