
Orthogonal though they may often seem, the correlation between bond and equity markets is under the spotlight. The market remains fixated on monetary policy action from central bank leaders across the globe – most prominently the Fed, the ECB and the BoJ. Monetary policy aside, we all know when it comes to immediate downside risk that real-time market dynamics speak volumes, or perhaps more appropriately in today’s climate – volumes will speak to market dynamics. Specifically, ETF outflow volumes, which brings us back to bond-equity correlation.
Correlation Positive – Risk Off
Decidedly negative since the GFC, bond equity correlations have been teetering towards positive values into 2017 year end. An inversion in this correlative relationship has historically driven multi-asset investors, such as risk parity funds and balanced mutual funds towards de-risking. These funds have capitalised upon the structurally negative correlation between bonds and equities – keeping volatility at bay allows significant gearing up of leverage and with it returns (and the all- important Sharpe ratio) amplification. However, these investments – representing a whopping $150bn in risk parity funds and a $1.5tr in US balanced mutual funds ($4.5tr global) – are forced to take risk off and de-lever when the correlation turns positive, to avoid the commensurate increased volatility exposure. 1
What to expect…
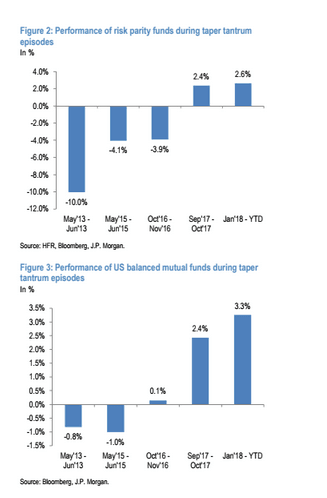
To gauge the potential outcome, we can look at recent episodes when the bond-equity correlation turned positive. Specifically, recent research from JP Morgan highlights that over the past 5 years there have been 5 similar instances resulting from so-called “taper tantrums”. In these periods we saw surges in US Treasury yields resulting from phases of Fed tapering of QE – driving the performance of these types of funds downwards.
The worst came in May of 2013, which resulted in risk parity funds delivering a disappointing -10% performance and US balanced mutual funds -0.8%. To put that into context year-to-date (YTD) these investment categories have delivered 2.6% and 3.3% YTD in 2018 respectively, as of 31st January 2018 – quite a difference, and delivering the best performance of the taper tantrum periods analysed.
ETF inflows – keeping correlation at bay?
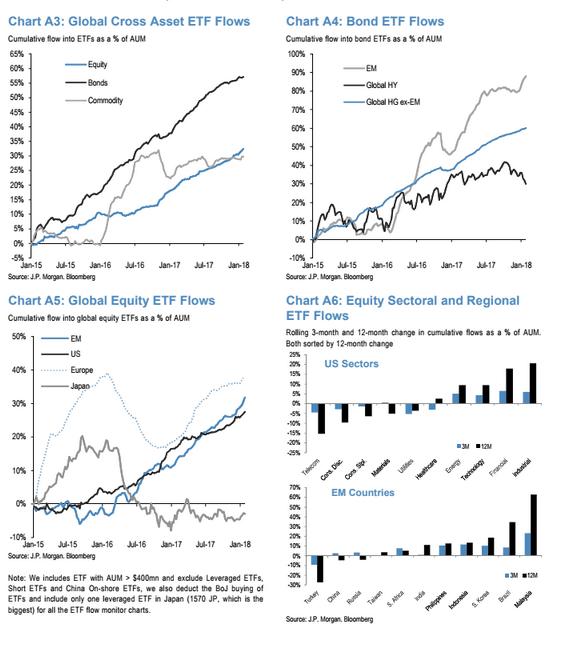
In each of the 5 cases (including that of 2018), sizeable ETF inflows have cushioned the blow to equity markets and subsequent correlations. We might arguably presume the status quo will continue – seeing as YTD equity ETF flows surpassed the $100bn mark, a record pace for this start of the year period. Further to this, cross-asset ETF flows now represent over 55% of cumulative flow as a percentage of AUM as of January 31st 2018. These figures do not hint that the tide is turning.
Is the tide turning?
However, on the 1st February 2018 equity ETFs saw a significant outflow, the highest YTD – amounting to $3.4billion. Could this be the turning point for an equity sell off? Obviously one day’s trading does not a reversion make. However, investors would be wise to keep a close eye out for more ETF outflows that will contribute to positive bond-equity correlations.
Driven largely by retail investors, ETF flow sentiment has not shown strong indications of a reversal – yet. Reassuringly, US equity ETF short interest (an indicator of negative sentiment) remains low – at sub 6% (as a percentage of outstanding shares) for US Domiciled ETFs – whereas in 2013 the same figure was close to 10%.1
Adjusting Allocations
Keep in mind that balanced mutual funds, with their higher allocation to equities, typically 60%, offer more flexibility to positioning against fluctuations in volatilities and correlations. The JPM research demonstrates that in every positive correlation phase analysed, these funds suffered far less compared to (the usual suspects) risk parity funds and we would expect this pattern to continue.
Overall, if we do see persistent ETF outflows there’s not only funds de-risking to worry about. If outflows drive equity markets lower, and bond-equity correlations turn positive we cannot rule out further plummeting in global markets and a persistent bear phase. The de-risking only further contributes to a downward spiral. Further cause for concern is the recent fast-paced sell- off in bond markets. If the positive correlation sets in, the impact on equity markets could be hard-hitting into the second half of 2018.
Finall, regarding hedge funds specifically, JPM notes:
Institutional investors including hedge funds are at least partly responsible for this extremity. Looking at the spec positions of various UST bond futures including 3- month Eurodollar (ED) futures, there was a broad-based decline over the past two weeks as speculative investors increased their overall short duration exposure to record lows.
And….
Who are these leveraged investors that raised their short duration positions so much YTD? Most likely Macro hedge funds. As we argued before in our trend-following framework, CTAs and other trend- following investors were already short the 10-year UST futures contract since December. And these momentum signals are approaching extreme levels raising the risk of mean reversion flows by those trend-following investors.
Source:
1 JPM, Flows and Liquidity, 2nd February 2018.


