“Davidson” submits:
A flurry of economic measures indicate that the US economy continues to expand even with the Fed placing additional roadblocks to Single-Family Home sector. My positive outlook remains decidedly contrarian to consensus.
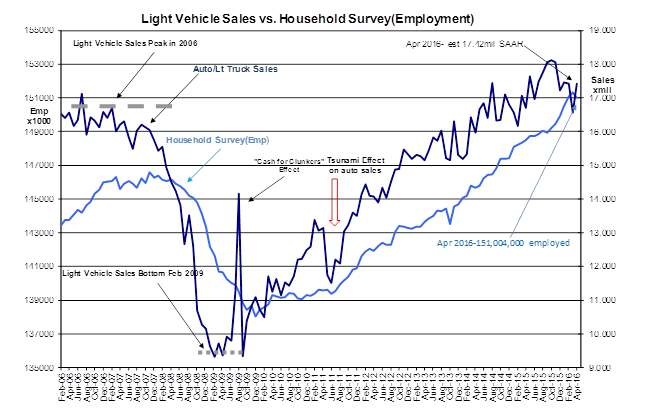
1) Vehicle Sales SAAR(Seasonally Adjusted Annual Rate) was reported at 17.42mil with theHousehold Survey Emp reported at 151,004(315,000 lower from March’s report). Trends reflect continued economic expansion. Good news.
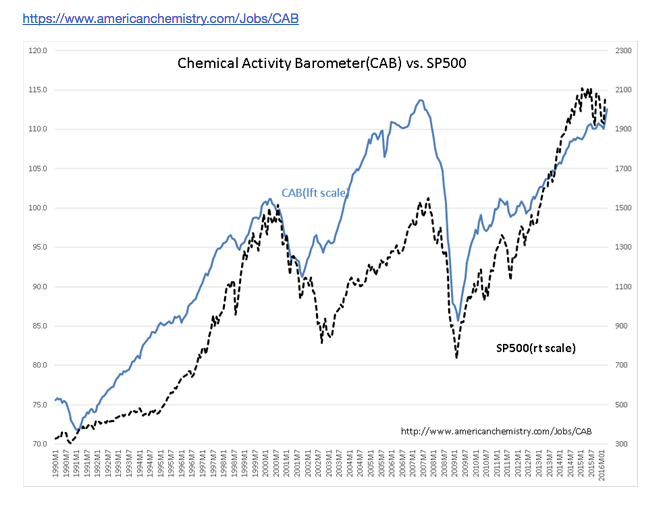
2) The CAB reported last week rose to 112.6. As an economic indicator which has been traced back to 1919, the CAB as a good history of reflecting the trend of US economic activity. The chart Chemical Activity Barometer(CAB) vs. SP500 reflects the strong correlation between this measure of economic activity and the SP500. With the CAB rising to 112.6, we should expect a higher SP500 in the months ahead. This economic indicator is a composite of indicators many of which are counts of things produced and transported. There is less dependence on the prices of goods and services which we see in other indicators such as Durable Goods Orders, Ind. Production, Hourly Wage Growth. All price based indicators suffer from inflation. When inflation is low, comparing different periods in price based indicators is almost always misleading. This is why inflation insensitive CAB, Employment and Vehicle Sales, which are physical counts of things, are providing positive economic readings while inflation sensitive Wage Growth, GDP, Retail Sales, Personal Income appear sluggish. The CAP trend indicates continued economic expansion. Good news.
3) Dallas Fed 12mo Trimmed Mean PCE inflation reported at 1.8%. This places the SP500 Value Investor Index’s level of 1,998 in close proximity to the SP500’s level of $2,050. In my research, it is Value Investors who historically provide pricing support. The SP500 is at a level which has been historically attractive to Value Investors. Good news even though Value Investors only comprise a relatively small percentage of investors.(The SP500 Value Investor Index is my proprietary index)
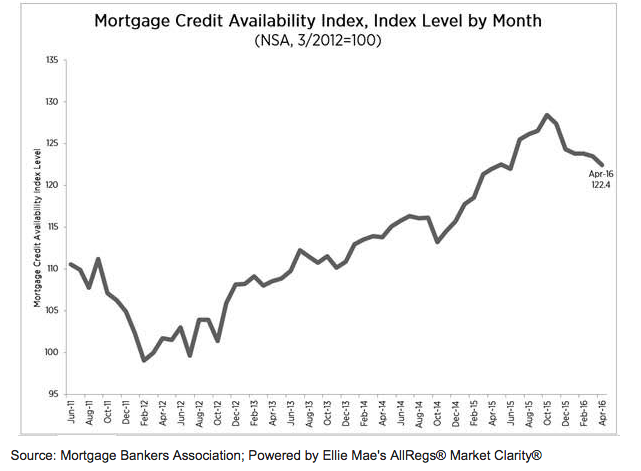
4) The Fed rate rise in Dec 2015 has resulted in a deteriorating Mortgage Credit Availability Index(MCAI). The MCAI remains at ~1/3 what appears to be the historical level. The credit spreads have narrowed making mtg lending less attractive to banks and the pace of Single-Family Housing continues at a sluggish pace while rent costs have risen to record levels. Lending continues for other sectors of the economy even if not robust for housing.
Economic activity is at all times a mosaic of multiple sectors and the consensus perception of this activity as usual is misperceived. Value Investors are contrarian to consensus. One feature of the current investment market is the presence of multiple large pools of leveraged capital which attempt to position themselves to achieve above market returns. These are Hedge Fund Momentum Investors. Experience reveals that they have been generally wrong on forecasting the economic trends most times and especially the past several years. They set and enhance trends not knowing that it is they who are doing this with little regard to economic fundamentals. They set the market psychology. What they bring to prices can be intense, especially when many are leaning in the same direction. We have seen this multiple times even in the current economic/investment cycle. The best means investors have in their tool kit is patience and to follow inflation adjusted economic measures. Fundamentals eventually drive market psychology and this in turn drives equity and bond prices.
Economic trends continue to be positive for equity investors in my opinion. By equities/avoid long term fixed income.