Bad News Is Good News: A Contrarian View of China Investing by Frank Holmes
When China celebrates its new year next month, we will transition into the Year of the Ram, also known as the Year of the Goat or Sheep. If you believe in luck, this could be a good sign. The ram comes eighth in the 12-zodiac cycle, and in Mandarin, “eight” sounds very similar to the words meaning “prosper,” “wealth” or, in some dialects, “fortune.” As you might imagine, the Chinese consider the number to be very lucky.
But of course successful investing involves so much more than luck. In a time when not only China but much of the rest of the world is trying to get its groove back, it’s important to be cognizant of the factors that shape the markets, including changing government policy. We often say that government policy is a precursor to change, so it’s important to follow the money.
With that in mind, I asked Xian Liang, portfolio manager of our China Region Fund (USCOX), to outline a few of the most compelling cases to remain bullish on the Asian giant.
Below are some highlights from our discussion.
A Healthy Balance Between Monetary and Fiscal Support
Back in October, I pointed out that one of the main contributors to the European Union’s sluggish growth is its inability to balance its monetary and fiscal policies. They have been eager to tax everything and everyone who moves. Waiting for European Central Bank (ECB) President Mario Draghi to act often feels a little like waiting for Godot. Investors’ patience is wearing thin.
China, on the other hand, is much more responsive and actively committed to making full use of both policies in its arsenal to spur its cooling economy.
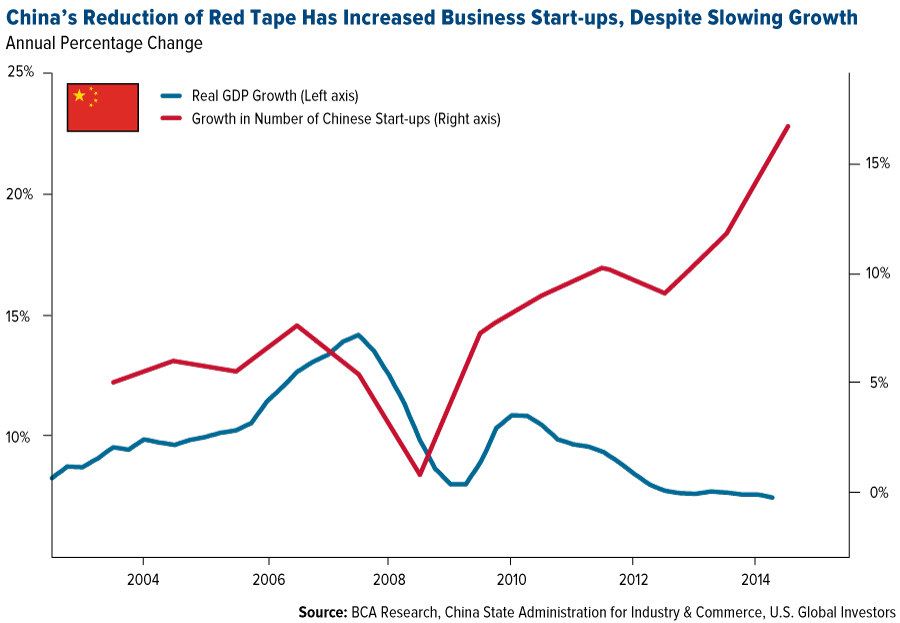
On the monetary side, according to Xian, are interest rate cuts and a loosening of reserve requirements for certain deposits. The goal is to ease access to loans for businesses and individuals seeking to purchase big-ticket items such as homes. As a result, Chinese entrepreneurs have increasingly been able to start more businesses.
Jobs growth has been so robust, in fact, that the government has managed to attain its job creation target outlined in its current Five-Year period ahead of schedule and by a wide margin. The country has managed to grow millions of jobs with great efficiency, even as GDP sags.
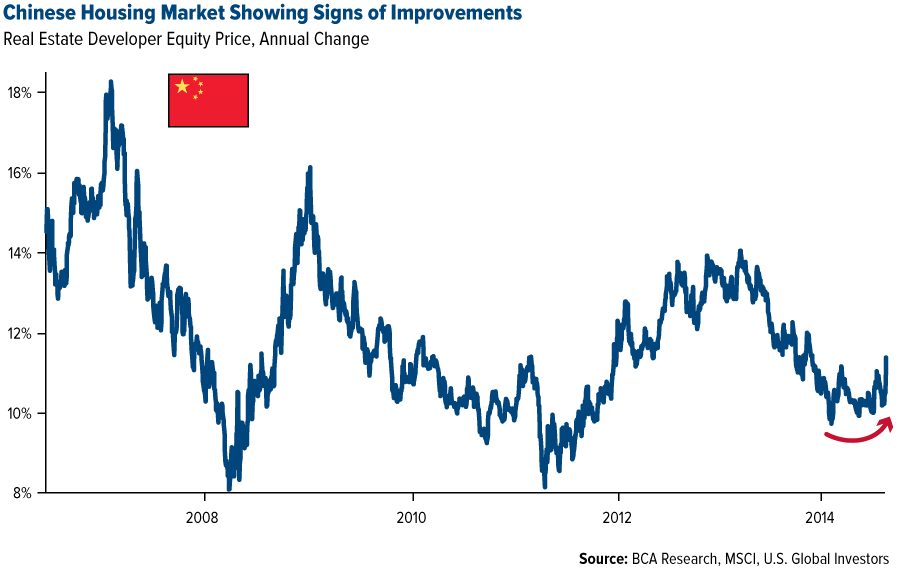
Although the Chinese housing market has stagnated in recent months, these new monetary measures will help it pick up steam. Already we’re seeing some improvement, with home property stocks moving higher.
Regulations are an indirect taxation of the economy, whereas deregulation unleashes entrepreneurial spirit.
On the fiscal front, the government is reportedly planning to spend $1.6 trillion over the next two years on infrastructure projects in various industries—300 separate infrastructure programs, to be exact, according to BCA Research.
As I pointed out last month, many of these projects will largely involve high-speed rail, both domestically and abroad. China has already secured multiple construction deals with countries ranging from Brazil, South Africa, Nigeria, India, Russia, the U.S. and others.
Government to Remain Accommodative
There are a couple of reasons the Chinese government has accelerated support to capital markets, according to Xian:
One, a significant deflationary threat has been driven by slumping energy prices. And two, there are potentially lower exports to commodity producing nations.
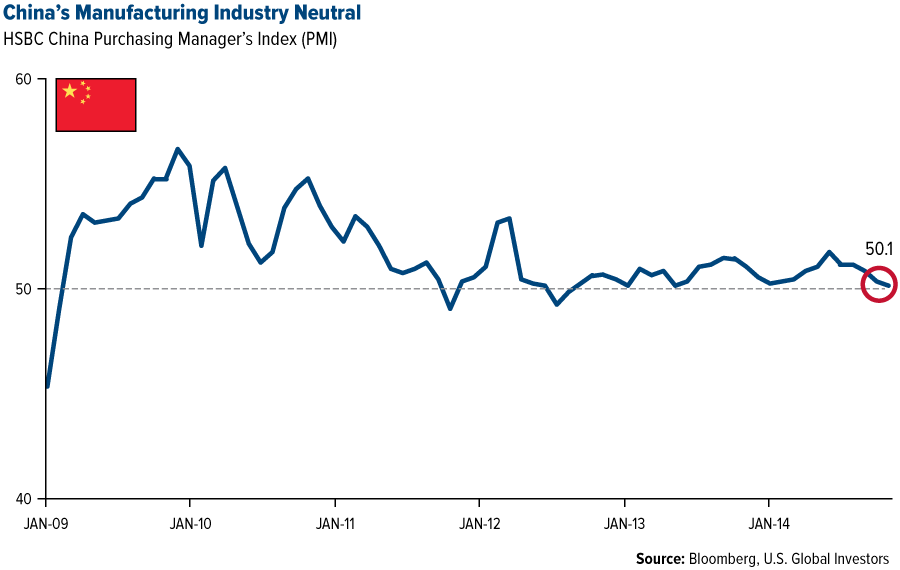
Indeed, sluggish global demand has contributed to China’s weak December purchasing manager’s index (PMI), which dropped to an 18-month low of 50.1. China has been quick to respond to lower PMI data with a drop in interest rates.
But Where There’s Bad News, Good News Is Often Not Far Behind
The silver lining to falling commodity prices is that since China is a net-importer of raw materials—crude oil especially—the country has been able to save tremendously on its oil and gas bills. Back in November, I reported that for every dollar the price of a barrel of oil drops, China’s economy saves about $2 billion annually. From its peak in June, crude has slipped close to $50—you do the math. This has served as a major wealth transfer from oil-producing countries into China’s coffers.
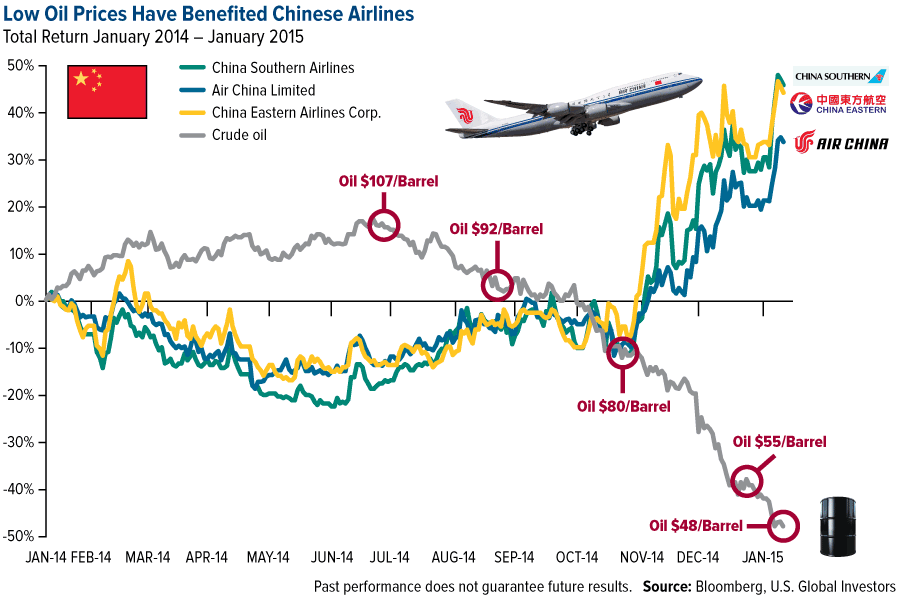
Oil Sinks, Airlines Take Flight
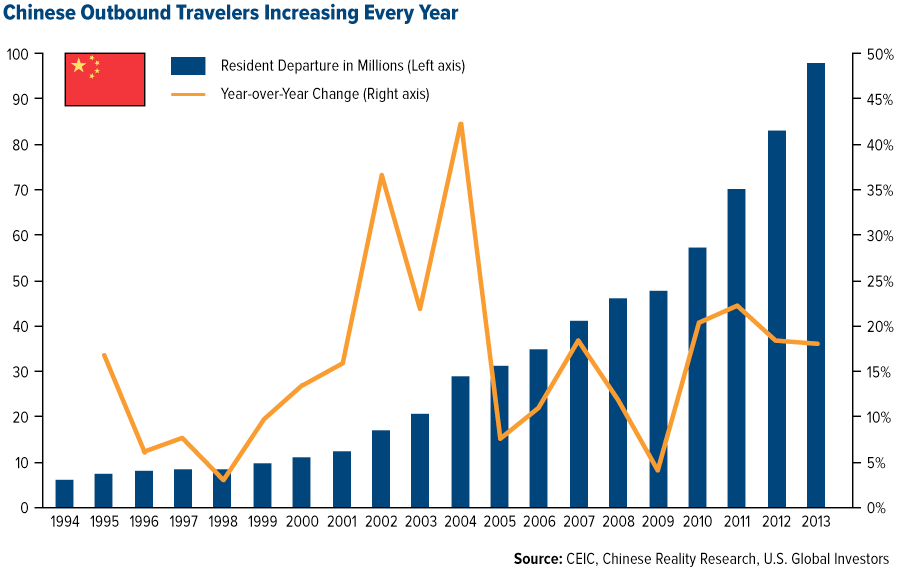
Speaking of crude, declining oil prices—they’re currently below $50 per barrel—have been good for airlines, Chinese companies included. As you can see, there’s been a clear inverse relationship between crude oil returns and airline stocks.
China is the largest investor in U.S. government bonds. It has accumulated close to $1.3 trillion, so a strong dollar and falling oil prices benefit its economic flexibility.
More middle-class Chinese might be able to afford to travel abroad, specifically here to the U.S., where inevitably they will spend their money.
According to Carl Weinberg, founder and chief economist of High Frequency Economics:
Chinese President Xi Jinping has estimated that there will be more than a half-billion Chinese tourists traveling to the West in the next 10 years. You can work out the impact if all of them came to New York and spent $2,000 or $3,000 each. That would be enough to add a half-percentage point to U.S. GDP every year over the next decade.
Reasonable Stock Valuation
Chinese stocks are currently valued below their own historical averages as well as those among other global emerging markets, making them both attractive and competitive.
“Odds favor mean reversion to continue,” Xian says. “The better the Chinese markets perform, the more global liquidity they might attract.”
Or, as Charter Trust Company Investment Advisor Mark Ungewitter puts it: “Every investor dreams of identifying cheap or reasonably-priced securities in the early stages of a bull market. Chinese equities may soon meet both criteria.”
As you can see below, Chinese stocks, as expressed in the MSCI China Index, are currently a much better value than those in the S&P 500 Index, trading at 10 times earnings whereas the U.S. is trading at 18 times.
Chinese A-Shares surprised the market by breaking out last summer, having delivered 66 percent for the 12-month period. It looks like a breakout from the long-term bear market.
What’s more, the upside is unlikely to have been exhausted. Although they aren’t as stellar of a bargain as they once were, they’re not yet overvalued, and retail and institutional investors might accumulate on pullbacks.
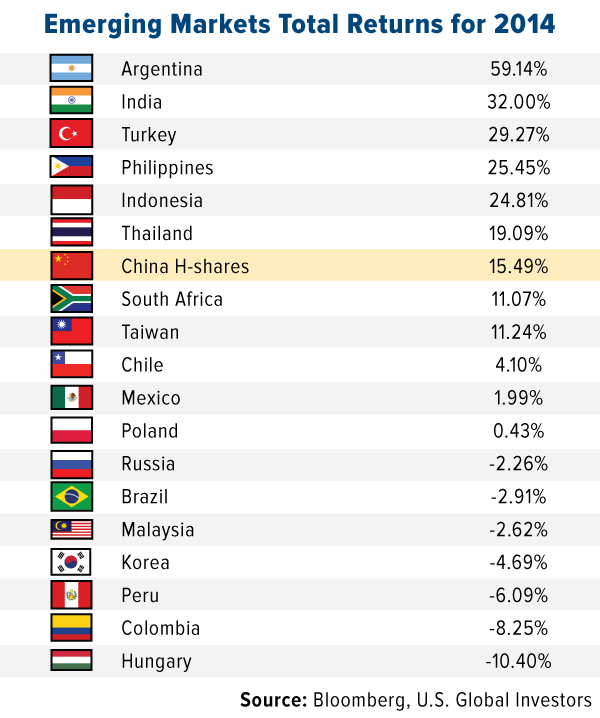
For the A-Shares market, USCOX has recently added exposure to A-Shares to capture more attractive valuation. In today’s environment, we believe the safer bets are investable H-Shares, which are driven by A-Shares and, in 2014, returned 15.5 percent. H-Shares comprise the vast majority of the fund’s exposure to Chinese equities, with further exposure gained through A-Shares exchange-traded funds (ETFs).
Above you can see merely a sampling of the ever-popular emerging markets period tables, which will soon be available exclusively to subscribers of our award-winning Investor Alert.
The Ram Is the New Bull
As GARP (growth at a reasonable price) hunters, we’re prudently optimistic about the upcoming year and anticipate good things out of the world’s second-largest economy. China’s government and central bank are committed to jobs and manufacturing growth as well as policy easing. Its stocks are reasonably valued, and low commodity prices should continue to offset slowing global demand.
As Xian eloquently put it last month:
China’s leadership appears to be delivering on the promises it made in November 2013 at the Third Plenary Session, specifically the liberalization of the financial sector and reform of the role capital markets play in allocating resources. This leadership is determined and committed to putting China on the right path.
A Special Announcement
Please mark your calendars for January 21, as we will be conducting our first webcast of the year. We will be discussing the state of commodities! As a loyal subscriber, you’ll be first to receive the registration next week. We’ll be following up with an emerging markets webcast on February 18 that will focus on China and Emerging Europe.
Index Summary
- Major market indices finished lower this week. The Dow Jones Industrial Average fell 0.54 percent. The S&P 500 Stock Index dropped 0.65 percent, while the Nasdaq Composite declined 0.48 percent. The Russell 2000 small capitalization index fell 1.10 percent this week.
- The Hang Seng Composite rose 0.17 percent; Taiwan fell 0.99 percent and the Kospi declined 0.09 percent.
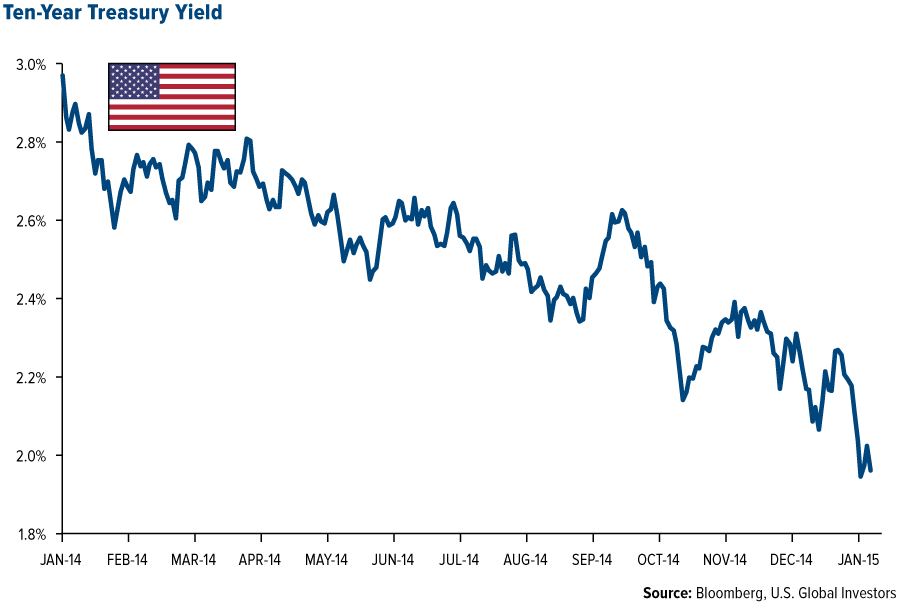
- The 10-year Treasury bond yield fell 15 basis points to 1.96 percent.
Domestic Equity Market
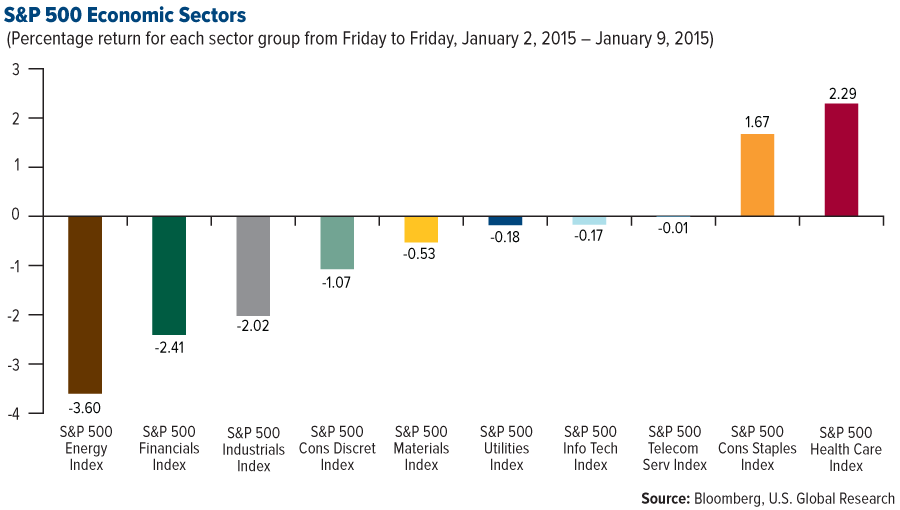
The S&P 500 pulled back 0.65 percent in a volatile, choppy week. Energy stocks remained under pressure as oil hit new lows. Cyclical stocks underperformed as global growth prospects remain uncertain and the Federal Reserve appears intent on raising interest rates sometime in mid-2015.
Strengths
- Health care stocks were the best performers this week with broad-based participation. Managed-care names like Cigna got a boost from better-than-expected Obamacare enrollments, while other names like Merck, Gilead Sciences and Pfizer all had strong performances.
- The consumer staples sector was also positive this week. Constellation Brands reported better-than-expected, third-quarter earnings and boosted its fiscal 2015 earnings estimates. Monster Beverage was also strong this week on robust industry-wide energy drink sales and positive expectations for the company’s investor meeting scheduled for next week.
- Boston Scientific was the best performing company this week, rising 10.82 percent. The company presented at an investor conference and was well received.
Weaknesses
- The energy sector was the worst performer this week as oil prices continued to fall and the overall sector experienced a broad-based sell-off.
- The financial sector also underperformed this week. Regional banks suffered as the yield curve continued to flatten, likely pressuring margins.
- The worst performing company this week was United Rentals, which fell 13.80 percent. The company was cut to a “sell” rating on Monday by an influential sell-side analyst, sending the shares down almost 11 percent on Monday.
Opportunities
- After outperforming in 2014, defensive stocks may be poised to continue that outperformance. The Fed appears intent on normalizing monetary policy and the bond market is responding by sending long-term yields lower. This movement implies that the market believes a tighter Fed will materially slow the economy.
- With gasoline prices continuing to fall, consumer discretionary and consumer staples sectors could stand to benefit in the weeks and months ahead.
- If oil can find a bottom and move higher, small and mid-cap energy stocks would be among the first beneficiaries.
Threats
- The rally for U.S. energy producers may be short lived as OPEC countries seem to be acting individually rather than as a collective cartel, making any prediction of their future actions more difficult. This could be positive, however, for the inverse-beneficiary companies in sectors such as airlines and consumer discretion.
- The ECB still hasn’t shown its cards on a plan to revive the European economy. If it plays a weak hand, Europe could end up in recession again.
- The broad equity market has been surprisingly tame over the past year and a 10-percent correction would be nothing out of the ordinary.
U.S. Government Securities Ultra-Short Bond Fund – UGSDX • Near-Term Tax Free Fund – NEARX
The Economy and Bond Market
U.S. Treasury bonds rallied again this week, sending yields lower across the curve. Deflation risk has turned into reality as consumer prices in the eurozone fell 0.2 percent year-over-year in December. It seems the Federal Reserve views this deflation as transitory and continues to prepare the market for rate hikes in mid-2015. In an interesting twist, this also seems to be sending yields lower. The market is afraid the Fed is going to slow the economy with rate hikes, while the long end of the yield curve is rallying.
Strengths
- The December employment report was strong with nonfarm payrolls growing to 252,000. This number is slightly better than expected and the unemployment rate fell to 5.6 percent.
- December same-store retail sales rose 5 percent and hitting an eight-year high, according to Retail Metrics. Lower gasoline prices and an improving employment picture are widely cited as the catalyst for these strong results.
- December U.S. auto sales rose to a very robust 10.8 percent.
Weaknesses
- Europe fell into deflation mode in December and while the European Central Bank (ECB) is expected to announce a quantitative easing (QE) program later this month, the risk remains that this will be too little too late.
- The U.S. nonmanufacturing ISM fell to 56.2 in December, which is the lowest level in six months and below expectations.
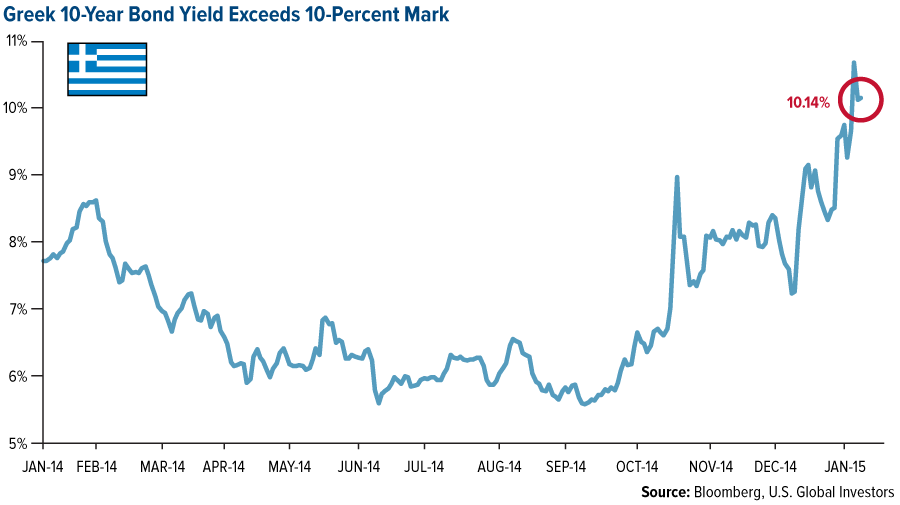
- Greece will hold early, “snap” elections later this month, raising the possibility of a “Grexit” from the euro, which could cause many unforeseen consequences.
Opportunities
- The ECB meets on January 22, and needs to show the market it is willing to act and implement an aggressive form of QE.
- Short-term bond yields have risen, but with many headwinds to raising interest rates, the Fed may not be able to follow through on the threat of interest rate increases in 2015, presenting an opportunity. This is a very similar scenario that played out a year ago.
- Municipal bonds continue to look like an attractive alternative in the broad, fixed-income universe.
Threats
- Greece is generating negative headlines again and while the news seems to be an isolated political event, it does reinforce the idea of the potentially fragile nature of the euro currency.
- Oil prices appear to be extremely oversold. A bounce in oil could change the mood throughout the market and bonds could sell off in reaction.
- The Fed’s next meeting is set for January 28, and if the hawkish tone continues, this could spook the market.
Gold Market
For the week, spot gold closed at $1,221.6 up $35.4 per ounce, or 2.96 percent. Gold stocks, as measured by the NYSE Arca Gold Miners Index, gained 9.43 percent. The U.S. Trade-Weighted Dollar Index gained 0.92 percent for the week.
| Date | Event | Survey | Actual | Prior |
|---|---|---|---|---|
| Jan 05 | German CPI YoY | 0.3% | 0.2% | 0.6% |
| Jan 07 | Eurozone CPI Core YoY | 0.7% | 0.8% | 0.7% |
| Jan 07 | US ADP Employment Change | 225K | 241K | 208K |
| Jan 08 | US Initial Jobless Claims | 290K | 294K | 298K |
| Jan 09 | US Change in Nonfarm Payrolls | 240K | 252K | 321K |
| Jan 09 | China Money Supply M2 YoY | 12.5% | — | 12.3% |
| Jan 12 | China Exports YoY | 6.0% | — | 4.7% |
| Jan 12 | China Imports YoY | -6.2% | — | -6.7% |
| Jan 15 | German GDP NSA YoY | 1.5% | — | 0.1% |
| Jan 16 | German CPI YoY | 0.2% | — | 0.2% |
| Jan 16 | US CPI YoY | 0.7% | — | 1.3% |
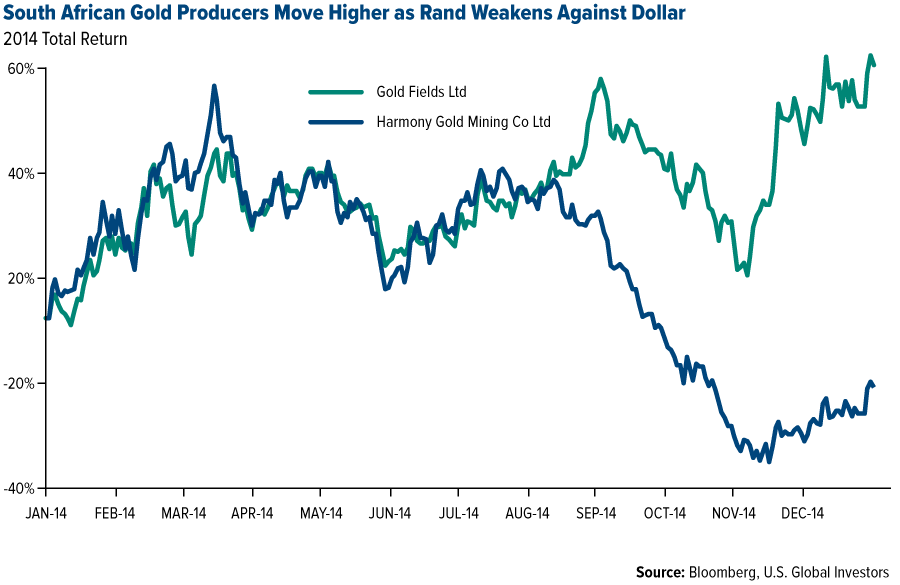
South African Gold Producers Surge as Weak Rand Translates to Higher Profit Margin
As seen in the graph, the strength of the dollar towards the end of 2014 caused gold to underperform in U.S. dollar terms, but the South African rand’s depreciation versus the dollar caused gold to outperform in rand terms.
Bad news is good news as a weakening of the rand versus the dollar towards the end of 2014 allowed South African gold companies, whose costs are in rand, to increase margins and profitability, causing their stocks to breakout.

click to enlarge
Meanwhile, Newmont and Barrick declined as much of their gold production is in the U.S
Strengths
- Bullish gold bets by hedge funds increased for the first time in three weeks and have more than doubled since mid-November. Concurrently, short holdings dropped for the sixth week in seven. These actions come as political turmoil in Greece and government actions in Asia have sent gold prices to their biggest monthly advance since June.
- HSBC raised its 2015 gold forecast to $1,234/oz from a prior $1,175 citing the possibility of increased gold demand should strength in the dollar lead to dislocation in the currency markets, along with enhanced geopolitical risk.
- The CME Group announced it is expecting to launch a one-kilogram gold physical delivery futures contract in Hong Kong on January 26. It will be tied directly to .9999 gold prices in Hong Kong and be physically delivered in Hong Kong to provide access to round-the-clock price discovery for the Asian gold market. Asia is the top consumer of physical bullion in the form of jewelry, bars and coins, but there is growing disenchantment with benchmark prices set in the West, which tend to be influenced by speculators. This new futures contract market will establish a price reference in the top consuming region and better reflect Asian demand.
Weaknesses
- Barrick Gold was downgraded to “Underperform” from “Neutral” at Macquarie Research and was given a 12-month target price of C$11.00. Additionally, RBC Capital Markets also downgraded the stock to “Sector Perform” from “Outperform” and cut its price target to $14 from $17. Reasons cited were uncertainty about the company’s debt and capital allocation.
- Rough diamond prices suffered the biggest quarterly decline in more than two years falling 6.9 percent in the last three months of 2014 as banks tightened credit to the industry, forcing traders, cutters and polishers to sell more inventory. Ed Sterck, analyst at Bank of Montreal, explained, “If you’re a cutter or polisher of rough whose available liquidity is being reduced you’ve got to adjust your inventory. Selling inventory to increase cash has the knock on effect of increasing the supply of polished diamonds.” Diamond output fell to about 146 million carats last year from a 2006 peak of 176 million carats as the industry faces a dearth of new projects. Sterck forecasts this to be a temporary six-month blip unless there are further reductions in liquidity.
- Declines in precious metals prices fueled a drop of more than $20 billion in commodity exchange-traded product holdings in 2014. The decline in value of global commodity ETF holdings was almost entirely driven by a fall in commodity prices, rather than investor outflows.
Opportunities
- While the dollar is up around 8.5 percent since the start of November, gold has risen around 7 percent and has broken free of its normal inverse correlation with the dollar. This reflects a near 50 percent fall in Comex fund shorts over this period, while the ongoing decline in gold ETFs appears to have bottomed. Furthermore, strong Indian and Chinese demand, and an unexpected physical squeeze in early December which drove one-month lease rates to six-year highs, have combined to underpin the spot market. Recent developments suggest gold’s 3.5-year correction from its third-quarter 2011 all-time highs may have now run its course.
- The fundamentals of the global gold market could point to modestly higher prices in 2015, according to commodities analyst Victor Thianpiriya from ANZ Bank who forecast gold prices to average around $1,238/oz. Thianpiriya believes gold has priced in a lot of the downside already, providing long-term investors with an attractive entry point.
- Big mining costs are expected to fall in first quarter 2015 as the fall in oil prices will have a positive effect on operating costs at mines employing diesel-powered equipment and particularly those which rely on oil-fueled generators. Energy consumption can account for as much as 40 percent of some mines’ operating costs, particularly those in remote locations which have no access to grid power.
Threats
- Despite continued physical demand in Asia, gold prices are expected to drop in 2015 according to analyst Suki Cooper from Barclays. She notes that gold’s correlation with oil prices and the euro/dollar has strengthened, hitting about 40 percent in the last three months. Combining that with her view of a U.S. interest rate hike in mid-2015 sets gold up for significant pressure. Cooper also highlighted that Russian gold reserves could be a risk to the market. Russia has been the largest purchaser of gold in recent years, but continued weak oil prices and the resulting pressure on the ruble could force it to make large gold sales. Barclays forecast gold to average $1,180/oz in 2015 and add that robust demand across both India and China would allow the metal to find a stronger floor.
- Black Swan Plc came out with its 2015 new year newsletter talking about how the BRIC (Brazil, Russia, India, China) countries are far closer to an alternative world financial system than the West believes or is prepared to state publicly. The building blocks of this go as follows: Expecting inflation to come back to the U.S. as a result of the QE programs, China has stopped buying U.S. debt. Instead, it and the other BRIC countries have set out to create various alternative financial institutions. One is the “BRICS Bank” which was formally brought into being in July 2014. While the initial shareholders are the BRICs, they do not rule out adding other participants in the future. The headquarters are in Shanghai. Another is the Asian Infrastructure Investment Bank (AIIB) which was first floated by China in October 2013. In November 2014, President Xi announced the doubling of the initial contribution from China to increase it to $100 billion. The initial group of countries which formed this bank are Bangladesh, Brunei, Cambodia, China, India, Indonesia, Kazakhstan, Kuwait, Laos, Malaysia, Mongolia, Myanmar, Nepal, Oman, Pakistan, Philippines, Qatar, Singapore, Sri Lanka, Thailand, Uzbekistan, and Vietnam. Then there is the Silk Road infrastructure fund which was announced by China in November 2014 with an initial contribution from China of $40 billion. The objective is to put in place the infrastructure to create a new Silk Road economic belt that will break the connectivity bottleneck, with investments in infrastructure for both land and sea. This puts an aggregate value, of China’s contributions only, for the three institutions of $340 billion. Compare this to existing institutions where IMF assets in special drawing rights (SDRs) are around $309 billion, The World Bank is $223 billion, Asian Development Bank is $163 billion. So in the space of 24 months China has put in place new financial institutions which, with contributions mainly from China, have nearly 50 percent of the assets of the existing major international financial institutions of the West. Add to that the steady increase in trade denominated in Renmimbi which will only be furthered by these institutions and the dollar will be pressured into an ever diminishing role as the world trade currency of choice.
- INTL FCStone has said iron ore will probably extend declines in 2015 as global supply exceeds demand and the world’s largest producers plan to continue adding production.
Global Resources Fund – PSPFX
Energy and Natural Resources Market
Strengths
- Precious metals and mining stocks jumped this week as economic and political uncertainty out of Europe, coupled with the increased likelihood of easing by the European Central Bank (ECB), increased the demand for alternative assets. The NYSE Arca Gold Miners Index and the Global X Silver Miners ETF rose 9 percent and 8 percent this week, respectively. Gold Fields Ltd. jumped 18 percent this week.
- Fertilizers stocks outperformed this week as natural gas prices continued to decline. The Bloomberg Leaders Fertilizers Index closed up 4 percent this week, while Yara International ASA jumped 15 percent.
- Packaged food stocks were a relative outperformer this week as the dollar continued its decline and positive global growth sentiment remained muted. The S&P Supercomposite Packaged Foods Index rose 1.4 percent this week.
Weaknesses
- Oil and gas drilling stocks stumbled this week as oil continued to decline and investors’ concerns over looming capital-expenditure cuts weighed on sentiment. The S&P Supercomposite Oil & Gas Drilling Index fell 8 percent this week.
- High-beta energy stocks suffered this week alongside global risk-off sentiment and lower energy prices. The S&P/TSX Capped Energy Index fell 7.3 percent this week.
- Contrary to what one would expect in the current environment, MLP stocks were a significant underperformer this week. The Alerian MLP Infrastructure Index declined 5 percent this week.
Opportunities
- After a 700 kbpd oil-supply surplus in 2014, analysts are forecasting a narrowing of oversupply moving forward. If a peak did occur, supply and demand dynamics could restore balance to oil prices.
- With inflation out of the eurozone coming in negative this week, it seems even more likely that the ECB will enact outright quantitative easing. Precious metals prices could rally in response to such a policy, due to the continuation of the global easing cycle as well as the intended rise in inflation that should result.
- China’s passenger vehicle sales are expected to grow at an average of 8 to10 percent over the next 10 years, and 2015 sales are anticipated to reach 20 million units, according to the country’s State Information Center.
Threats
- The United States government has been discussing the implementation of a gasoline tax to capture some of the benefits consumers have been experiencing as of late. The tax would reduce the multiplier effect that cheap gasoline prices have been having on the economy.
- The U.S. dollar has broken through key resistance points and is likely to continue its rise unless a rapid shift in global growth occurs. If the ECB officially begins quantitative easing the dollar could jump again.
Emerging Markets
Strengths
- Russian stocks bounced this week, gaining back some of the substantial losses the country experienced in 2014. OAO Sberbank, Russia’s largest lender, boosted the Micex index after Goldman Sachs. reported that the bank was best positioned to weather any storm Russia’s financial system may experience. The Micex index was up 8.50 percent in local currency terms.
- Brazilian equities and the real rallied this week, leading the charge this year as the first country to see a surge of “risk on” investor sentiment. The government announced this week that it had reduced its budget by more than a third of certain expenses. The fiscal tightening is aimed at restoring the country’s image to creditors in an effort to induce an economic recovery. The Ibovespa Brasil Sao Paulo Index and the real rose 0.68 and 2.16 percent this week, respectively.
- Turkey has been a substantial outperformer recently due to falling oil prices and the increasing probability of outright quantitative easing in the eurozone. Furthermore, the recent year-over- year CPI data, coming in slightly under a full percentage point below the prior months reading, has given policymakers more breathing room when it comes to adjusting interest rates. The Borsa Istanbul 100 Index closed up 2.56 percent this week.
Weaknesses
- Greek stocks continue to sell off as investors grow more anxious heading into the snap election at the end of the month. This week, the yields on 10-year Greek government bonds spiked up over 10 percent, signaling growing uncertainty in the country’s economy. The Athens Stock General Exchange Index fell 6.78 percent this week.
- Colombian equities declined this week as oil prices fell substantially to start the week. A highly oil leveraged country, Colombia has been among the worst performing emerging markets due to the oil price slump. The Indice General de la Blosa de Valores de Colombia fell 4.19 percent this week.
- Hungarian stocks and the forint fell this week as deflationary fears spread through Europe. Investors are forecasting the government will intervene to address the mounting deflation concerns, which would result in a weaker currency. The Budapest Stock Exchange Index and the Hungarian forint fell 2.47 percent and 1.06 percent this week, respectively.
Opportunities
- China’s lower than expected producer price inflation in December, coupled with little reprieve in falling crude oil prices, may raise Chinese policymakers’ awareness of deflation risk. Given the still elevated real interest rates domestically and a record high traded-weighted local currency, further monetary policy easing is increasingly likely. Chinese property developers historically delivered significant outperformance in easier credit cycles, and should continue to experience stock price rallies driven by valuation expansion.
- While policymakers disappointed investors last year by maintaining interest rates at current levels, Polish stocks bounced this week on renewed speculation that the government will lower rates to address the region’s deflationary pressures. A rate cut in Poland would stimulate economic activity in the country.
- With deflation finally infecting the eurozone once again, the likelihood of outright quantitative easing from the European Central Bank has risen. Such stimulative measures should prove beneficial to Turkish markets, which have benefited from global monetary easing polices.
Threats
- Macau’s disappointing gross gaming revenue growth in December together with Chinese President Xi Jinping’s recent advice for Macau’s economic diversification beyond casino gaming may continue to weigh on the city’s casino operators.
- Russia’s credit rating was downgraded by Fitch on Friday as analysts continue to forecast a more dismal 2015 for the stumbling economy. Despite the recent upticks in the Micex Index, Russian equities remain dangerously vulnerable to the current economic climate.
- With the election set for the end of the month, Greece is once again questioning its place within the Eurozone. If the far-left Syriza party should come into power, which is expected, much remains to be seen as to how the new government will cooperate with its foreign lenders.
Leaders and Laggards
The tables show the weekly, monthly and quarterly performance statistics of major equity and commodity market benchmarks of our family of funds.
| Index | Close | Weekly Change($) |
Weekly Change(%) |
|---|---|---|---|
| DJIA | 17,737.37 | -95.62 | -0.54% |
| S&P 500 | 2,044.81 | -13.39 | -0.65% |
| S&P Energy | 567.92 | -21.20 | -3.60% |
| S&P Basic Materials | 304.07 | -1.75 | -0.57% |
| Nasdaq | 4,704.07 | -22.75 | -0.48% |
| Russell 2000 | 1,185.59 | -13.21 | -1.10% |
| Hang Seng Composite Index | 3,313.60 | +5.62 | +0.17% |
| Korean KOSPI Index | 1,924.70 | -1.74 | -0.09% |
| S&P/TSX Canadian Gold Index | 166.31 | +15.03 | +9.94% |
| XAU | 76.17 | +5.66 | +8.03% |
| Gold Futures | 1,221.60 | +35.40 | +2.98% |
| Oil Futures | 48.22 | -4.47 | -8.48% |
| Natural Gas Futures | 2.97 | -0.04 | -1.20% |
| 10-Yr Treasury Bond | 1.96 | -0.15 | -7.11% |
| Index | Close | Monthly Change($) |
Monthly Change(%) |
|---|---|---|---|
| DJIA | 17,737.37 | +204.22 | +1.16% |
| S&P 500 | 2,044.81 | +18.67 | +0.92% |
| S&P Energy | 567.92 | +12.29 | +2.21% |
| S&P Basic Materials | 304.07 | +3.21 | +1.07% |
| Nasdaq | 4,704.07 | +20.04 | +0.43% |
| Russell 2000 | 1,185.59 | +23.72 | +2.04% |
| Hang Seng Composite Index | 3,313.60 | -332.01 | -14.83% |
| Korean KOSPI Index | 1,924.70 | -20.86 | -1.07% |
| S&P/TSX Canadian Gold Index | 166.31 | +15.39 | +10.20% |
| XAU | 76.17 | +5.17 | +7.28% |
| Gold Futures | 1,221.60 | -7.80 | -0.63% |
| Oil Futures | 48.22 | -12.72 | -20.87% |
| Natural Gas Futures | 2.97 | -0.74 | -19.94% |
| 10-Yr Treasury Bond | 1.96 | -0.20 | -9.42% |
| Index | Close | Quarterly Change($) |
Quarterly Change(%) |
|---|---|---|---|
| DJIA | 17,737.37 | +1,193.27 | +7.21% |
| S&P 500 | 2,044.81 | +138.68 | +7.28% |
| S&P Energy | 567.92 | -45.81 | -7.46% |
| S&P Basic Materials | 304.07 | +12.39 | +4.25% |
| Nasdaq | 4,704.07 | +427.83 | +10.00% |
| Russell 2000 | 1,185.59 | +132.26 | +12.56% |
| Hang Seng Composite Index | 3,313.60 | +134.08 | +4.22% |
| Korean KOSPI Index | 1,924.70 | -16.22 | -0.84% |
| S&P/TSX Canadian Gold Index | 166.31 | +3.71 | +2.28% |
| XAU | 76.17 | -1.09 | -1.41% |
| Gold Futures | 1,221.60 | -0.70 | -0.06% |
| Oil Futures | 48.22 | -37.60 | -43.81% |
| Natural Gas Futures | 2.97 | -0.89 | -23.11% |
| 10-Yr Treasury Bond | 1.96 | -0.32 | -14.03% |
Please consider carefully a fund’s investment objectives, risks, charges and expenses. For this and other important information, obtain a fund prospectus by visiting www.usfunds.com or by calling 1-800-US-FUNDS (1-800-873-8637). Read it carefully before investing. Distributed by U.S. Global Brokerage, Inc.


