This stock lacks the revenue growth potential of some biotech peers, but it also lacks the cash burn and often binary uncertainty. It bears closer resemblance to a traditional pharma stock with biotech characteristics. Given the company’s industry leading position, solid fundamentals and attractive stock valuation, we view it as a preferable alternative to traditional drug stocks. It offers lower-risk exposure to biotech innovation as an added bonus. Amgen Inc. (AMGN: $163/share) is this week’s Long Idea and on May’s Most Attractive Stocks list.
Solid Revenue and Profit Growth (NOPAT)
Over the past 15 years AMGN has increased after-tax profit (NOPAT) by 16% compounded annually to nearly $9 billion, per Figure 1. Revenues increased 12% compounded annually to $23 billion over the same period, while NOPAT margin increased to 37% in 2016 from 24% in 2002. Over the past five years, revenue growth has moderated to 8% annually. NOPAT growth, however, remained strong at 14% compounded annually due to more significant profit margin increases. NOPAT margin increases averaged +2% per year over the past five years compared to the 15-year average of +1% per year, largely due to process improvement and manufacturing efficiency initiatives.
Figure 1: AMGN 15-Year Revenue & Profits
Sources: New Constructs, LLC and company filings
In addition to impressive top- and bottom-line growth, free cash flow (FCF) generation has ramped up meaningfully. Over the past five years, AMGN has generated $22 billion of cumulative free cash flow, 18% of current market cap. The $10 billion of FCF generated over the trailing-twelve months (TTM) equates to an 8% free cash flow yield which is in the second quintile of our 3,000+ stock coverage universe.
Rising Stakeholder Returns (ROIC)
Consistent growth, margin improvement and prudent investment of capital have combined to drive return on invested capital (ROIC) higher over time. Since the $16 billion acquisition of Immunex in 2002, which increased invested capital 7x, ROIC has increased from a low of 9% to 21% in 2016. AMGN’s trailing-twelve months ROIC of 22% is top-quintile among our coverage universe, compares favorably to top biotech firms (median 19% ROIC) and far exceeds large cap pharmaceutical companies (median 9% ROIC).
Figure 2: AMGN 15-Year NOPAT Margin and ROIC

Sources: New Constructs, LLC and company filings
Per Figure 3, ROIC explains 56% of the valuation difference between AMGN and a peer group of ten large cap pharmaceutical stocks. Despite AMGN’s 22% ROIC, more than double the 10% peer average, the stock trades at a discount as shown by its position below the trend line in Figure 3. If AMGN traded at parity with the group, it would be $193/share – 18% above the current price. Given AMGN’s better ROIC and long-term growth potential, one would think the stock would garner a premium valuation to the group.
Figure 3: ROIC Explains 56% of Valuation for Drug Stocks

Sources: New Constructs, LLC and company filings
Leading Profitability Reflects Competitive Advantage
Per Figure 4 below, AMGN’s 82% gross margin lies between pharmaceutical (71% median) and biotech (90% median) peers, while a lean cost structure and operational efficiency drive a meaningful bottom line advantage in the NOPAT margin. During 2016, SG&A and R&D expenses consumed 39% of AMGN’s total revenue compared to 47% for pharmaceuticals and 54% for biotech, resulting in a 37% NOPAT margin for AMGN vs. 20-22% for peers. This operational efficiency advantage should allow AMGN, if necessary, to absorb competitive or political drug pricing pressures and ratchet up R&D spending without sacrificing its bottom-line ROIC advantage over peers.
Figure 4: AMGN Profit Margins (TTM) vs. Pharma & Biotech Peers

Sources: New Constructs, LLC and company filings
Bear Case Risks: Competitive Pricing Pressure, Slowing Key Drug Growth
The broader drug sector could face pricing pressure from further payer consolidation among insurance companies and pharmacy benefit managers, which increases buyer pricing power. More specifically for AMGN, one of its more mature, cash cow drugs (Enbrel) is starting to experience slowing prescription growth after 15 years on the market. AMGN’s 1Q17 Enbrel unit sales were further impacted by increased competition from inflammation segment rivals AbbVie (ABBV), Celgene (CELG) and Johnson & Johnson (JNJ).
Bears are focused on a legitimate risk given Enbrel’s percentage of overall sales (22% in 1Q17 vs. 25% in 1Q16). The bear case boils down to slowing revenue growth resulting in share price underperformance, and AMGN shares are down roughly 11% over the past two months on such concerns. We think the market is extrapolating one quarter’s results too far into the future and overlooking the potential of AMGN’s newer drugs and pipeline. We are willing assume such a slowdown proves transitory and would utilize recent price weakness to accumulate shares given valuation levels.
Enbrel demand is expected to rebound over the balance of the year based on more recent IMS Health monthly prescription data. This could largely offset the main bear point of contention. From a longer-term perspective, we think the combination of newer drugs and a promising pipeline will offset the performance of more mature drugs and drive continued top-line growth for AMGN. Newer growth drugs Prolia, Kyprolis, Sensipar, Repatha, etc. accounted for over 16% of 1Q17 sales and collectively grew 25% over the prior year.
Assuming an immediate 10% hit to revenue and drop in NOPAT margin to the 15-year average of 30%, NOPAT (TTM) would decline 29% to just over $6 billion. Even under this drastic scenario, ROIC of 16% remains comparable to biotech peers (19%) and well above pharmaceutical peers (9%). Over the past 15 years, AMGN’s R&D pipeline has driven average annual sales increases of over $1 billion. At that pace, the company could recoup an immediate 10% hit to revenue in just over two years.
Valuation Implies End of Growth, Permanent Profit Decline
At the current price of $163/share, AMGN has a price-to-economic book value ratio (PEBV) of 0.9. The means the market expects AMGN’s NOPAT to permanently decline by 10%. This seems overly pessimistic for a company that has grown NOPAT at a mid-teen rate for over 15 years and whose R&D efforts have produced several new potential blockbusters in recent years.
If AMGN were to never grow after-tax profits from current levels, current economic book value, or no growth value of the firm, is $177 per share – 9% above the current price.
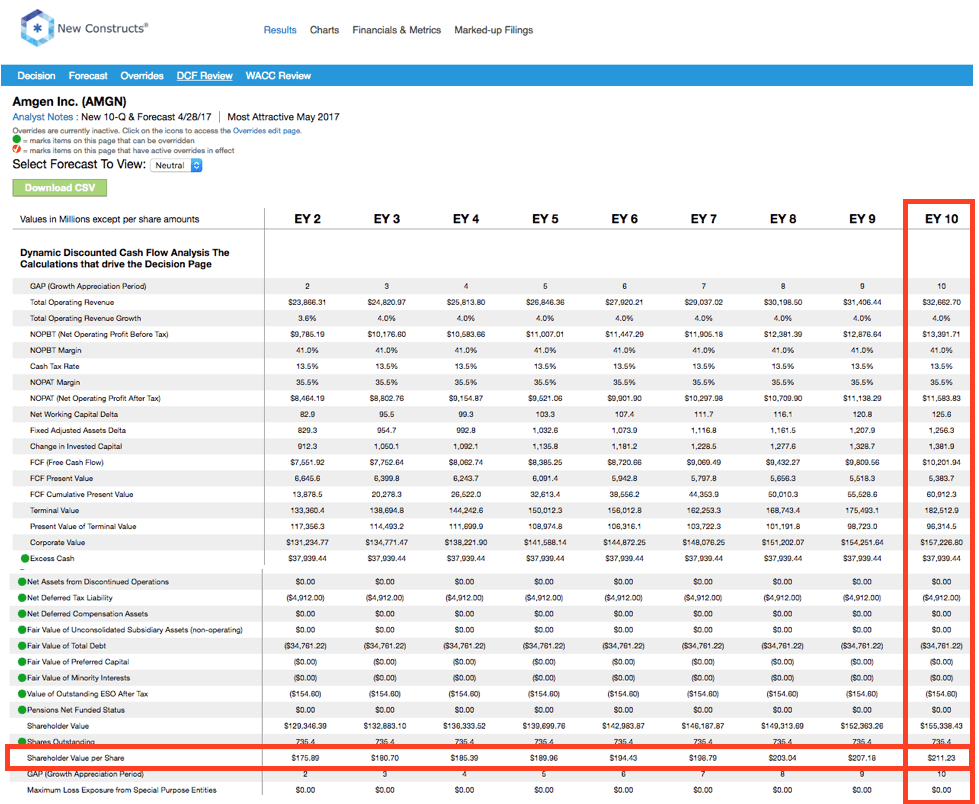
If AMGN can maintain NOPAT margins of at least 35% (below TTM margins of 38%) and grow NOPAT by just 3% compounded annually over the next ten years, the stock is worth $211 today – 29% above the current price. This assumes AGMN will grow revenues by consensus in 2017 (0%) and 2018 (4%) and 4% annually thereafter. For reference, AMGN has grown revenue by 8% compounded over the past five years, and 5% compounded annually over the past decade. Add in the nearly 3% dividend yield and its clear why AMGN could be an excellent portfolio addition.
Out of 2016’s $10 billion of free cash flow, $4 billion was invested in R&D, $3 billion was paid in dividends and $3 billion went to share buybacks. The remaining repurchase authorization of $3.5 billion combined with 1Q17 dividend and buyback activity point to another year of roughly $6 billion returned to shareholders. This represents a total yield of 5% with a cash dividend yield of just below 3% at current prices. AMGN’s FCF generation and ability to return 60% to shareholders, while still heavily investing in R&D, makes AMGN an attractive dividend growth stock. The current quarterly dividend of $1.15 per share has grown 26% compounded annually over the past five years.
Potential Catalysts: New Drug Growth, Robust Pipeline, Acquisitions
Competitive pricing pressure across the bio/pharma drug sector is causing firms to focus on: 1) driving increased sales volume (“Our orientation is long-term volume-driven growth.” – AMGN management); and 2) ramping up R&D to find lucrative new drugs and treatments for niche markets. In regards to the latter, we think AMGN is well positioned for success given its large-scale and well-developed R&D efforts across six therapeutic niches: cardiovascular, oncology/hematology, bone health, neuroscience, inflammation and nephrology.
Another potential catalyst is growth in “branded biosimilars,’ which are effectively the biotech equivalent of generic drugs. The market is in its nascent stages with four biosimilars approved by the FDA and only two on the market. AMGN is already feeling the impact of biosimilar competition, as noted earlier, but we think the long-term potential outweighs the risks. The company’s deep experience in the biologics development, testing and approval process combined with best-in-class biotech manufacturing capabilities could position AMGN as a market leader.
An example of the potential is AbbVie’s (ABBV) Humira, a rheumatoid arthritis treatment with $16 billion of annual sales. Humira lost key patent protections at the end of 2016 while AMGN received FDA approval for its biosimilar Amjevita in September, 2016. U.S. biosimilars legislation was designed to allow for patent litigation, and ABBV’s efforts to stall AMGN are expected to delay Amjevita’s launch until 2018.
Putting some of the $38 billion of excess cash (32% of market cap) to work via M&A could also boost growth. While there is good reason to be generally skeptical of acquisitions, deals such as Immunex (2002) and Onyx (2013) have benefitted AMGN shareholders, as evidenced by the company’s steady uptrend in ROIC. Since 2012 year-end, AMGN has invested an incremental $9 billion of capital ($10 billion paid for Onyx). Over the four-year period of 2013-2016, AMGN generated over $3 billion of incremental NOPAT equating to an incremental ROIC of 36%. While this performance was not entirely attributable to the acquisition, it appears these deals have been very good for shareholders.
The most recent proxy states: “We recognize that stockholders…require an appropriate return on the capital they commit to Amgen.” The intent is laudable and AMGN’s earnings/stock price performance over time speaks for itself. The executive compensation plan, however, could be better aligned with shareholders by tying management compensation directly to ROIC. AMGN’s current annual incentives are tied to revenue targets (30%), non-GAAP net income (30%), clinical and regulatory execution (20%), product and system launch execution (10%) and early pipeline advancement (10%).
We know from Figure 3 above, and multiple case studies, that ROIC is directly correlated to changes in shareholder value. Use of ROIC to measure performance ensures executives’ interests are aligned with shareholder’s interests. In the case of AMGN, there has been no profiting from misleading metrics while shareholder value is destroyed. Over the past 15 years, economic earnings have grown from $566 million to $6.0 billion (17% annually), a clear indication of shareholder value creation.
Insider Trading and Short Interest
There is little insight to be gained from recent insiders or short seller trends. Over the past 90 days, insiders have purchased 219,000 shares in 34 trades and sold 83,000 shares in 15 trades. There are currently 8 million shares sold short equating to <1% of shares outstanding and 3 days to cover. Short interest is up 2 million shares since year end but is little changed from a year ago.
Footnotes Adjustments and Forensic Accounting
Our Robo-Analyst technology enables us to perform forensic accounting with scale and provide the research needed to fulfill fiduciary duties. In order to derive the true recurring cash flows, an accurate invested capital, and an accurate shareholder value, we made the following adjustments to AMGN’s 2016 10-K:
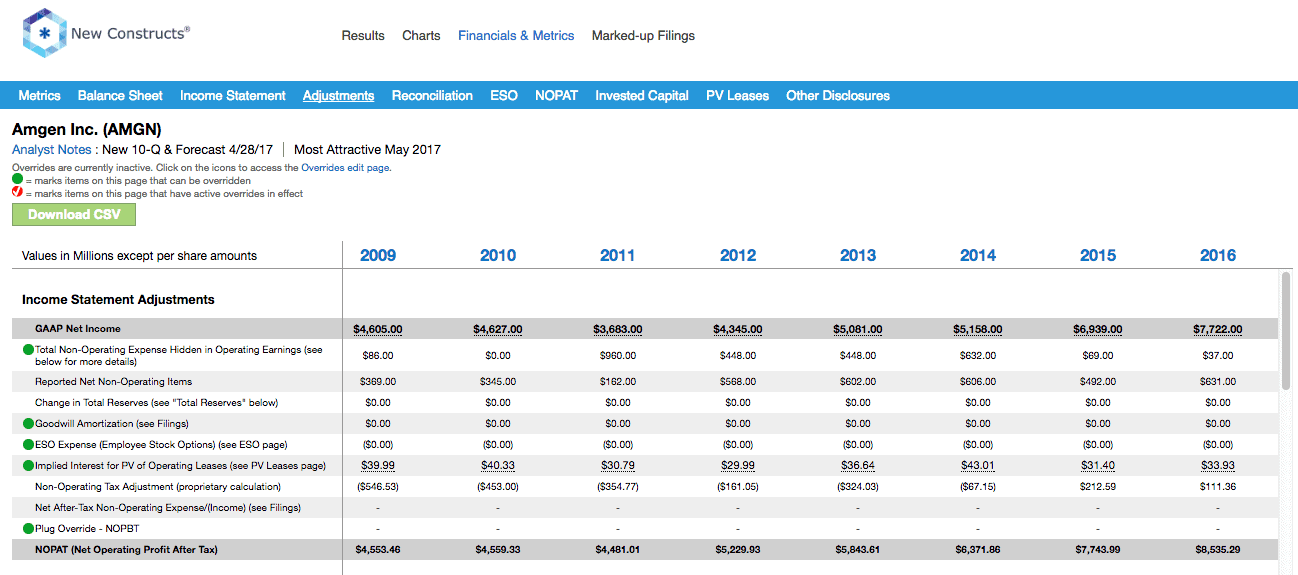
Income Statement: we made $2.1 billion of adjustments, with a net effect of removing $813 billion in non-operating expense (3.5% of revenue). We removed $629 million in non-operating income and $1.4 billion in non-operating expenses. You can see all the adjustments made to AMGN’s income statement here.
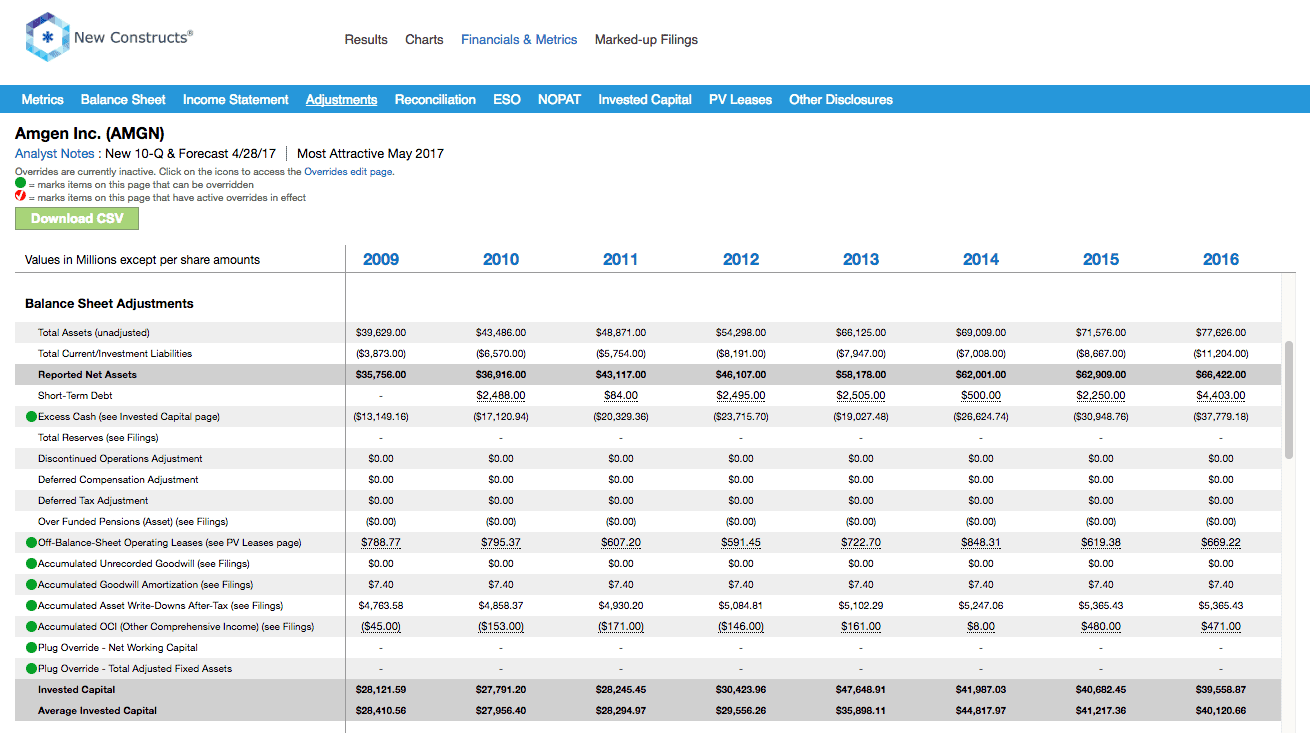
Balance Sheet: we made $49.8 billion of adjustments to calculate invested capital with a net decrease of $26.3 billion The largest adjustment was $5.4 billion due to asset write-downs. This adjustment represented 8% of reported net assets. You can see all the adjustments made to AMGN’s balance sheet here.
Valuation: we made $78 billion of adjustments with a net effect of decreasing shareholder value by $2 billion. The most notable adjustment was $4.9 billion in net deferred tax liabilities (DTLs). This adjustment represents 4% of AMGN’s market cap. Despite the net decrease in shareholder value, AMGN remains undervalued.
Attractive Funds that Hold AMGN
There are no funds that receive our Attractive-or-better rating and allocate significantly to Amgen Inc. (AMGN).
This article originally published on May 8, 2017.
Disclosure: David Trainer, Kyle Guske II and Kenneth James receive no compensation to write about any specific stock, style, or theme.
Article by Kenneth James, New Constructs


