
S&P 500 yet again kept declining through the day, and Treasuries offered a bleak sight till shortly before the close when long-dated ones turned finally higher – and both tech and value followed suit.
Nothing spectacular, Jun lows in S&P 500 were tested (and in the Russell 2000 nearly touched) – 50 points late day reversal doesn‘t signify anything as we haven‘t reached THE low yet in my view.
It‘s not about plain stock market seasonality where the very beginning of October is rife with heavy selling – it‘s that markets Friday sold off as no hint of a rescue from Powell came about during his brief speech. The Pavlovian dogs were disappointed.
Q2 2022 hedge fund letters, conferences and more
Find A Qualified Financial Advisor
Finding a qualified financial advisor doesn’t have to be hard. SmartAsset’s free tool matches you with up to 3 fiduciary financial advisors in your area in 5 minutes.
Each advisor has been vetted by SmartAsset and is held to a fiduciary standard to act in your best interests.
If you’re ready to be matched with local advisors that can help you achieve your financial goals, get started now.
There is further evidence that the current downleg is rather orderly, and not reaching any panicky levels whatsoever. Apart from VIX keeping even above 30 only, it‘s the relationship between stock prices and the CNN Fear and Greed Index (chart courtesy of MacroMicro):
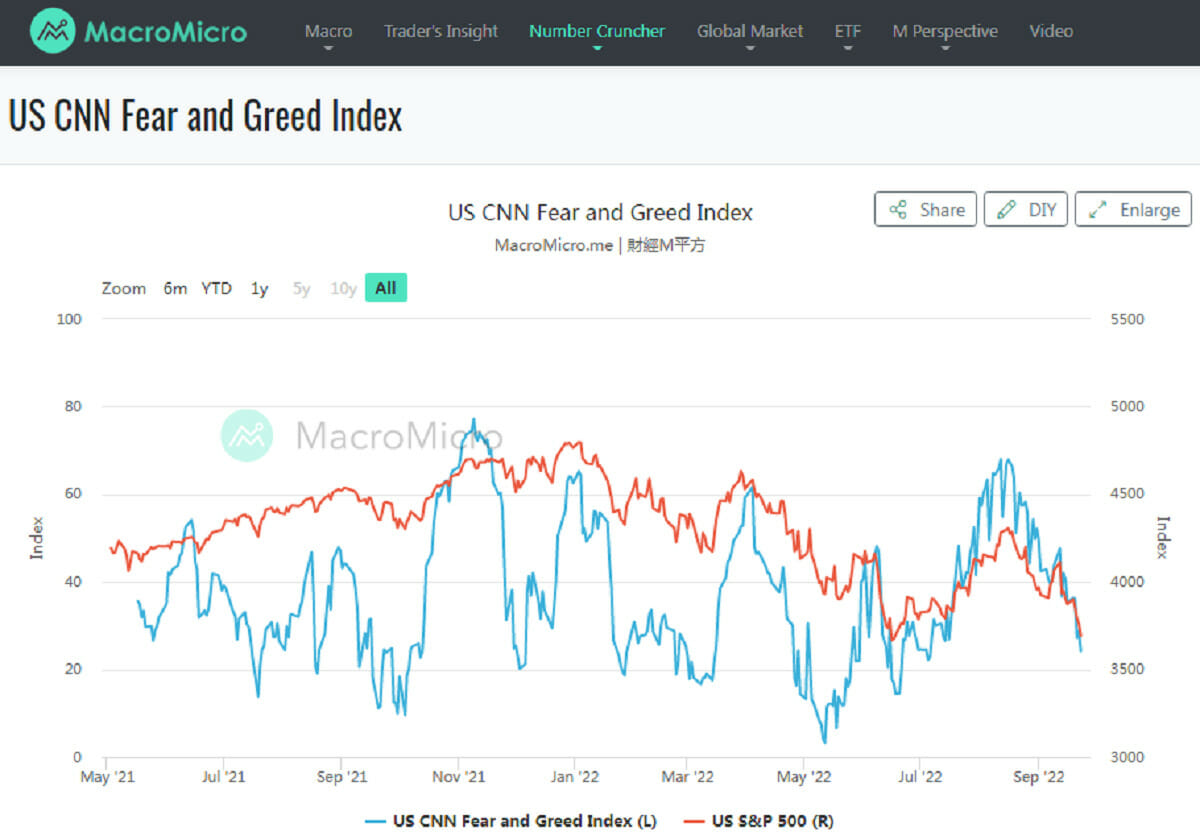
See for yourself how bullish the sentiment was while we were running to the 200-day moving average, and how complacent it is now as relates to the S&P 500 prices – remember this while hearing elsewhere about any triple digit uplegs.
The bear hasn‘t run its course, and we‘ve taken the most bearish route shown in my mid Aug refutal of bull market thesis. It‘s my view that the nearest weeks won‘t be too easy, and that I don‘t see too much respite in stocks. The (comparatively shallow) rips are to be sold.
As I wrote in Friday‘s concise yet important article on bonds, the question of a peak in long-dated Treasury yields is the key one. As the Fed has vacated the market and foreign buyers aren‘t exactly aggressively buying (the trade balances have reversed for both Europe and Japan, while Russia and China have their sights elsewhere), it‘s up to instituitional and retail investors to snap up any bargains.
These would be of course driven by real economy evidently entering recession – we aren‘t quite there yet, but there is progress as spelled out a week ago.
The idea is that deteriorating real economy prospects would not only get reflected in decrease in long-dated yields, but over time also cut short Fed tightening through providing it with cover to get at least neutral if not somewhat accommodative again, no matter the stage of its fight against the sticky inflation (which the central bank would lose after making meaningful progress throughout this winter). This ties in well with the recent question I got:
Q: Monica, since the 10 yr treasury has been going up, so has Fund RRPIX (Rising Rates fund). Do you see that continuing? Thanks!
A: Indeed the long end of the curve (20-30y) is the key here. FOMC – yields retreated, Thursday TLT went a lot down, and was balancing on the edge on Friday. At least it recovered, for if no fresh buyers emerge to replace the Fed and foreigners, we’re in for trouble.
It‘s my view that over the nearest two months, we would see the long end of the curve catching a solid bid.
This is tying in well with the recent peak in goods inflation, which will be shortly followed with a peak in services inflation, and that will have consequences for both rents (owners‘ equivalent rent is a third of CPI, and its peak would help the Fed get its foot off the tightening pedal) and wage inflation (small and medium enterprises aren‘t on a hiring spree exactly).
This spells a peak in inflation, and facilates a turn in Fed policy several quarters down the road. For now, I‘m looking for 75bp hike in Nov and maybe 50bp in Dec, which could very well be the end of the rate raising cycle. That would be a truly restrictive level, and they want to keep it there for quite some time to avoid the 1970s mistake.
The Fed probably believes that keeping rates slighly restrictive for long enough to beat inflation, will avoid tipping the economy into a recession – it remains to be seen whether either of these two propositions work out, becase the Fed would be in a pickle if during 2024 inflation would still run above say 4%..
I‘m discussing the market impact of the above within the individual chart sections – rich annotations and comments – in place of upcoming shorter analyses. Where would I hide in the long-term – thinking this decade? This timeless mid April article sheds light on assets and sectors worth your attention.
Keep enjoying the always lively Twitter feed serving you all already in, which comes on top of getting the key daily analytics right into your mailbox. Plenty gets addressed there, but the analyses (whether short or long format, depending on market action) over email are the bedrock.
So make sure you‘re signed up for the free newsletter and that you have Twitter notifications turned on so as not to miss any tweets or replies intraday.
Let‘s move right into the charts (all courtesy of www.stockcharts.com) – today‘s full scale article features good 6 ones.
Gold, Silver and Miners
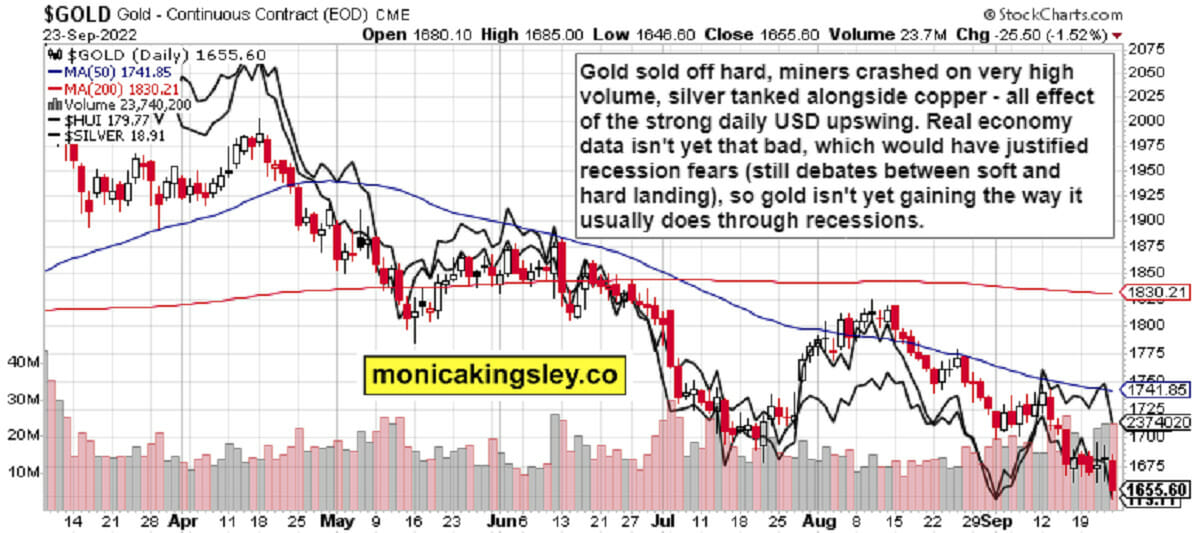
Precious metals are to sniff out the upcoming Fed turn, but their 2022 performance would continue being bleak. It‘s often the case that at the beginning of economic woes striking, both gold and silver are taking in on the chin alongise much else – just like we have seen in real assets on Friday.
That‘s the result of the strong dollar upswing, and hawkish Fed (both perception and reality). Major buying opportunity approaches, but it isn‘t here quite yet – then, gold has good support at $1,610.
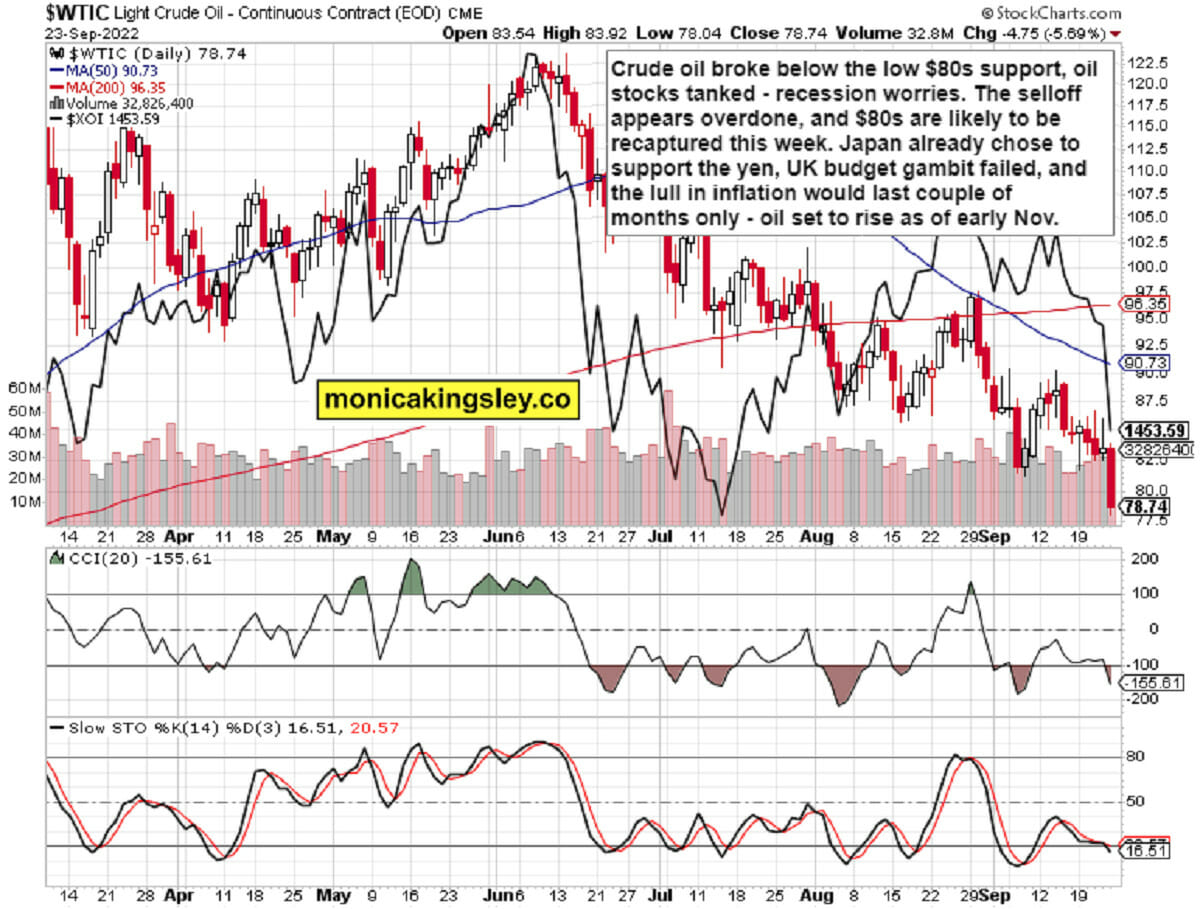
Crude Oil
Crude oil fell through the $80s floor, and has quite some crawling back to do. The physical market is to provide support, which would be met by real economy performance and demand destruction fears underpinning the dollar.
Black gold still needs to consolidate before launching higher in some 5 weeks max (yes, probably shortly before midterms) – or earlier if China‘s demand destruction during lockdowns returns.
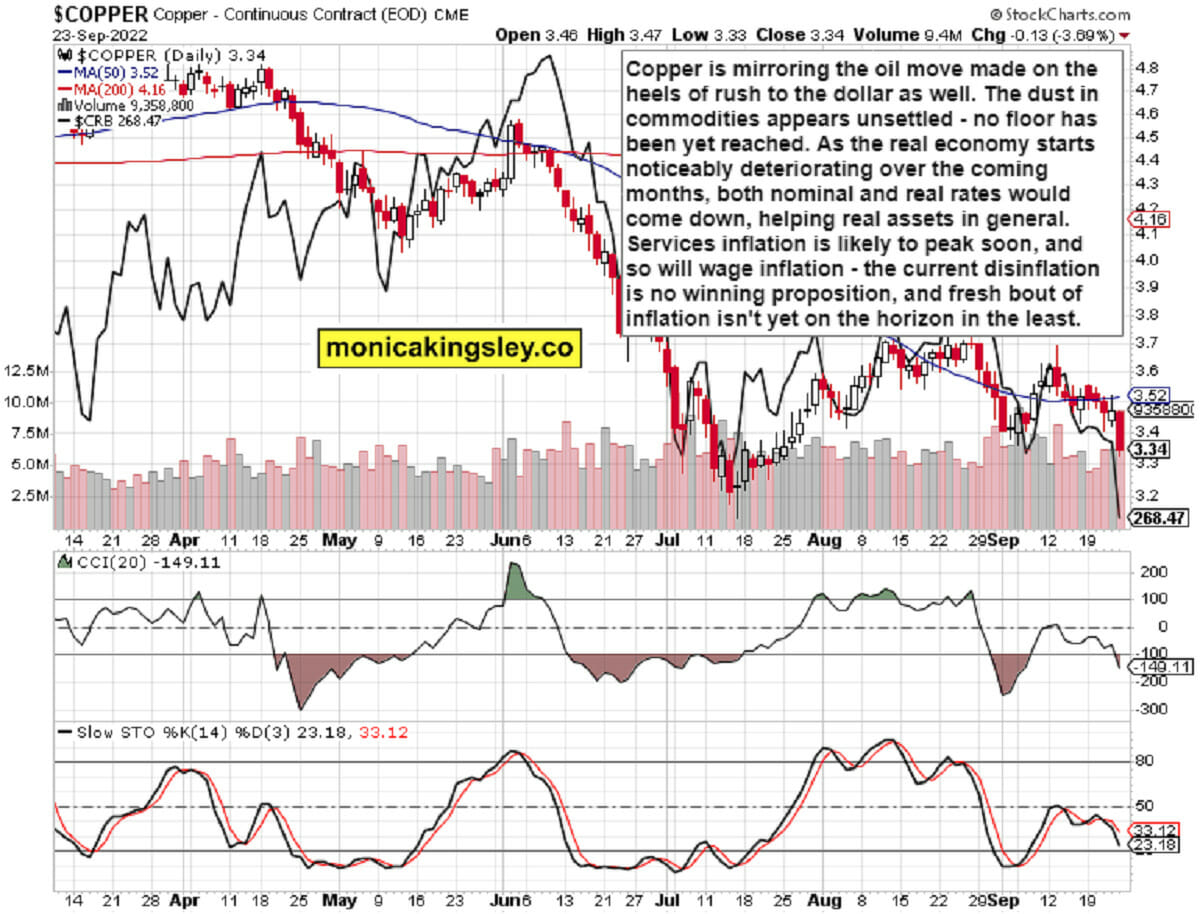
Copper
Copper is likewise reflecting the anticipated real economy impact, but would benefit from the coming Fed‘s focus shifting to real ecconomy support (remember how fast Powell turned in early Jan 2019?), and inflation not declining much below its persistently high 5-6% YoY CPI level of Dec 2022 (still my target).
It would be real assets, the commodities and precious metals superbulls, that would benefit from the Fed turning at the very least neutral (which would support selective beaten down stock sectors as well).
Bitcoin and Ethereum
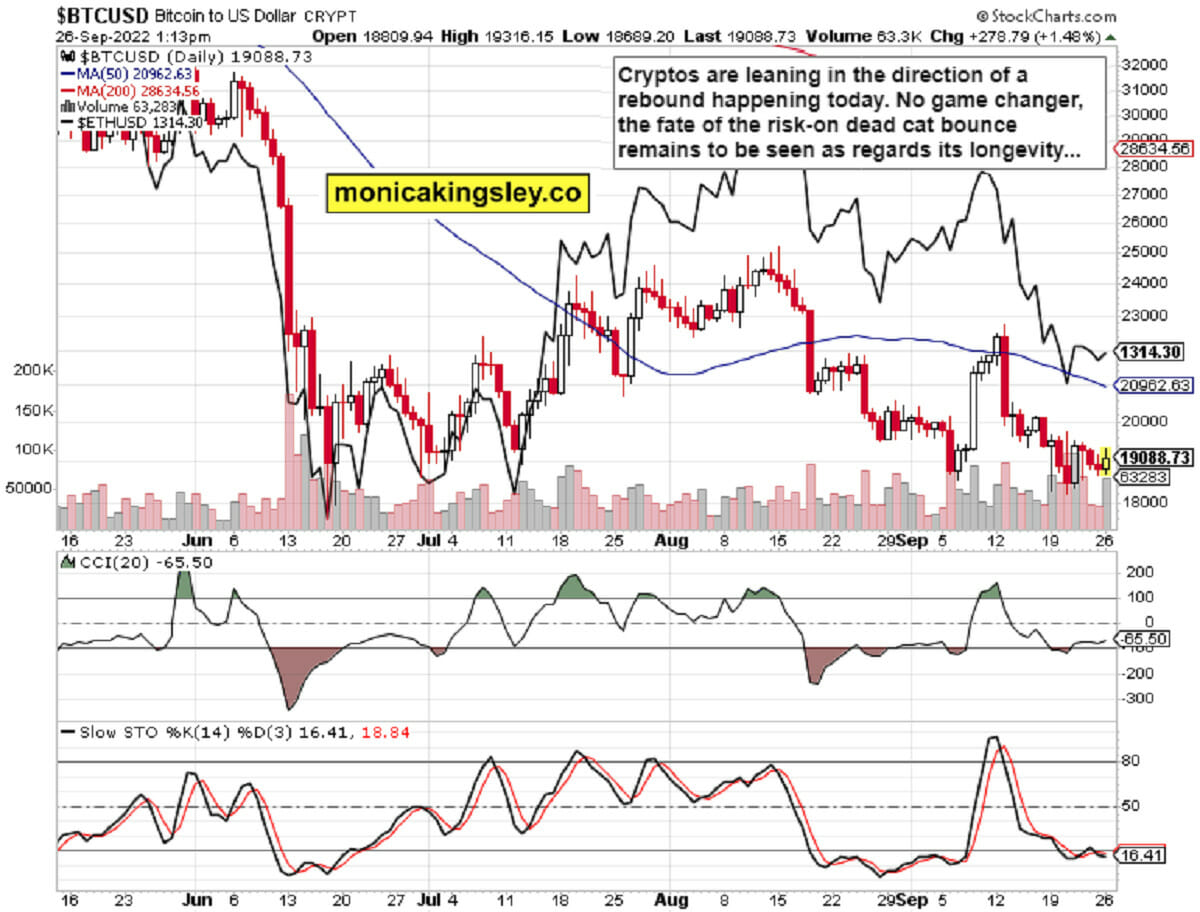
Cryptos are attempting to rebound today, meaning we would see retracements of Friday‘s downswings in other assets as well, accompanied by the dollar‘s intraday retreat off its daily highs, which is already playing out.
Thank you for having read today‘s free analysis, which is a small part of the premium Monica’s Trading Signals covering all the markets you’re used to (stocks, bonds, gold, silver, oil, copper, cryptos), and of the premium Monica’s Stock Signals presenting stocks and bonds only.
Both publications feature real-time trade calls and intraday updates. While at my homesite, you can subscribe to the free Monica‘s Insider Club for instant publishing notifications and other content useful for making your own trade moves on top of my extra Twitter feed tips. Thanks for subscribing & all your support that makes this great ride possible!
Thank you,
Monica Kingsley
Stock Trading Signals
Gold Trading Signals
Oil Trading Signals
Copper Trading Signals
Bitcoin Trading Signals
All essays, research and information represent analyses and opinions of Monica Kingsley that are based on available and latest data. Despite careful research and best efforts, it may prove wrong and be subject to change with or without notice.
Monica Kingsley does not guarantee the accuracy or thoroughness of the data or information reported. Her content serves educational purposes and should not be relied upon as advice or construed as providing recommendations of any kind. Futures, stocks and options are financial instruments not suitable for every investor. Please be advised that you invest at your own risk.
Monica Kingsley is not a Registered Securities Advisor. By reading her writings, you agree that she will not be held responsible or liable for any decisions you make. Investing, trading and speculating in financial markets may involve high risk of loss.
Monica Kingsley may have a short or long position in any securities, including those mentioned in her writings, and may make additional purchases and/or sales of those securities without notice.


